Sample Category Title
EUR/CHF Weekly Outlook
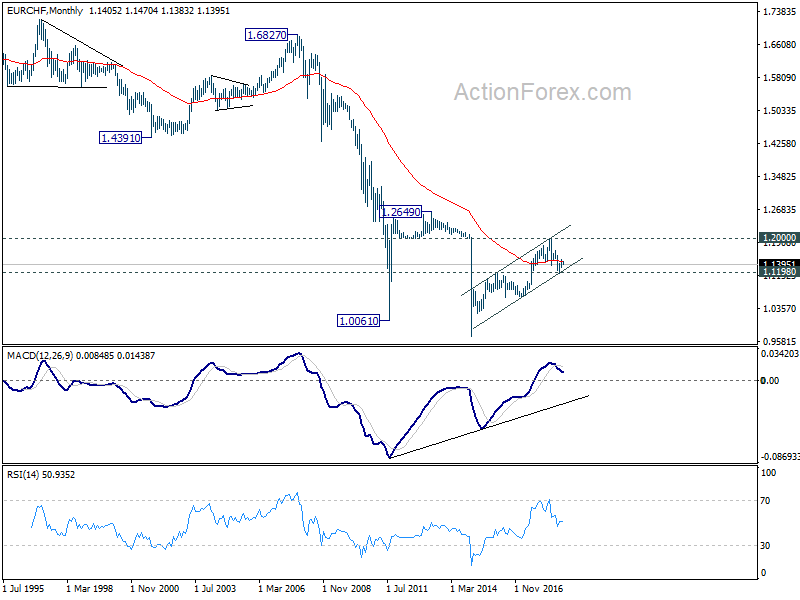
EUR/CHF's recovery from 1.1343 extended higher to 1.1470 last week but dropped sharply since then. The development argues that the recovery might have completed already. Initial bias is mildly on the downside this week for 1.1343 first. Break there will extend the fall from 1.1501 and target 1.1154/98 key support zone again. On the upside, break of 1.1470 will turn focus back to 1.1501. Decisive break of 1.1501 will revive the case of bullish reversal.
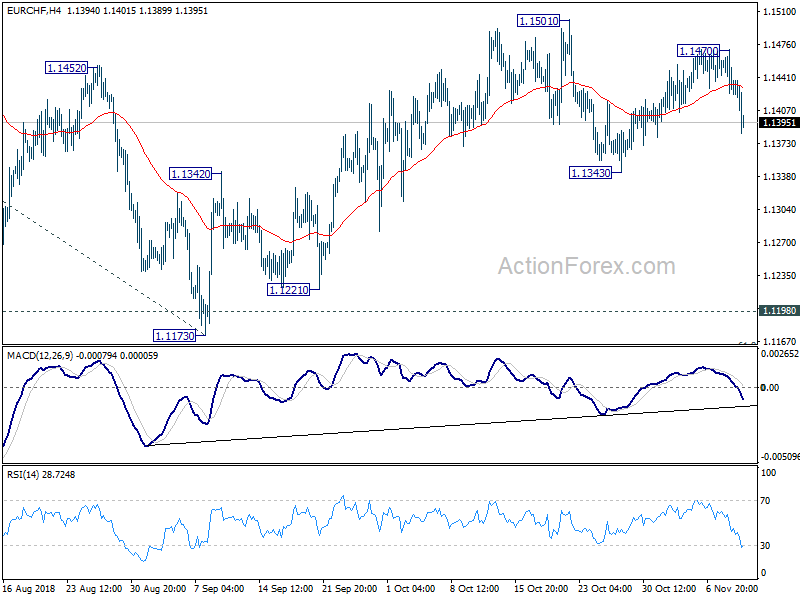
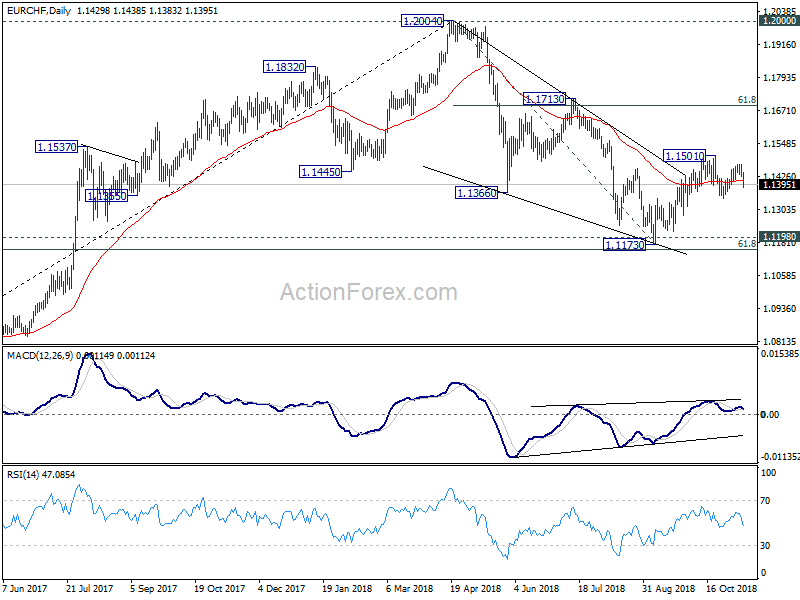
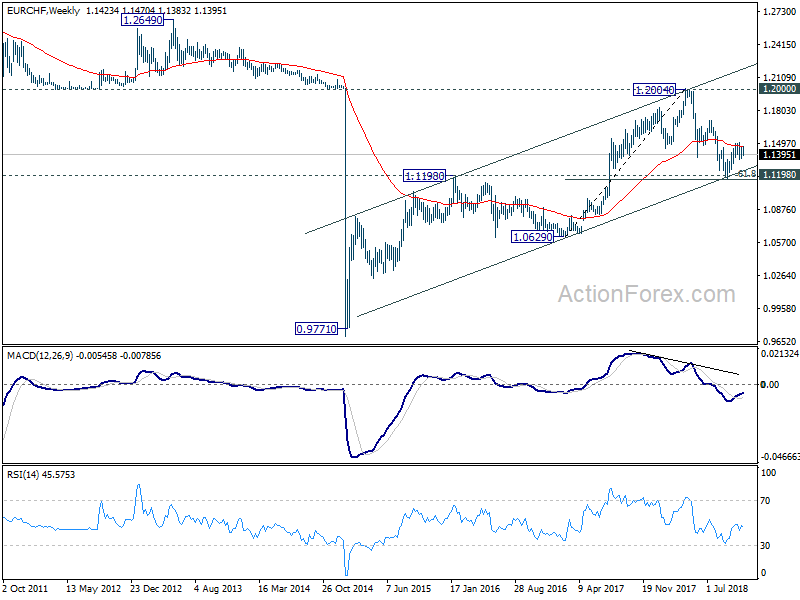
In the bigger picture, price actions from 1.2004 medium term top is seen as a correction only. Downside should be contained by support zone of 1.1198 (2016 high) and 61.8% retracement of 1.0629 to 1.2004 at 1.1154 to complete it and bring rebound. This cluster level is in proximity to long term channel support (now at 1.1243) too. A break of 1.2 key resistance is still expected in the medium term long term. However, sustained break of the mentioned support zone will mark reversal of the long term trend. In that case, 1.0629 key support will be back into focus.
Dollar and Yen Building Up Bullish Turnaround, Canadian Down on Oil Price Free Fall
There were some interesting turns in the financial markets last week. Global equities initially cheered after Democrats sealed a tremendous win in the US mid-term election by regaining majority in the House. But the lift quickly faded as stocks suffered quite notable setbacks towards Friday's close. It looked like US treasury yields are ready to resume recent up trend after FOMC statement, which did nothing to alter the expectation of a December hike. But yields then reversed on Friday and closed generally lower.
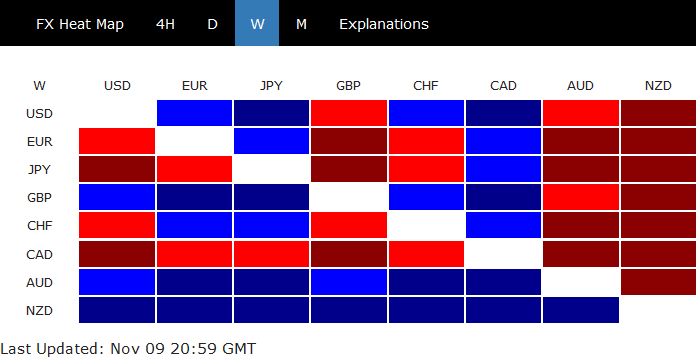
In the currency markets, for the week, Australian and New Zealand Dollar were strongest, as initially lifted by rebound in Asian stocks. Aussie was supported by slightly more up beat RBA economic outlook. Kiwi was also additionally boosted by strong employment data. Sterling was the third strongest as there was some Brexit optimism. Canadian Dollar was the weakest as crude oil was in free fall. It's followed by Yen on risk appetite and Euro on Italian's budget showdown with EU.
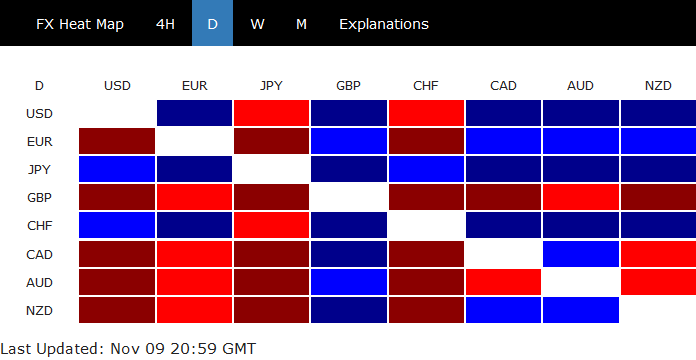
But, for Friday, Yen was clearly the strongest one, followed by Swiss Franc, as risk appetite receded. Dollar also extended post FOMC rebound. Sterling was the worst performing one after soft September GDP and the never ending Brexit impasse. Australian Dollar was the second weakest, followed by Canadian Dollar and then New Zealand Dollar. Friday's picture was in contrast with the weekly picture. Except that, Canadian Dollar was weak throughout. So, it looks like the markets, at least part of them, are turning around.
Dollar and yields tried to rally, but no follow through yet
Let's have a look at Dollar first. Both USD/JPY and USD/CAD took the lead by resuming recent rally. But EUR/USD was held above 1.1300 low. USD/CHF was kept below 1.0094 high. Thus, there is no confirmation of broad based strength in Dollar yet. Though, GBP/USD's steep fall now put focus back t 1.2951 minor support. And break there will indicate near term reversal and could help lift Dollar up elsewhere.
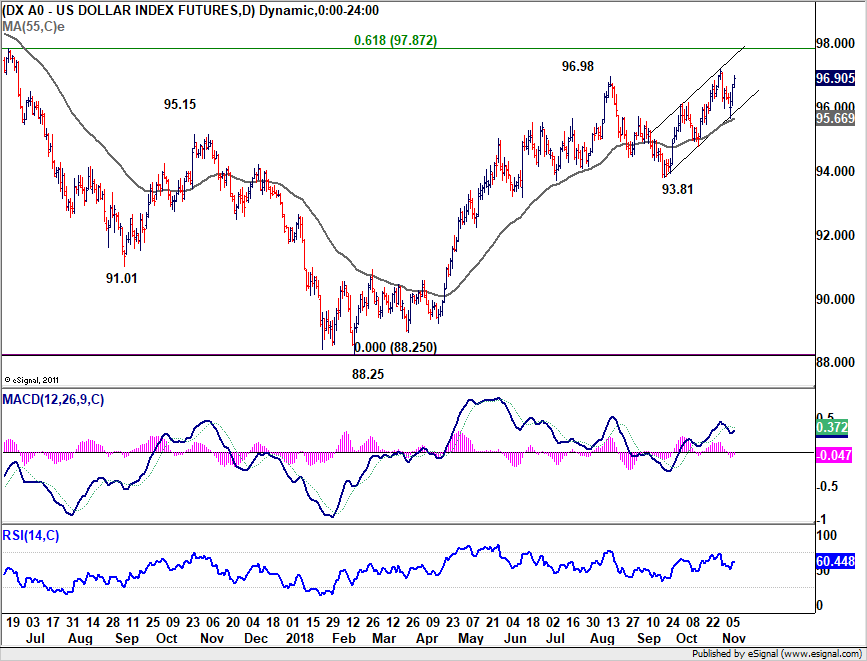
Developments in Dollar Index was positive too even though it has yet to confirm it's strength The strong support seen from near term rising channel as well as rising 55 day EMA is certainly bullish. But it has yet to take out 96.98 key resistance decisively.
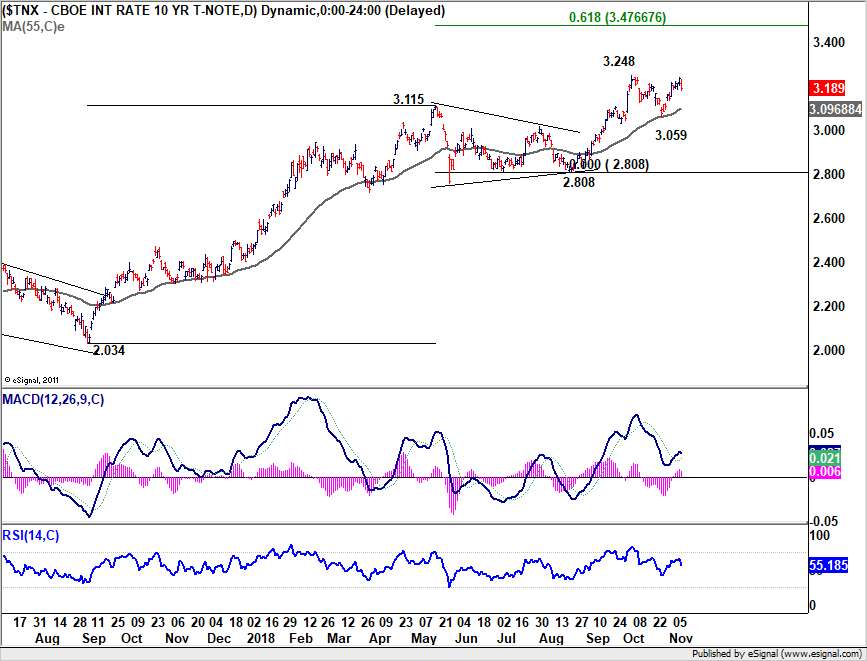
It also looked like 10-year yield could follow 5-year yield higher by breaking 3.248 resistance to resume medium term up trend. The rebound from 3.059 after touching rising 55 day EMA was also bullish. Yet, TNX was rejected mildly by 3.248 resistance to close at 3.189. This is a factor limiting Dollar's rally on Friday.
Yen crosses defended key resistance, ready for reversal?
Yen defended some key levels last week. EUR/JPY hit as high as 130.14 but failed to break out 130.20 near term resistance and retreated. GBP/JPY was even strong and hit as high as 149.48. But it was rejected by 149.70 near term resistance to closed down at 147.66. Indeed, GBP/JPY was a top mover on Friday, indicating the intensity of the selloff.
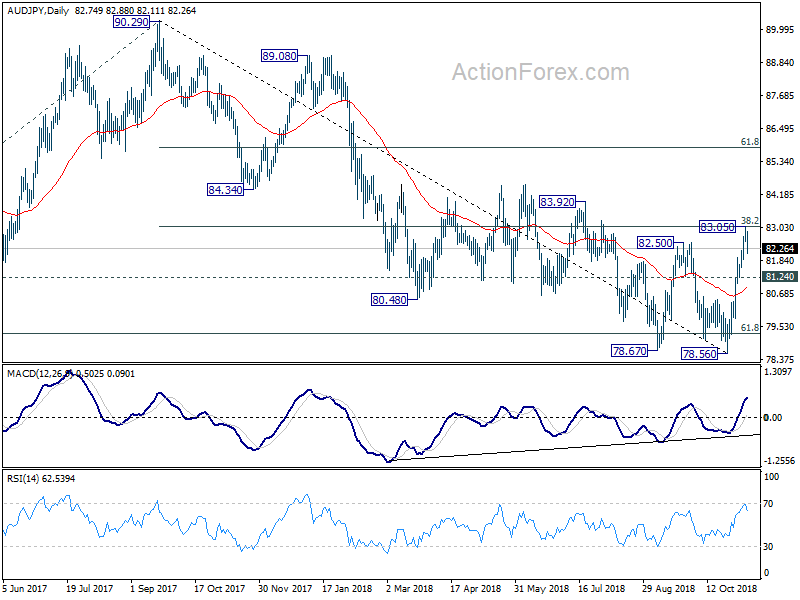
AUD/JPY also hit as high as 83.05 but was rejected by 38.2% retracement of 90.29 to 78.65 at 83.04 retreated sharply Near term outlook stays bullish, as long as 81.24 support holds. However, break of 81.24 on come back of risk aversion will invalidate the double bottom (78.67, 78.56) bullish reversal case. Medium term bearishness will be revived too.
More weakness in stocks, Asia in particular
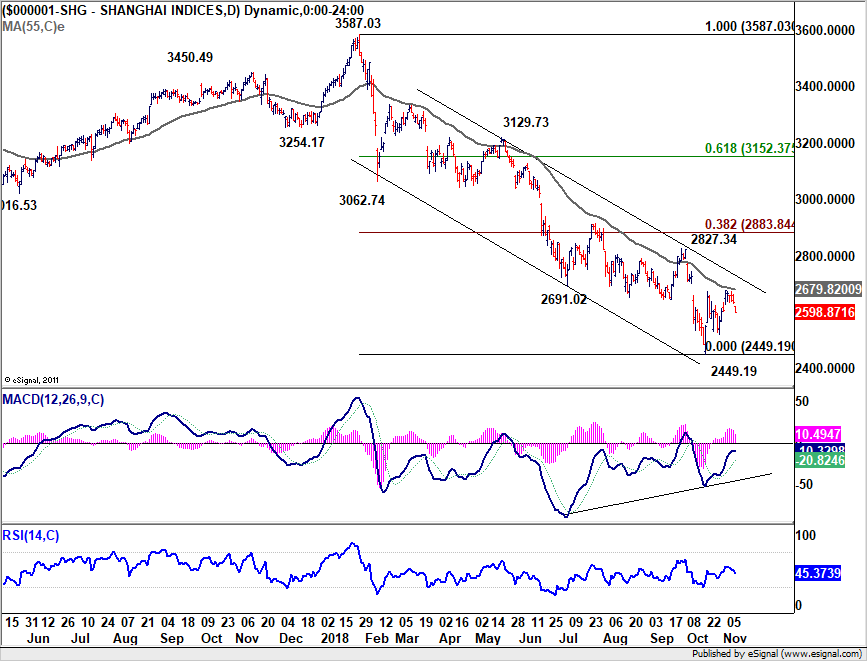
Talking about risk aversion, China Shanghai SSE tried to break through 55 day EMA for a whole week but failed. It finally gave up to close sharply lower at 2598.87. More importantly, the decline started with a gap down. And it that also kept SSE indicate medium term falling channel, and makes the rebound from 2449.19 look corrective. Some might point to the optimism on solving some US-China trade conflict at the Trump-Xi meeting later in the month. But investors seemed not too convinced by such hopes.
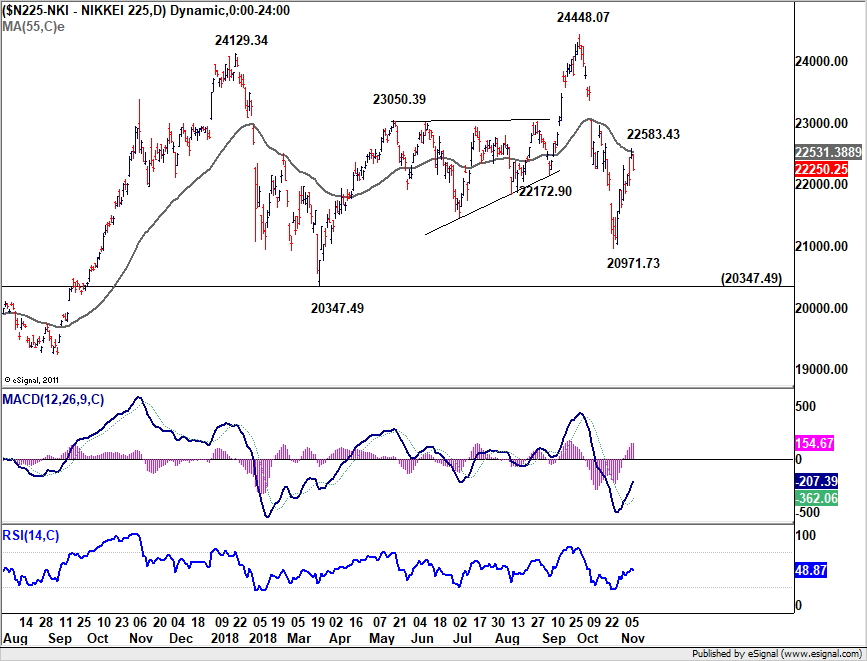
Nikkei is not as bearish as the SSE. But the rejection by 55 day EMA and the sharp decline on Friday was not a good sign too.
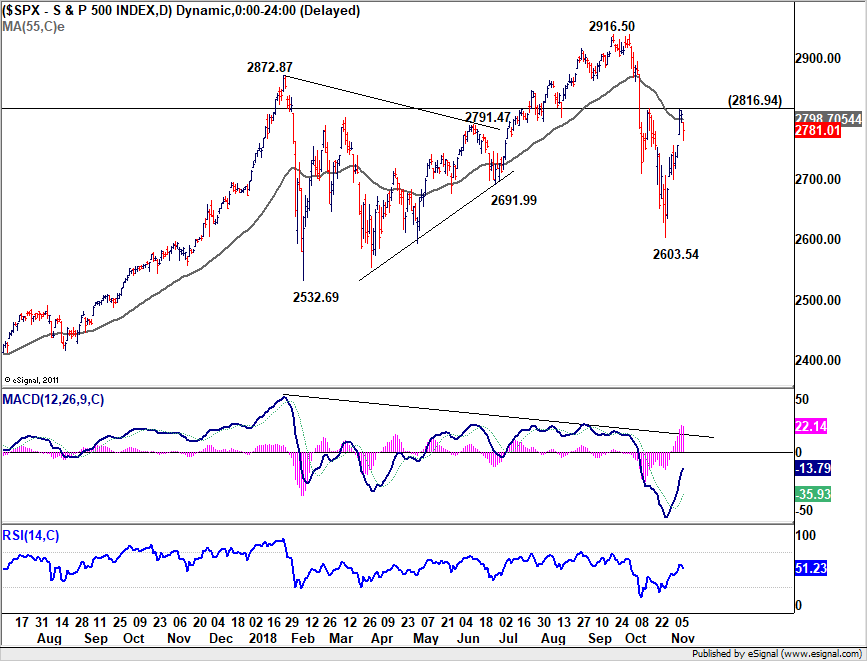
The development of Nikkei was somewhat mirrored in S&P 500, which was rejected by 2816.94 resistance and 55 day EMA. But DOW has taken out equivalent resistance level. So the overall picture of SPX is probably even less bad. But comparing the three, it's clear that the SSE looks rather bearish.
WTI oil in clear medium term decline
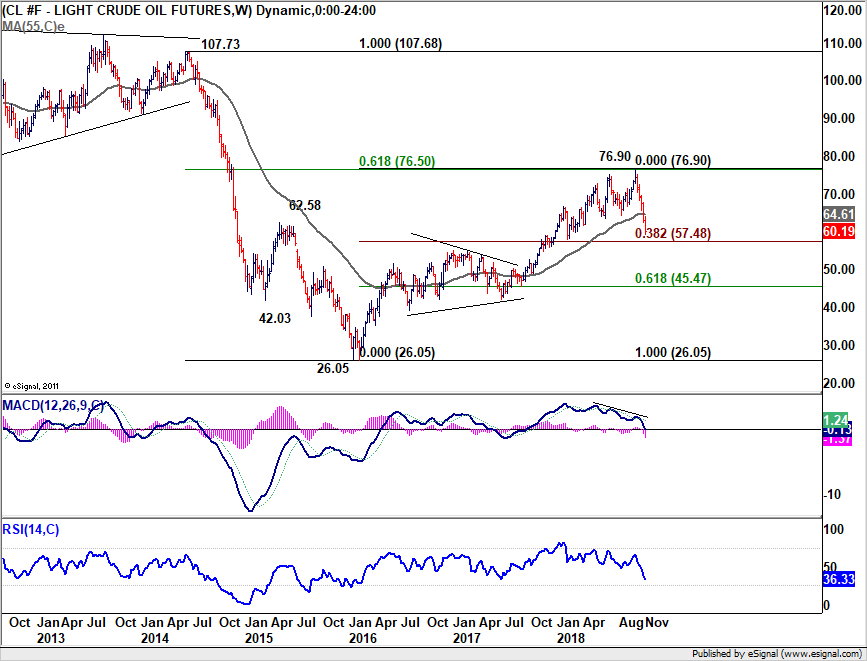
The more consistent development was found in WTI crude oil. It's now rather clear that 76.69 is a medium term top. Up trend from 26.05 should have completed after hitting 61.8% retracement of 107.68 to 26.05 at 76.50, on bearish divergence condition in weekly MACD. The decline from 76.90 should be developing into a medium term move. 38.2% retracement of 26.05 to 76.90 at 57.48 would likely be taken out eventually for 61.8% retracement at 45.47.
To conclude, there is prospect of more Dollar strength ahead. But it has to break through 1.1300 against Euro first. And it should best be accompanied by upside breakout in 10 year yield. Or a reversal in yield would drag Dollar down and trigger a rebound in EUR/USD. There is prospect of a bullish turnaround in Japanese yen should selloff in Asian equities intensify. For the same reason, there is prospect of a bearish turn around in Aussie. But it would likely be overshadowed by Canadian Dollar which is dragged down by selloff in oil prices. Euro could stay overall mixed on Italy which Sterling is a wild card on Brexit.
Position trading strategy
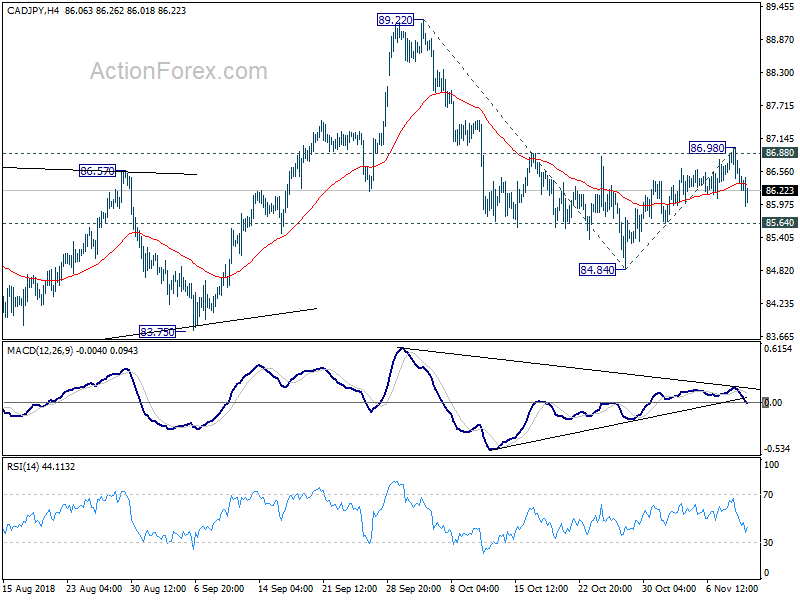
Just like last week, Dollar is a candidate for going long but it cannot convince us yet. Instead, we'll turn to CAD/JPY for short opportunity. The corrective recovery from 84.84 has likely completed at 86.98 after hitting 86.88 resistance. Fall from 89.22 is possibly ready to resume.
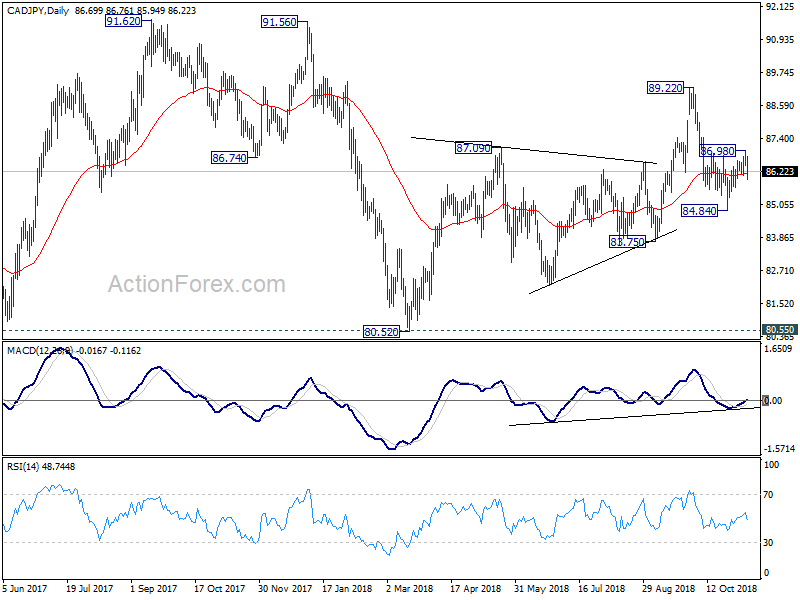
The bigger picture suggests that rise from 80.52 (March low) is a corrective three wave move that has completed at 89.22. Fall from 89.22 is, in a more bearish case, resuming the down trend from 91.62 (2017 high) through 80.52/55 support. Or in a less bearish case, fall fro 89.22 is a falling leg in the medium term range pattern. In either case, deeper decline is in favor to have a test on 80.52 low.
So our strategy is selling CAD/JPY on break of 85.64 minor support. That will add more credence to the bearish case of resuming decline from 89.22. Stop will then be put at 87.00, slightly above 86.98. First target is 100% projection 89.22 to 84.84 from 86.98 at 82.60. But we're looking at 80.52 as the target. For the latter, risk/reward is at around 1:3.76.
EUR/USD Weekly Outlook
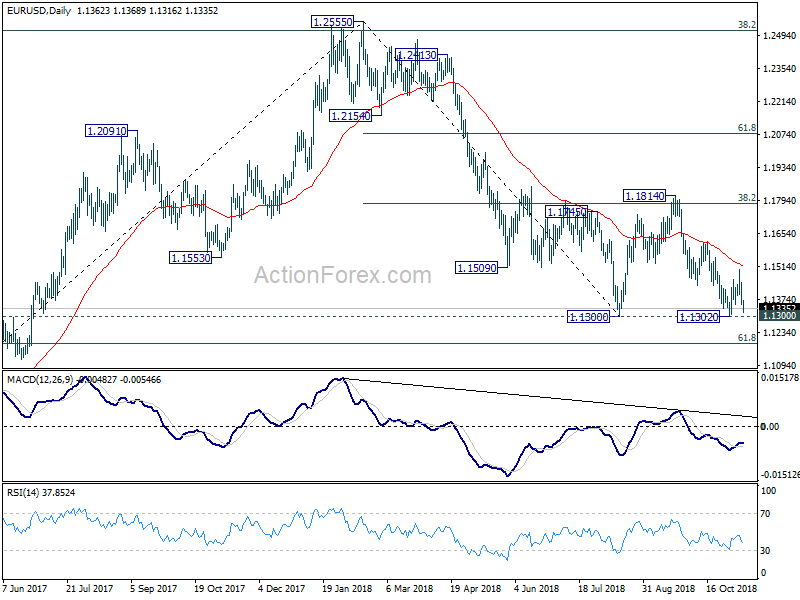
EUR/USD's recovery was limited at 1.1499 last week, below falling 55 day EMA, and dropped sharply since then. Initial bias stays on the downside this week for 1.1300 low. Decisive break there will resume the whole down trend from 1.2555 and target 1.1186 fibonacci level next. On the upside, though, break of 1.1499 resistance will turn bias back to the upside for another rebound. But after all, price actions from 1.1300 are seen as developing into a corrective pattern. So, down trend resumption would just be delayed.
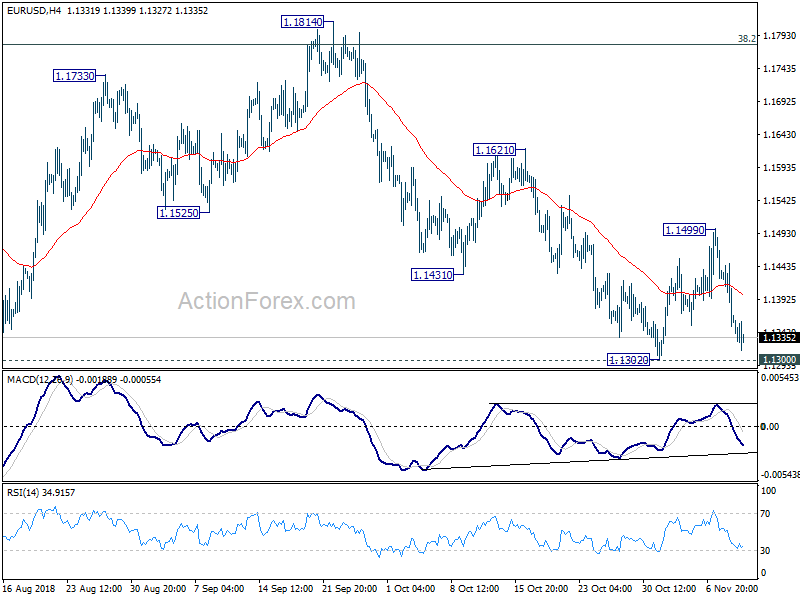
In the bigger picture, price actions from 1.1300 is seen as a corrective pattern. Decisive break of 1.1300 will resume the down trend from 1.2555 to 61.8% retracement of 1.0339 (2017 low) to 1.2555 at 1.1186 next. Sustained break there will pave the way to retest 1.0339. In case the consolidation from 1.1300 extends, upside should be limited by 1.1814 and 38.2% retracement of 1.2555 to 1.1300 at 1.1779. to bring down trend resumption eventually.
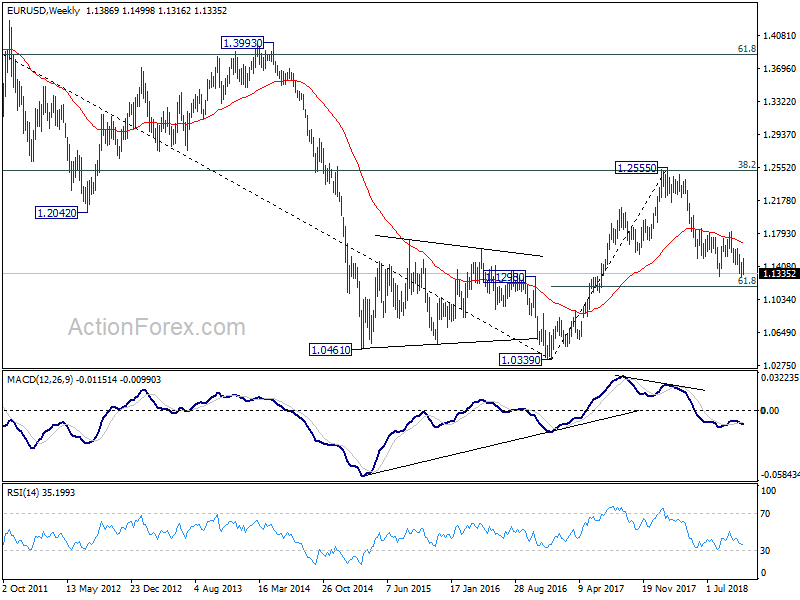
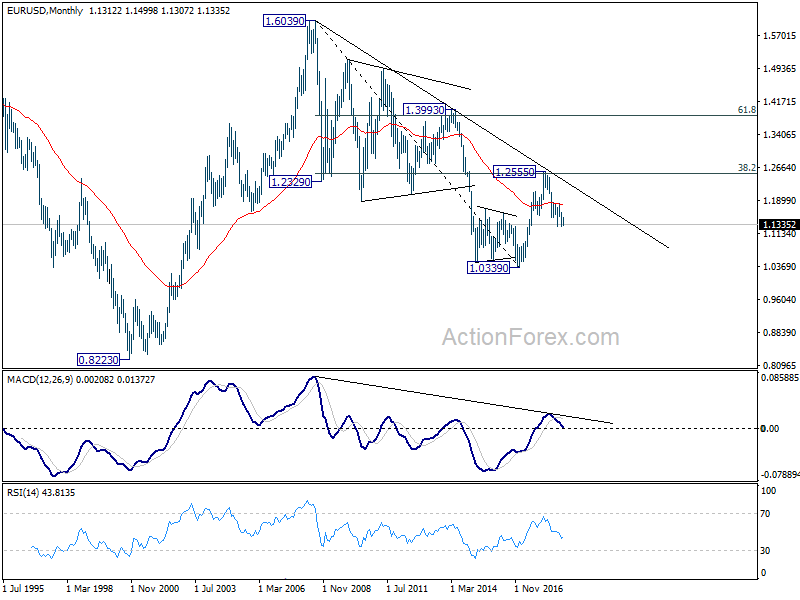
In the long term picture, the rejection from 38.2% retracement of 1.6039 to 1.0339 at 1.2516 argues that long term down trend from 1.6039 (2008 high) might not be over yet. EUR/USD is also held below decade long trend line resistance. Firm break of 61.8% retracement of 1.0339 to 1.2555 at 1.1186 should at least bring a retest on 1.0339 low.
Summary 11/12 – 11/16
Monday, Nov 12, 2018
[php_everywhere instance="1"]
Tuesday, Nov 13, 2018
[php_everywhere instance="2"]
Wednesday, Nov 14 2018
[php_everywhere instance="3"]
Thursday, Nov 15, 2018
[php_everywhere instance="4"]
Friday, Nov 16, 2018
[php_everywhere instance="5"]
Weekly Economic and Financial Commentary: Fed on Track for December Rate Hike
U.S. Review
Fed on Track for December Rate Hike
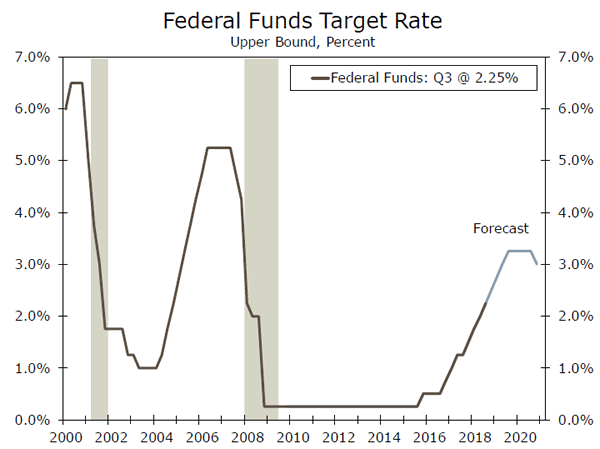
- The FOMC voted unanimously this week to maintain the target range for the federal funds rate at 2.00%-2.25%, a decision widely anticipated by market participants. All signs point to a rate hike at the December meeting.
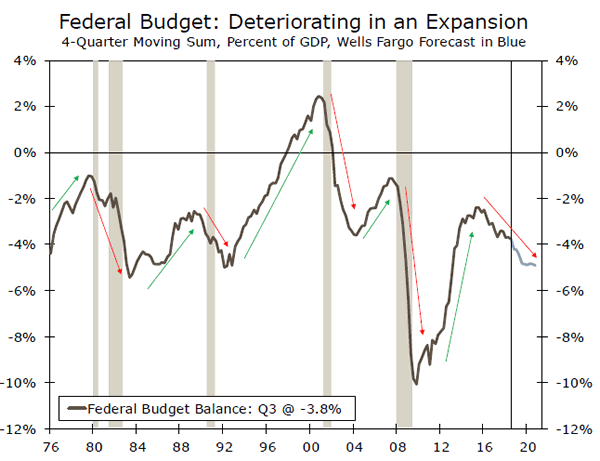
- Midterm elections ushered in a divided government, which is inherently less conducive to sweeping change. As such, we see limited potential for an extension of fiscal stimulus.
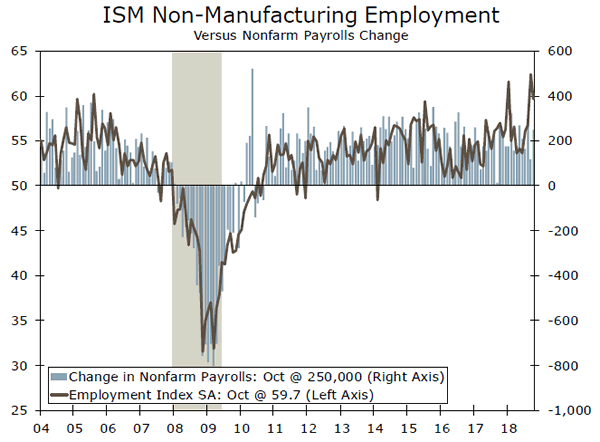
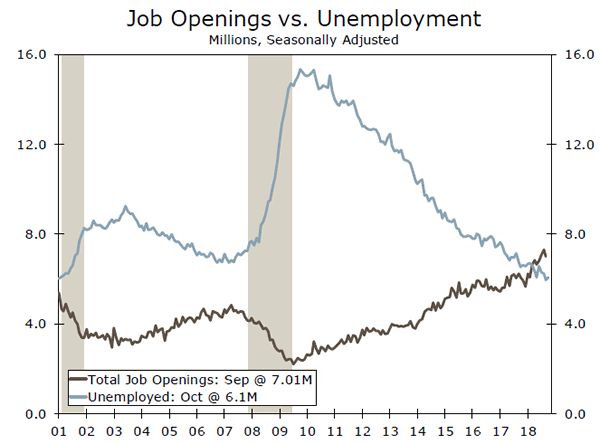
- Data released this week affirmed the FOMC's assessment of the economy as strong. The ISM non-manufacturing index continues to indicate robust expansion and JOLTS data reflected a labor market that is growing historically tight.
Fed on Track for December Rate Hike
The Federal Open Market Committee (FOMC) voted unanimously this week to maintain the target range for the federal funds rate at 2.00%-2.25%, a decision widely anticipated by market participants. As this was the final FOMC meeting without a press conference, attention was focused squarely on the policy statement, which delivered few surprises. The committee's evaluation of the economy remains upbeat, with five instances of "strong" used to describe the pace of activity. Notably, the committee indicated that business fixed investment, which expanded at an underwhelming 0.8% pace in Q3, has "moderated"; it had previously been described as "strong". Nevertheless, nonfarm payrolls have expanded by an average of 218,000 over the past three months, and the first reading of Q3 GDP growth came in at 3.5%, following a 4.2% pace in Q2. With headline and core PCE inflation on target at 2.0%, the FOMC expressed confidence in its plan of further gradual tightening. We expect a rate hike in December, followed by three more in 2019. The statement made no mention of recent financial market volatility, which admittedly receded this week, perhaps as jitters surrounding the future path of monetary policy and interest rates abated somewhat. There was no further adjustment to the interest rate on excess reserves, a relatively new Fed tool for the maintenance of the effective federal funds rate within its target range.
Political events took center stage midweek, as the Democrats regained control of the House and the Republicans maintained control of the Senate, largely in line with expectations. While the 2016 election was a watershed political event that marked a clear inflection point in fiscal policy, divided government is inherently less conducive to sweeping change. As such, we see limited potential for further tax reform. Moreover, we expect sufficient bipartisan cooperation leading up to the 2020 elections to prevent outright fiscal contraction, but not an extension or expansion of the procyclical stimulus enacted at the beginning of 2018. However, a plausible case could be made for either significant gridlock or for further stimulus, perhaps in the form of longdiscussed infrastructure spending, which would present downside or upside risks, respectively, to our baseline forecast.
Data released this week affirmed the FOMC's assessment of the economy. The ISM non-manufacturing index came in slightly below the 21-year high reached last month, but at 60.3 it still indicates a robust pace of expansion. Elevated readings for the order backlogs and supplier delivery components point to tight supply chains and gradually building prices pressures. Indeed, the prices paid measure was above 60 for the 10th consecutive month. The current conditions and employment components both fell 2.7 points, but at 59.7 the latter remains consistent with solid employment gains.
Also indicative of labor market strength were JOLTS data that revealed the number of job openings exceeded the number of unemployed persons by over one million in September, the month during which the unemployment rate fell to a 49-year low of 3.7%.
U.S. Outlook
Consumer Price Index • Wednesday
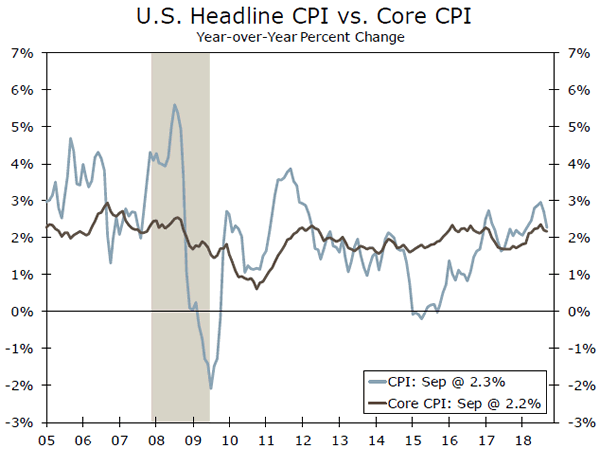
The consumer price index (CPI) was soft in September. Headline inflation was held down by a drop in energy prices, but a flat-tonegative reading in food prices also weighed on overall price growth. Excluding food and energy from the CPI, core inflation was also soft. Weakness here, however, appears to be tied to goods prices, specifically motor vehicles. The 3.0% drop in used auto prices was the most significant driver of softening, but is likely not the start of a trend, given that the Manheim used car index has continued to rise in recent months.
Looking ahead, we expect price pressures to steadily build, as more businesses feel pressure from tariffs. Tariff effects may be drawn out, since businesses may have some ability to absorb increased costs, but with capacity tight, they may find it easier to pass on higher input costs to consumers. We expect the CPI to climb to 0.3% in October. Previous: 0.1% Wells Fargo: 0.3%
Consensus: 0.3% (Month-over-Month)
Retail Sales • Thursday
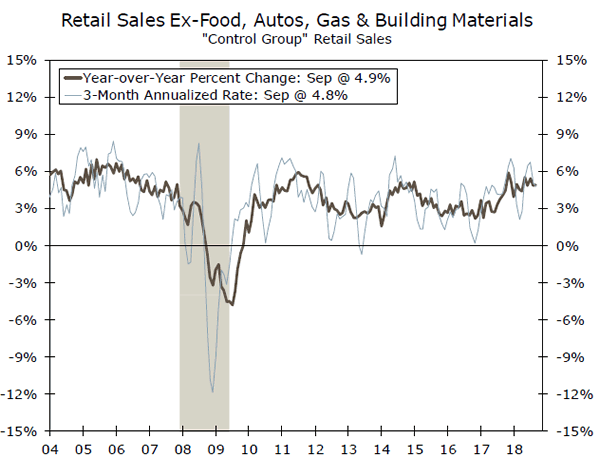
Retail sales were held down by spending at restaurants and gasoline stations in September. The softness in headline sales came despite a 0.8% jump in auto sales, which was the largest monthly increase since March. This means dealers were able to move inventory over the month, as manufacturer sales of autos to dealers rose to 17.4 million, or a 4.5% increase over August. Excluding food, autos, gasoline and building materials, control group sales were up a healthy 0.5%–consistent with the surge in real personal consumption expenditures registered in the third quarter.
Measures of consumer confidence still remain at or near the highest levels of the past 18 years, which leads us to expect a strong final quarter of the year. Sales growth will likely slow next year, however, as the initial boost from tax cuts starts to fade for consumers.
Previous: 0.1% Wells Fargo: 0.4% Consensus: 0.6% (Month-over-Month)
Industrial Production • Friday
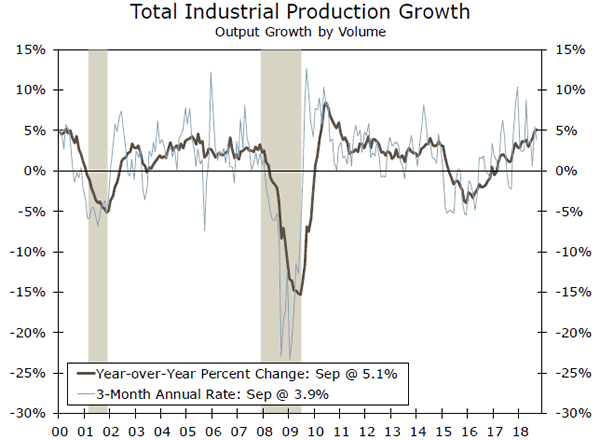
Industrial production rose 0.3% in September. High oil prices over the past few months continued to support strength in mining output, while gains in motor vehicles and machinery were evident in manufacturing production. Even with it being the fourth warmest Sept. on record, according to the National Oceanic and Atmospheric Administration, utilities output was flat over the month.
Despite a decent month of production, headwinds point to a moderation in output. Last week, we learned that the ISM manufacturing index eased in October. While the overall index remains at a still-strong level, a sharp drop in new orders suggests a further slowdown in manufacturing may be in store. A strong dollar and higher interest rates could weigh on activity, while trade tensions show no sign of easing up, and uncertainty about the environment will likely be a deterrent for capital spending going forward.
Previous: 0.3% Wells Fargo: 0.2% Consensus: 0.2% (Month-over-Month)
Global Review
Challenges Persist in the Global Economy
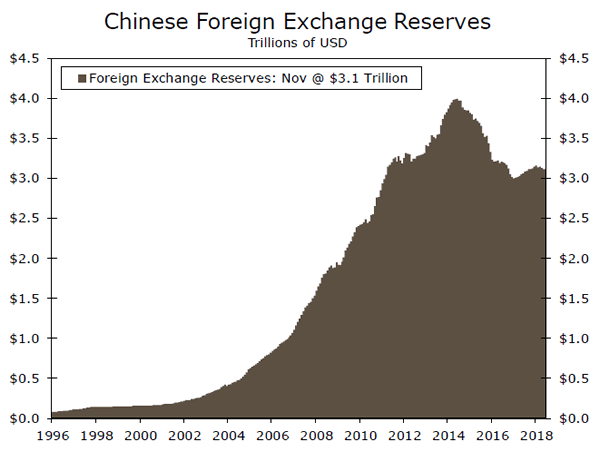
- Chinese foreign exchange reserves fell by nearly $34 billion in October, the third consecutive monthly drop amid continued pressure on the yuan.
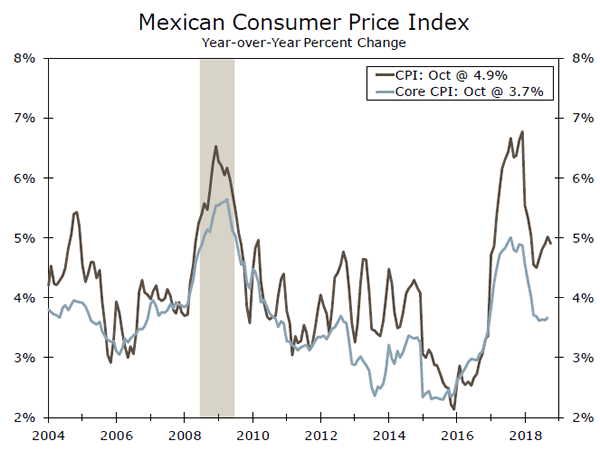
- With the Bank of Mexico set to meet next week, both headline and core consumer price inflation remains above the central bank's target.
- Real GDP in the United Kingdom accelerated in Q3, growing at a 2.5% annualized pace, the fastest since Q4-2016. More ominously, total business investment declined at a 4.8% annualized rate in Q3 and is now down 1.9% year-over-year, the largest decline since Q1-2016.
Challenges Persist in the Global Economy
In a week dominated by the U.S. midterm elections, it was a relatively quiet week of international economic data. Chinese foreign exchange reserves fell by nearly $34 billion in October, the third consecutive monthly drop. The decline has coincided with continued pressure on the yuan, which has weakened considerably in recent months amid concerns about the ongoing U.S.-China trade dispute and slowing Chinese economic growth.
Why do FX reserves matter? China's sizable foreign exchange reserves give the country's policymakers flexibility when challenges arise. In late 2015/early 2016, for example, FX reserves in China declined precipitously as authorities sold securities to defend the currency and halt an acceleration in capital outflows. While Chinese FX reserves are still quite sizable, they are also not unlimited and remain well below their peak in 2014. Should Chinese policymakers have to burn through another large chunk of reserves as they did in 2015/2016, FX reserves in the country could reach the lowest level in nearly a decade. This in turn could mean less firepower to respond to the next crisis, whenever that occurs.
As we discussed in last week's global outlook section, inflation in Mexico has been a bit of a rollercoaster in recent years, largely reflecting significant volatility in the value of the Mexican peso versus the U.S. dollar. Price gains have slowed, but they remain high relative to the central bank's 3% target with a +/- 1 percentage point band (middle chart). The resilience in headline CPI inflation is likely contributing to a cautious stance from Mexico's central bank, which has hiked rates a cumulative 475 bps since 2015 and has given no signals of an intention to cut interest rates any time soon. The Bank of Mexico meets next Thursday, and with inflation remaining high in October and monetary policy continuing to tighten in the U.S. and Canada, the risks seem tilted more towards monetary policy tightening rather than easing.
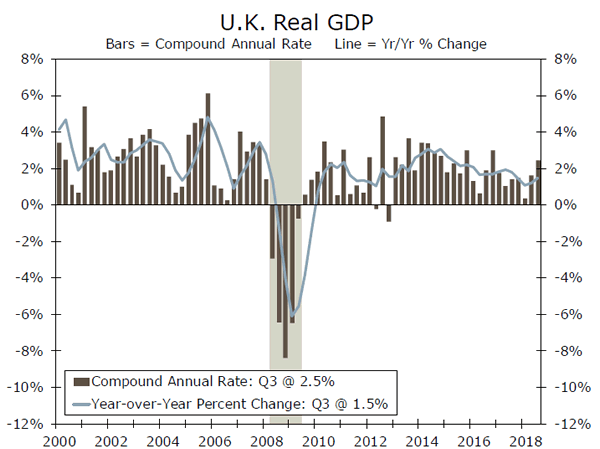
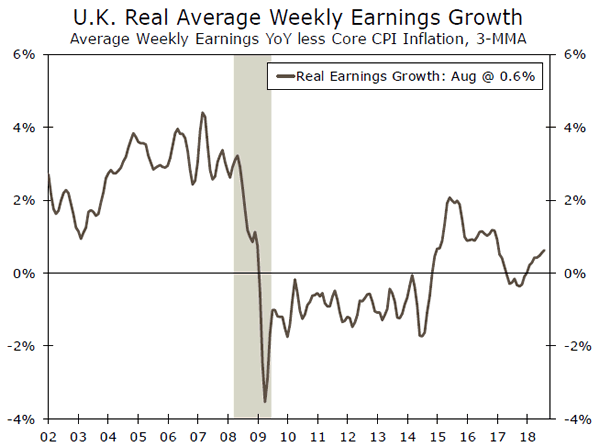
Real GDP in the United Kingdom accelerated in Q3, growing at a 2.5% annualized pace, the fastest since Q4-2016 (bottom chart). Trade was a major driver of growth in the quarter. Exports surged to more than an 11% annualized growth rate, while imports were flat over the quarter despite decent growth in personal consumption (2.2%, annualized). A slowdown in inflation (more on that in the outlook section) and strong earnings growth have pushed real wage growth higher, likely providing a boost to economic growth of late (bottom chart). There were concerns earlier in the year that the U.K. economy might continue to decelerate after an especially weak first quarter. After two straight quarters of faster growth despite the looming Brexit deadline at the end of March, those fears appear to have been overblown.
More ominously, total business investment declined at a 4.8% annualized rate in Q3 and is now down 1.9% year-over-year, the largest decline since Q1-2016. The soft pace of business investment (it has not been above 3% year-over-year since Brexit) is a headwind to both faster growth in the near-term and to the economy's productive capacity in the long-run. Thus, despite the turnaround, challenges remain in the U.K. economy.
Global Outlook
Japan GDP• Tuesday
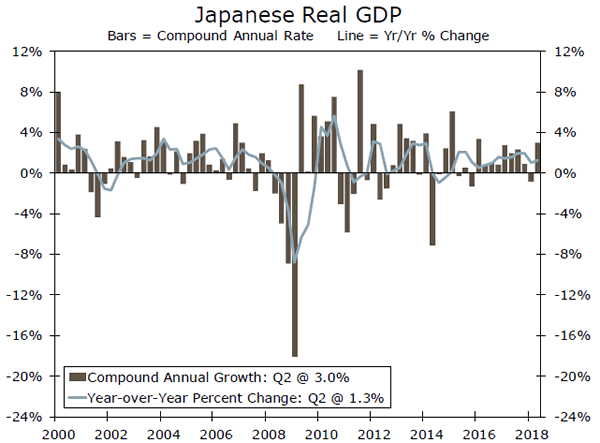
Real GDP growth in Japan rebounded in Q2 after back-t0-back weak quarterly showings in Q4-2017 and Q1-2018. Private consumption bounced back, growing at a strong 2.9% annualized rate, and business investment grew at the fastest pace since Q1-2015. Even with the gain, however, year-over-year real GDP growth in Japan is just 1.3% at present, down from a 2% pace in the second half of 2017.
The Bloomberg consensus is looking for an annualized decline of 0.9% in Japanese real GDP next week. If realized, this would bring the year-over-year pace of economic growth down to about 0.5%, the lowest since Q1-2016. For the Bank of Japan, the fight against slow growth and low inflation looks set to continue for the foreseeable future. For global growth more broadly, the divergence between the United States and many of the world's other major developed economies appears even more pronounced, should the consensus view come to pass.
Previous: 3.0% Wells Fargo: -1.0% Consensus: -0.9% (Quarter-over-Quarter, Annualized)
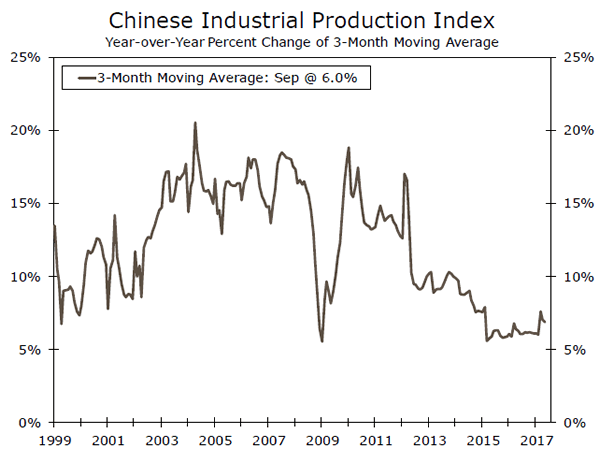
China Industrial Production • Tuesday
Concerns about an economic slowdown in China have been on the rise of late, and next Tuesday will offer the initial look at some key Q4 data on the Chinese economy, including industrial production, fixed investment and retail sales. In Q3, real GDP growth in China slowed, falling from a 6.7% year-over-year pace to 6.5%. Though a relatively small move, it was the first move of more than +/- 0.1 percentage points in Chinese real GDP growth since Q1-2015. The Chinese authorities have responded to this slowdown with a variety of easing measures via both fiscal and monetary policy.
With a potential meeting between President Trump and President Xi on the horizon, soft economic data next week could put some additional pressure on Chinese policymakers to resolve the U.S.-China trade spat sooner rather than later. To reflect these risks, our forecast for real GDP growth in China has eased a bit recently, to 6.6% in 2018, 6.1% in 2019 and 6.0% in 2020.
Previous: 5.8% Consensus: 5.8% (Year-over-Year)
U.K. CPI • Wednesday
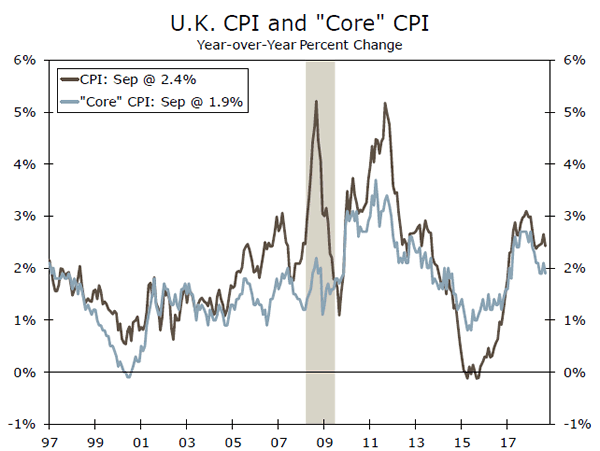
Consumer price inflation in the United Kingdom continues to come down as the effect from the pound's sharp depreciation post-Brexit keeps fading. In its most recent meeting, the Bank of England (BoE) noted that it does not expect inflation to fall much further, with price growth instead holding fairly steady near the 2% target. With "aggregate supply and demand now broadly in balance" according to the BoE, the uncertainty surrounding Brexit appears to be the only factor holding the central bank back from initiating additional rate hikes. The minimal slack in the economy has been evident in recent wage data. Average weekly earnings (excluding bonuses) were up 3.1% on a 3-month moving average basis over the year through August, the highest reading since January 2009. With inflation coming down, real wages are accelerating amid this recent momentum in nominal wage growth. We look for an eventual Brexit resolution to give way to two BoE rate hikes next year in Q2 and Q4.
Previous: 2.4% Wells Fargo: 2.5% Consensus: 2.5% (Year-over-Year)
Point of View
Interest Rate Watch
Fed Maintains Course for December
Getting lost in the whirlwind of the U.S. midterm elections, the Federal Open Market Committee (FOMC) held its next-tolast meeting of the year this past week.
As expected, the FOMC decided in a unanimous vote to leave its federal funds target rate unchanged at 2.00%-2.25%. With no outlook update or press briefing, focus was centered entirely on the policy statement. Of particular interest was officials' assessment of the U.S. economy and whether any new signals were being sent as to a change in the Fed's projected pace of interest rate tightening, given the implicit acknowledgement last meeting that the funds rate may have entered neutral territory. Anyone looking for additional clarity was disappointed, as the statement was little changed compared to September's update, thereby maintaining current policy tightening expectations.
The economic information flow since the September meeting has been largely positive, which was reaffirmed in officials' "strong" characterization of the labor market and overall economic activity. The FOMC did, however, downgrade the assessment of business fixed investment following a decelerating pace of growth in the third quarter. With core PCE inflation spot on the 2.0% target, there was no change to the statement's description of inflation.
In sum, the market received no new information that would suggest any change in expectation for further gradual rate hikes. Forward guidance remains intact as the Fed sees the economy moving in the right direction against the pace of policy action taken so far. Policy watchers will need to wait until November 29 when the meeting minutes are released to see if there was any instructive dialogue over the future path for interest rates and the balance sheet, both hot topics within financial market circles.
We expect the Fed to raise the federal funds rate target range 25 bps at the December meeting. The markets are increasingly buying in, pricing said policy rate action at around a 75% probability. The real debate occurs next year, when future rate increases will be scrutinized for possibly being a step too fast or too far.
Credit Market Insights
Consumer Credit and Rising Rates
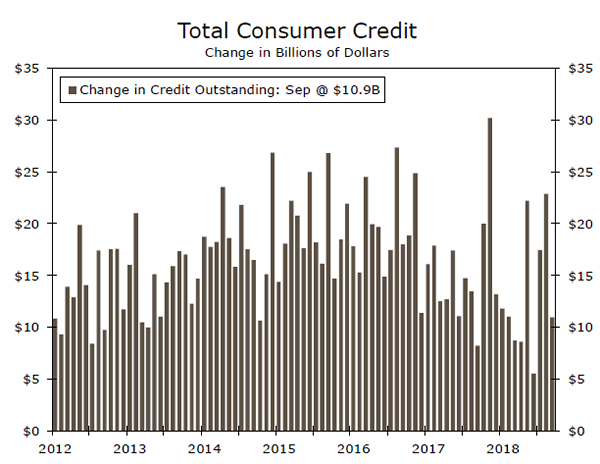
Data released this week showed that consumer credit rose just $10.9 billion in September, the lowest gain since June (top chart). Non-revolving credit accounted for all of the gain, as revolving credit contracted $31.2 million. The average monthly change in revolving credit is just $1.4 billion year to date, compared to $3.8 billion for the same period in 2017.
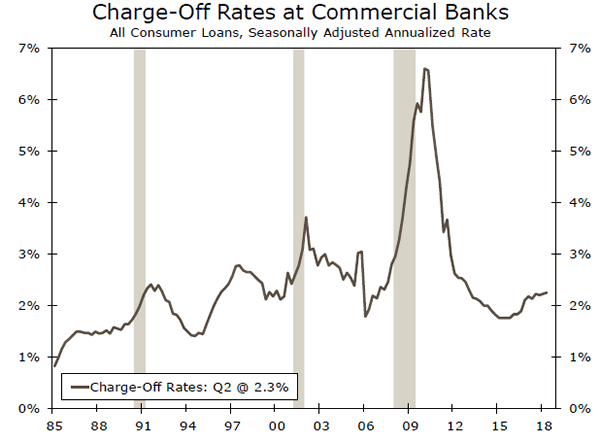
Revolving credit is mostly comprised of credit card loans, and slower growth in this credit type suggests that tightening financial conditions could be weighing on consumers as they are faced with higher rates on outstanding balances. Charge off rates at commercial banks were the highest since 2013 in Q2 (middle chart), and credit cards continued to have the highest delinquency rates outside of student loans.
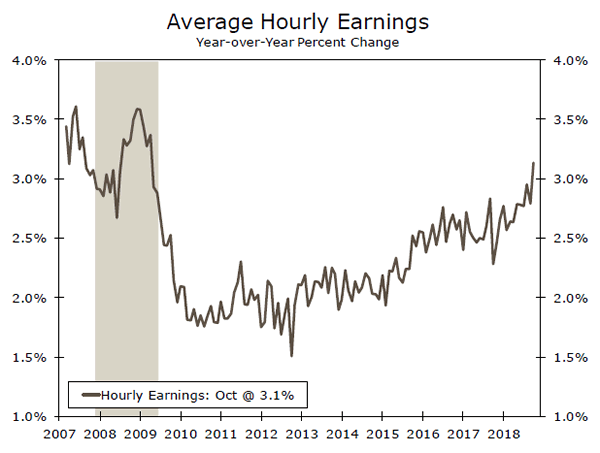
But does a slowdown in consumer credit growth give cause for concern in the broader economy? Although the monthly change in consumer credit has slowed from its record $30.2 billion gain registered in November 2017, other metrics for the consumer sector generally point to an optimistic outlook. Average hourly earnings growth surpassed 3% year-over-year for the first time this cycle in October (bottom chart), and consumer spending rose at a strong 4% annualized rate in Q3. It would appear that for now, a tight labor market and gradual pickup in wage growth likely mean that most consumers still have the propensity to spend, even as credit growth has slowed and interest rates continue their upward ascent.
Topic of the Week
What's Wrong with Housing?
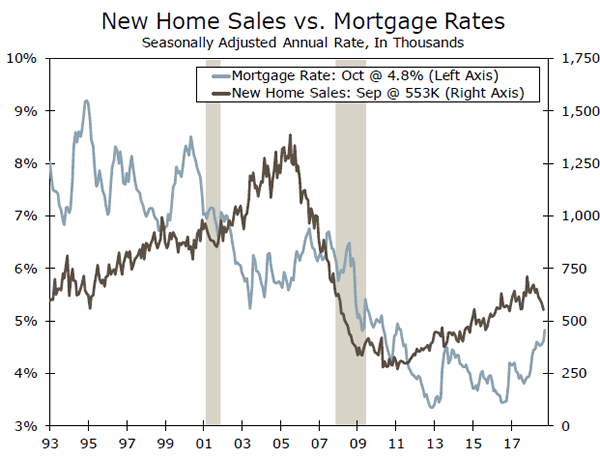
Sales of both new and existing homes have been weakening for the past six months and home price appreciation has finally broken from its earlier breakneck pace, even in many of the nation's hottest housing markets. The persistent slowdown in sales over the past six months was initially thought to be a supply problem. Inventories remain tight, but they leveled off midyear and have begun to tick up modestly. Still, we view the current environment as a soft sellers' market, as homes remain in short supply in the most desirable markets. Moreover, while buyers have gained some bargaining power, mortgage rates near a seven-year high render a meaningful breakout in housing unlikely, and are particularly hindering first-time home buying.
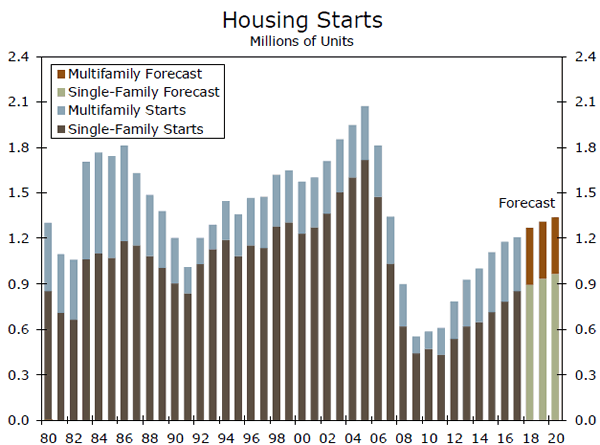
Looking beneath the numbers, the magnitude and speed at which home sales have weakened is surprising, following just a three-quarter of a percentage point rise in mortgage rates. We suspect the problem is a lack of affordable product in the markets where potential home buyers would like to live. For much of the recovery, job growth has been disproptionaley centered in the creative industry and in the submarkets close to the central business district of select high-flying metro areas. The resulting housing crunch has been exacerbated by regulatory burdens in the neighborhoods that need new housing supply the most. Unable to afford a down payment, many Millenials are turning instead to amenityrich apartments. The stagnating single-family market has provided a second wind for the apartment market, which we now expect to remain stronger for longer. We have further reduced our forecasts for home sales and new home construction following the recent string of weaker housing reports and downward revisions to previous data. We still see sales rising, with much centered in the South and West, which should restrain price appreciation.
The Weekly Bottom Line: Plenty of News, But Not Much New
U.S. Highlights
- Between the midterm elections and a Fed rate decision there was plenty of news this week. But after the dust settled there was very little new information.
- In the midterm elections, Democrats gained a majority in the House of Representatives, and Republicans tightened their grip on the Senate. A divided Congress through 2020 will temper parts of Trump's agenda, and could make some upcoming fiscal tests more challenging.
- As expected, the Federal Reserve left rates unchanged, with a largely unchanged statement. Recent economic data suggest the next hike is coming in December.
Canadian Highlights
- Housing dominated the economic calendar this week. Homebuilding continued to cool on a trend basis in October. A third quarter drop in residential permits suggests that further easing is in store.
- Against a backdrop of rising rates, Toronto home sales dropped in October. They appear to have fared better in Vancouver during the month, though activity in the GVA remains depressed amid severely strained affordability.
- Historical revisions to Canadian GDP growth released this week likely did little to alter thinking at the BoC.
U.S. - Plenty of News, But Not Much New
Between the midterm elections and a Fed rate decision there was plenty of news this week. But after the dust settled there was very little new information. As was widely expected, the Democrats gained a majority in the House of Representatives, and Republicans tightened their grip on the Senate. A divided Congress will temper Trump's agenda, but much depends on the Democrats' strategy for working with the GOP. Even less surprising was the Federal Reserve's decision to hold the funds rate steady, after hiking in September. Equity markets seemed pleased with these largely as expected results.
Congress is now gridlocked through 2020, which raises risks on a variety of fronts. A few tests loom on the near-term horizon. Currently 25% of discretionary spending for the 2019 fiscal year is under a temporary funding agreement until December 7th. The current Congress will likely kick the can into early 2019, which sets up a potential funding battle and the risk of a partial government shutdown in the New Year. Government shutdowns are a risk with a divided government, but typically these do not have a meaningful impact on economic activity (as they have not proved long lasting).
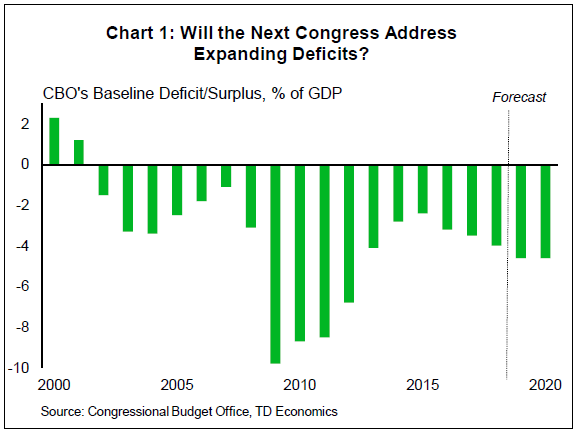
The second fiscal test is the debt ceiling, which is set to be re-instated in March 2019. It must be raised or suspended again to prevent a debt crisis or huge fiscal contraction. We expect Congress will come to an agreement to avert a crisis, but there could be some fireworks in the process. Finally, Congress must enact legislation to avoid automatic spending cuts of $100 billion in FY2020. Our base case is that this is avoided, but if not, it could trim 0.5 percentage points from GDP growth in that year. In the wake of tax cuts and spending increases the federal deficit has grown, and is expected to swell further (Chart 1). This could become a political issue that makes a budget compromise more difficult.
As President, Trump has the authority to push ahead with his trade agenda. He may even get some support from the Democratic House for a harder stance on China. As such, the increase in Chinese import tariffs to 25% from 10% on $200bn of goods on January 1st is more likely than not, presenting a downside risk to our forecast.
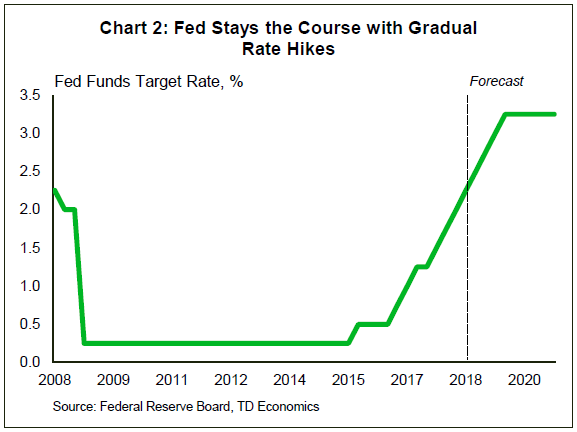
Finally, there was little new from the Fed. The statement's characterization of the economy was broadly unchanged. The slight updates that were made merely reflect the latest data, and are not major new developments. Most importantly, the Fed said it "expects that further gradual increases in the target range for the federal funds rate will be consistent with sustained expansion of economic activity..." and that "risks to the economic outlook appear roughly balanced". The recent economic data certainly point to a rate hike at the December meeting.
Most recently, October's Producer Price Index showed that inflationary pressures are alive well further up the supply chain. And while consumer price inflation hasn't heated up in recent months, price hikes are likely coming in many sectors as margins are increasingly squeezed.
Canada - Housing Takes Centre Stage
Housing dominated the economic calendar this week, with data on starts and building permits offering insights into supply-side trends. Glimpses into the demand-side of the market were also provided with the release of sales data for major markets. Also grabbing attention was the release of the 2017 provincial economic accounts. Although dated, this information is closely watched as it includes historical revisions to Canadian GDP.
In 2017, every province churned out positive economic growth, marking the first time this has happened since 2010. It wasn't all good news however, as Canadian growth was revised down slightly, on average, from 2013-2017. By province, revisions were most acute in New Brunswick, B.C., Ontario and Alberta. The downward adjustment was largely due to residential structures and machinery and equipment spending growth that was slower than originally thought, while import growth was modestly stronger. All told, given their small magnitude, the revisions are likely not enough to spark a material change to the Bank of Canada's view of the economy or their thinking on rates.
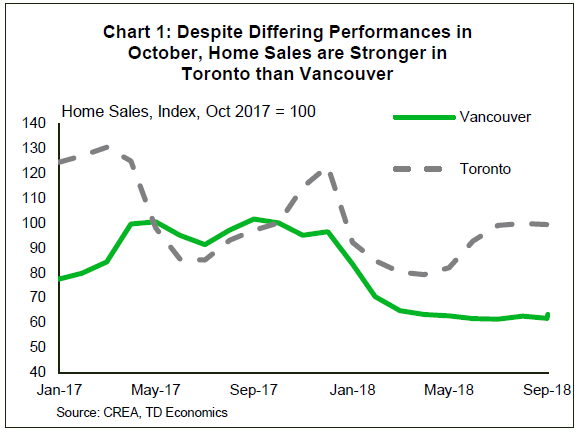
Turning the focus to housing, Monday brought the complete release of home sales and prices data for key markets in Canada (Chart 1). In the closely-watched GTA market, home sales are estimated to have fallen by 1% month-on-month in October, the second straight monthly drop. The market remained balanced, however, with the sales-to-listings ratio coming in at 52. Toronto's market has been balanced for over a year now, manifesting in slower price appreciation. Indeed, the Toronto Real Estate Board reported that average prices were up a tame 3.5% year-over-year in October. Looking ahead, we expect sales to grind higher in the GTA. However, back-to-back sales declines during September and October suggest that 1) the post B-20 sales bounce observed earlier may have run its course; and 2) strained affordability conditions, exacerbated by rising borrowing costs, will continue to restrain demand.
Things were a little better in Vancouver during October, with sales estimated to have risen moderately. However, activity remains depressed, as buyers continue to grapple with the worst affordability conditions in the country. However, some relief is in store on this front, with ample supply relative to demand likely to keep a lid on prices in the near-term.
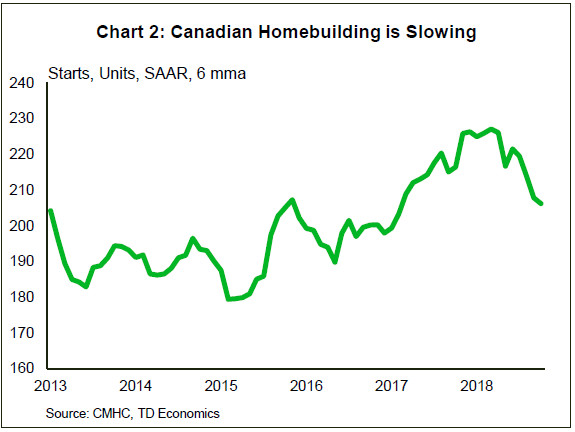
Honing in on the supply side, housing starts increased in October, getting residential investment off on the right foot to begin Q4. However, on a trend basis, homebuilding continued to cool (Chart 2), with past declines in demand feeding into starts. Looking forward, a Q3 decline in residential building permits portends a further easing in starts in the near-term. Peering even further ahead, rising interest rates should constrain homebuilding in coming years, switching the role of this component from growth enhancer to neutral contributor.
U.S.: Upcoming Key Economic Releases
U.S. Consumer Price Index - October
Release Date: November 14, 2018
Previous: 0.1% m/m; core 0.1% m/m
TD Forecast: 0.3% m/m; core 0.2% m/m
Consensus: 0.3% m/m, 2.5% y/y; core 0.2% m/m
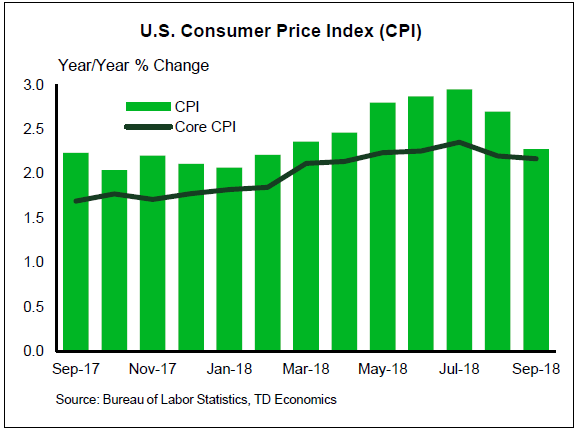
We expect headline CPI to pickup to 2.5% on the back of gasoline prices and base effects. We also expect core CPI to rebound to a 0.2% m/m rise (2.2% y/y) after printing at 0.1% for two consecutive months. Prior misses were driven primarily by sharp downturns in apparel and used vehicle prices which we expect to normalize. Much attention this month will be given to OER, which in the prior month posted a soft 0.2% rise, its weakest since December 2014. The print looks like a blip in our view given homeowner vacancy rates, and we expect both OER and rents to rebound in October, underpinning a 0.2% increase in the core index. Turning to core goods, we look for apparel to take back some of its previous weakness, though err on the side of caution as a decline can't be ruled out. Used vehicle prices are also coming off a 3% drop, and further declines, albeit much more modest, can't be excluded as well.
U.S. Retail Sales - October
Release Date: November 15, 2018
Previous: 0.1% m/m, ex auto -0.1%
TD Forecast: 0.7% m/m, ex auto 0.6%
Consensus: 0.6% m/m, ex auto 0.5%
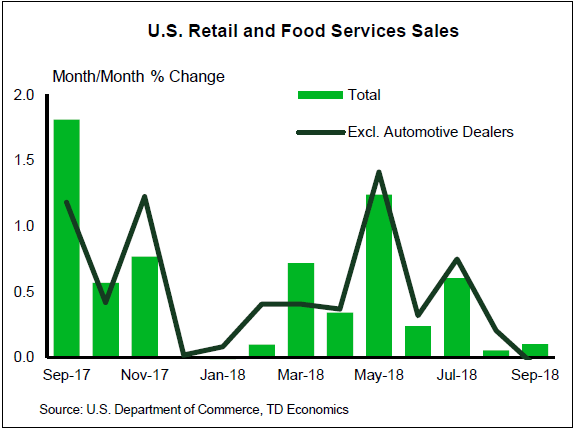
We expect retail sales to advance 0.7% in October, boosted by a rebound in food services and a potential hurricane-induced pickup in building materials spending. Auto and gasoline station sales should also lend positive contributions. We expect core sales to moderate from their previous 0.5% though remain solid at 0.4%. Overall the report should indicate a solid start to Q4 real PCE albeit at a more moderate pace near 3% than the blockbuster 4.0% rate in Q3.
Canada: Upcoming Key Economic Releases
Canadian Manufacturing Sales - September*
Release Date: November 16, 2018
Previous: -0.4% m/m
TD Forecast: 0.4% m/m
Consensus: N/A
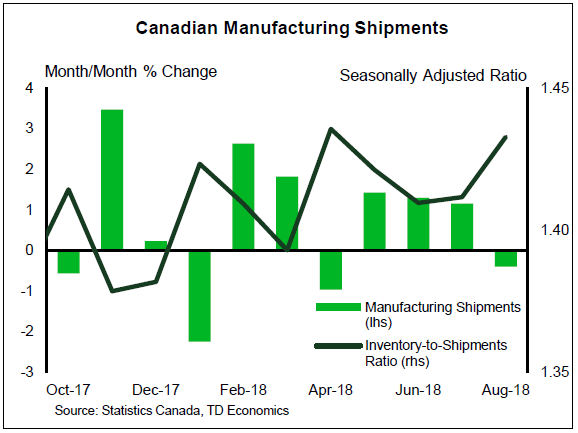
Manufacturing sales are poised for a rebound in September with headline sales forecast to rise by 0.4%. Motor vehicles should provide a source of strength although weaker aerospace sales could provide an offset within the transportation sector after a 14% increase in August. Elsewhere stronger petroleum exports indicate increased refinery output, while sustained strength in US manufacturing output and strong durable goods orders should also provide a tailwind. Tempering our expectations for a rebound is a second consecutive decline in export activity, while higher factory prices should see real manufacturing sales post a more modest advance.
Week ahead – UK Jobs and German GDP Matters The Most
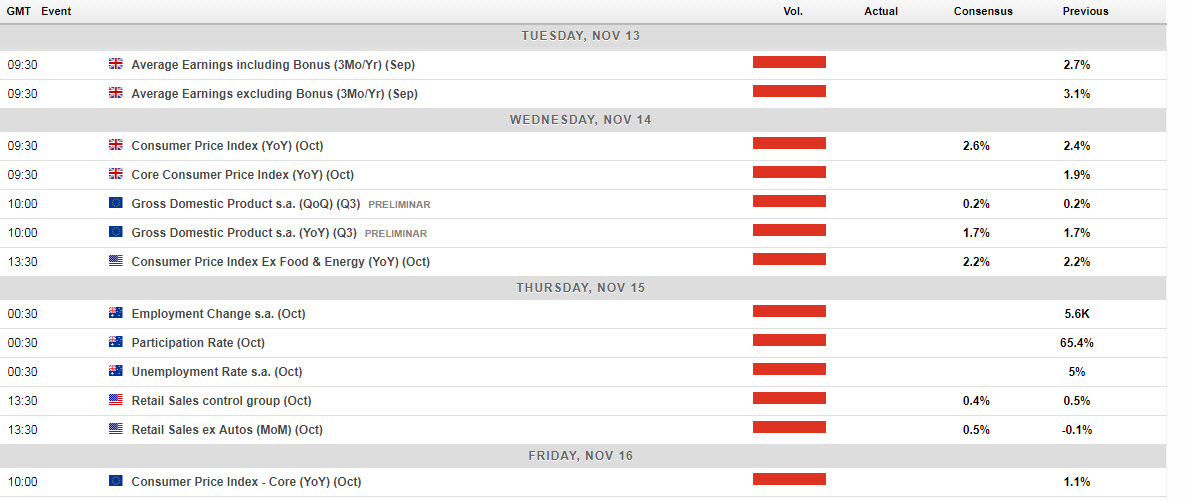
The Fed kept the powder dry during their last meeting and there was no change in their monetary policy. We also had the Chinese inflation data for October this week. It was below expectations (PPI was 3.3% y/y down from 3.6% y/y in September and CPI was 2.5% y/y unchanged). Moving on to the oil market, it has entered in a bear market territory. OPEC and oil producers outside OPEC will meet on Sunday to discuss the strategy for 2019. The divided government over in the US after the US midterm election will remain the key focus for the markets.
Week Ahead:
EURUSD
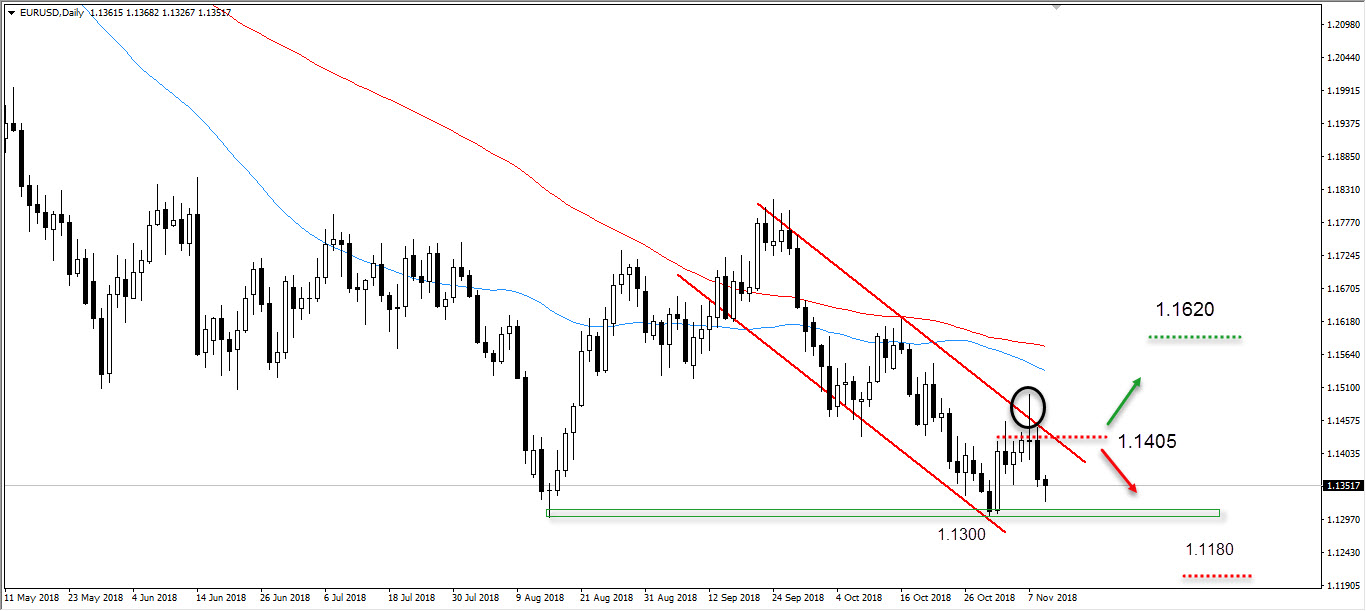
With a large reversal signal at the upper boundary of the descending channel, as well as an existing bearish setup, we maintain our negative bias. Support is at 1.1300 and more meaningful support is seen at the lower boundary of the channel at 1.1180/1.1150.
GBPUSD
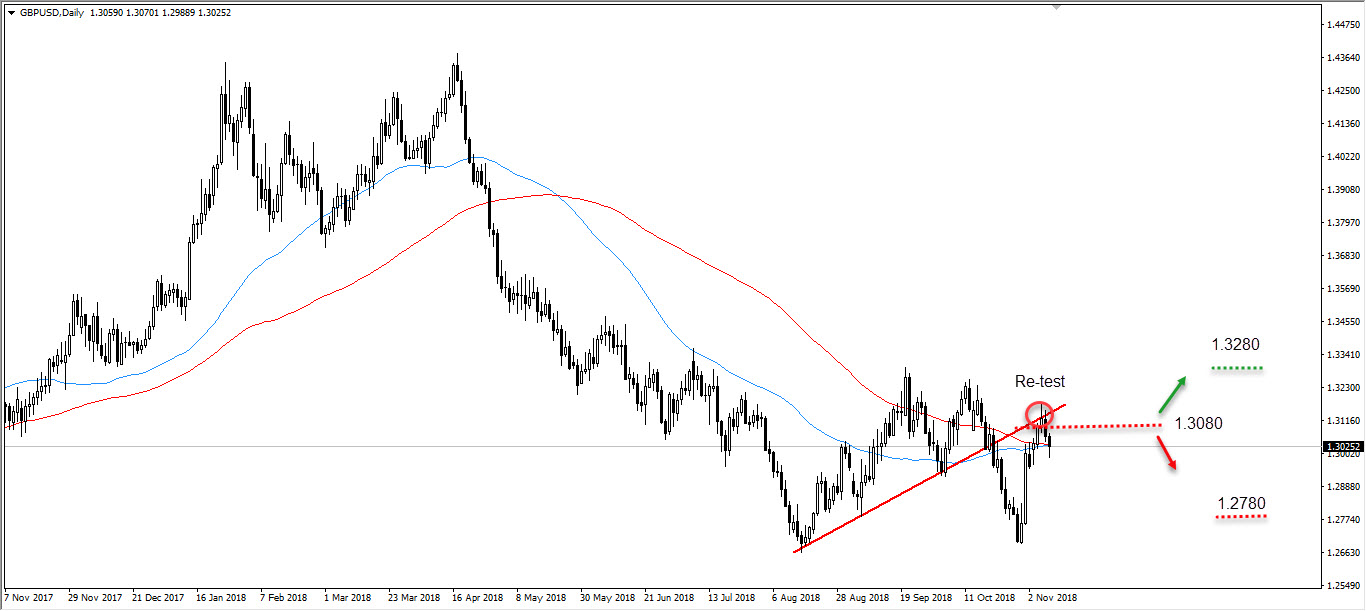
The pair’s early strength stalled at 1.3130/1.3150. This is because the pairs has re-tested this upward trend line and failed to stay above it. Our bias though stays bearish for now as long as the pair is trading below 1.3080. Support is initially seen at 1.2950, then 1.2880.
USDJPY
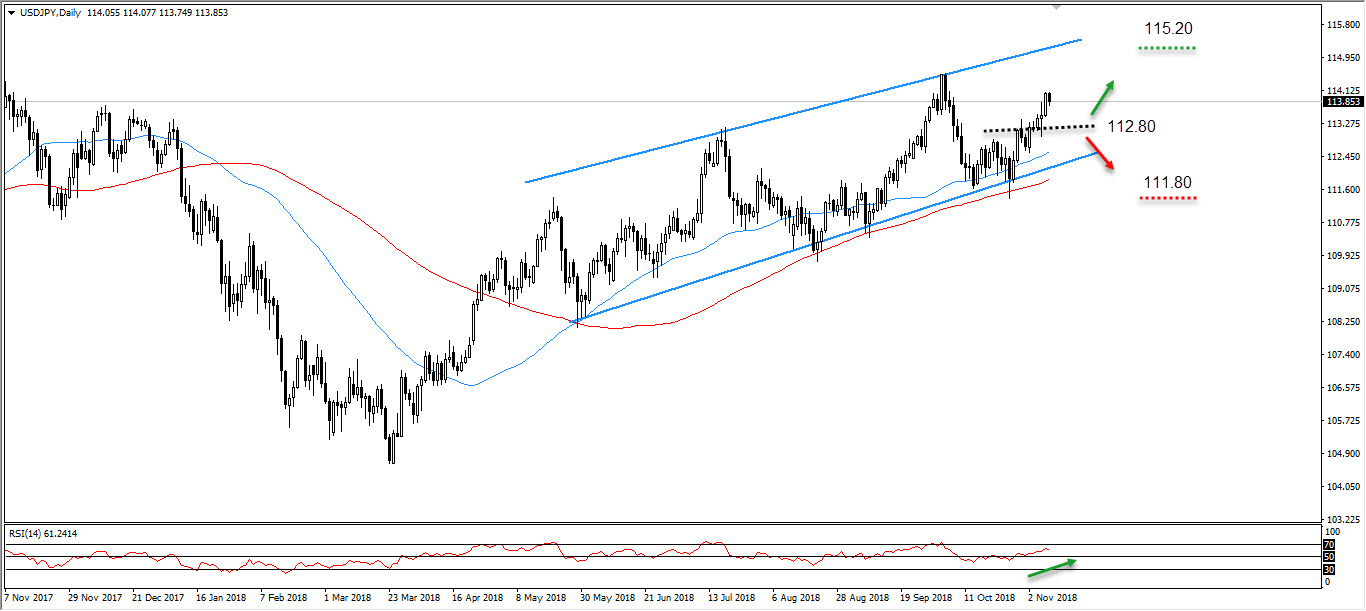
This week we saw the rally for the USD/JPY pair. We have broken the major barrier at 112.50/112.80 and this confirms the bullish sentiment. Now, the spotlight is on the upward channel and the upper line of this channel is mainly in focus which is at 115.80. Support is at 112.80/112.50.
XAUUSD
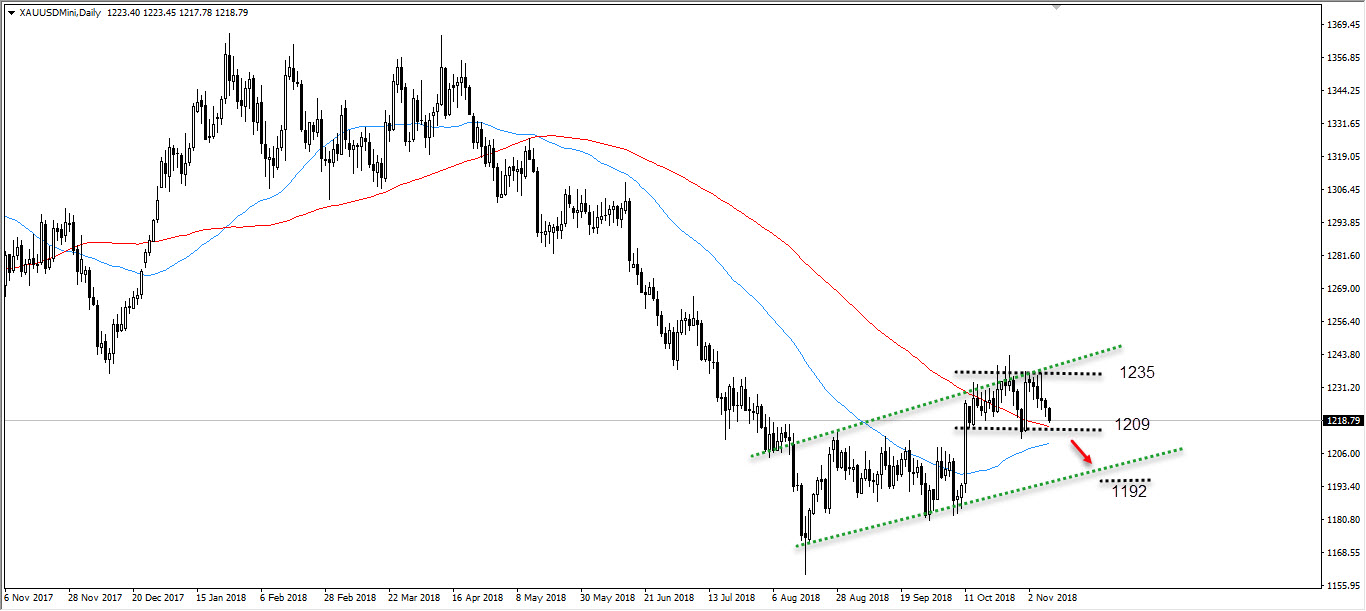
The weakness in the gold price was triggered by the key resistance level of 1238. Going forward, we expect more of consolidation for the precious metal and the consolidation range is from between 1209 and 1235. However, if the price drops below $1209, we would see bears picking up the steam. This could lead the price to 1195/1192. Resistance remains at 1228/1235.
WTI
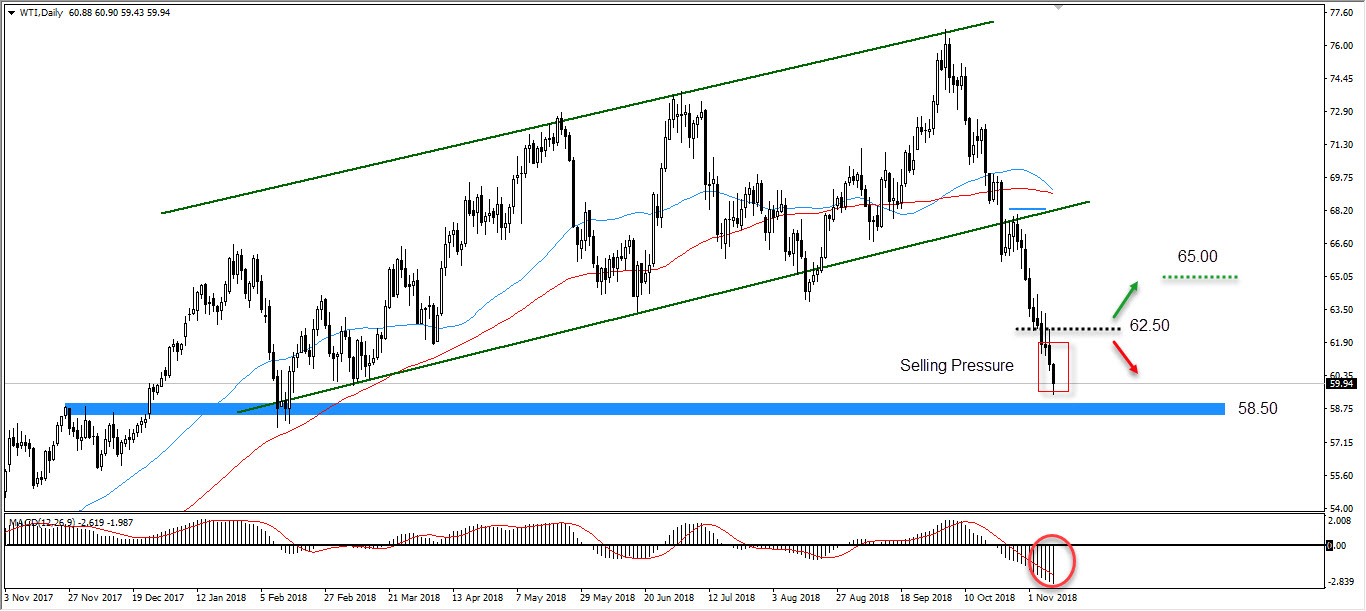
Oil is still under a strong selling pressure. However, the current selloff may ease off soon. Our bias is for a corrective move to prevail. The support is seen at 58.50, and the price of oil could recover from. Resistance is initially seen at 62.50.
Dow Jones
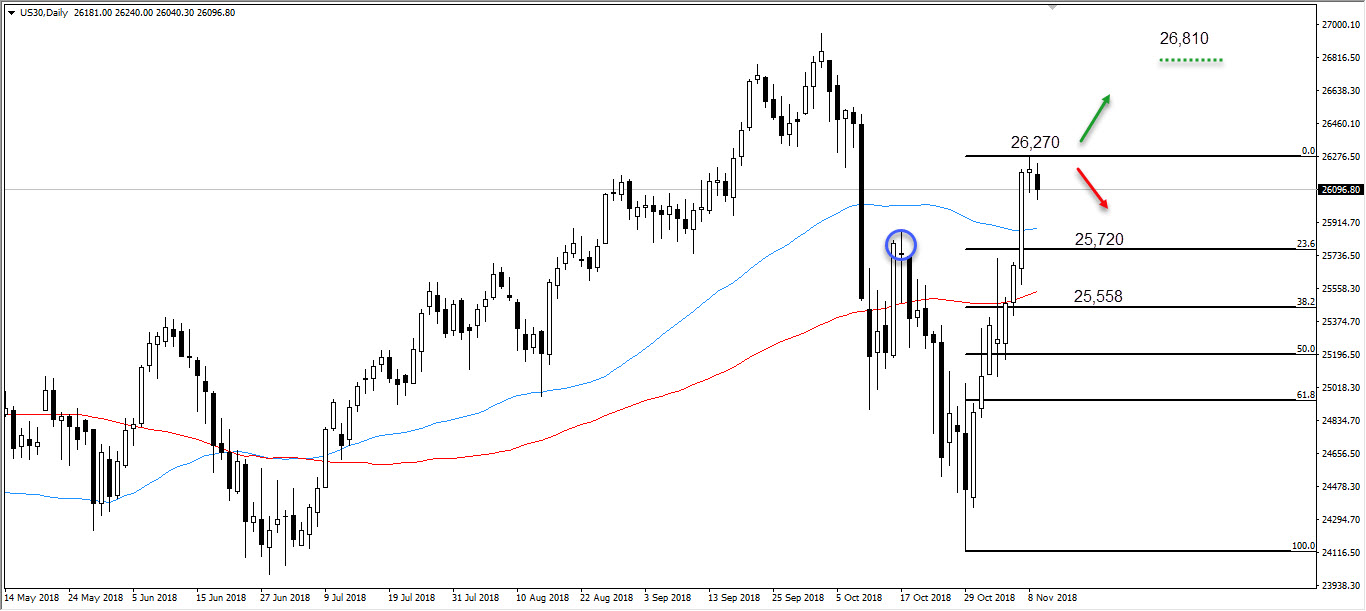
The week ended on a positive note, after the strong bounce from key support at 24,150/24,180. The next resistance level is at 26,810. The price is trading above the major moving averages 50 and 100 and this confirms the bullish bias.
US Dollar Flying High on Hawkish Fed Statement
The US dollar rose against most major pairs on Friday. Only the Japanese yen was able to gain against the mighty greenback. The FOMC statement eased concerns that the Fed would hint at a pause in its tightening of monetary policy. The lack of changes, and given that there was no press conference, and lacking other details overall boosted the US dollar ahead of the release of inflation and retail sales data. The uncertainty about the US-midterms has passed and the market remains confident in US growth despite political parties splitting house and senate.
US fundamentals have worked in favor of the dollar. European data will decide the fate of the euro with the release of German ZEW Economic Sentiment, German preliminary GDP and the European Union first estimate of quarterly GDP growth. ECB policy makers Mario Draghi and Jens Weidmann will speak in Frankfurt to close the week with investors eager for insights into the next steps of the central bank.
- US core inflation expected at 2.2 percent
- US retail sales to bounce back with 0.6 percent gain
- Italian budget due on Tuesday with little compromise anticipated
Dollar Back in Control Ahead of Inflation and Sales Data
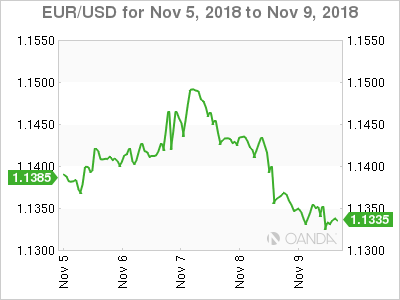
The EUR/USD lost 0.43 percent in the last five trading sessions. The single currency is trading at 1.1334. The euro rose near the 1.15 price level as the results of the midterms was released but as uncertainty cleared andThe FOMC rate statement was published the dollar rose. The gap in rates between the US and Europe will grow bigger as December has high probabilities of an interest rate lift by the Fed.
The slowdown of the Chinese economy is increasing worries about global growth and making the US dollar more attractive as a safe haven, putting more downward pressure on the euro.
Brexit Optimism Broken by Johnson Resignation
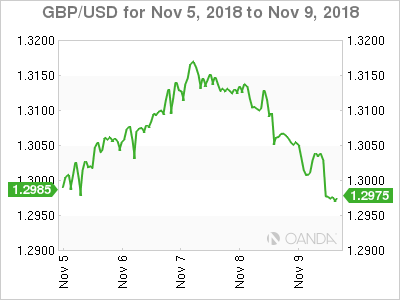
The GBP/USD gained 0.11 percent in the last five days. Sterling is trading at 1.2975 versus the USD. The currency pair was lower on Friday as new of the resignation of MP Jo Johnson on Friday. The UK Transport secretary, and brother to Boris, resigned in protest over Theresa May’s Brexit plan. In contrast to his brother, Mr Johnson was a remain campaigner and he has deemed the current deal a terrible mistake.
The Irish backstop has become a bigger headache as what the UK wants will not be acceptable by the EU, and what would be agreed to by the EU would not be easily sold to Northern Ireland.
Kiwi Higher on Employment Data Sensitive to China Slowdown
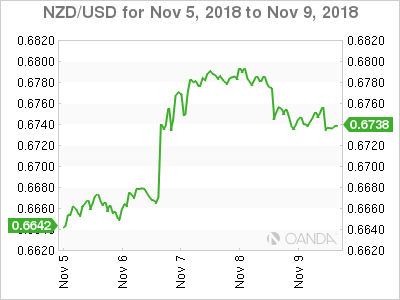
The NZD/USD gained 1.38 percent during the week. The currency pair is trading at 0.6736 after the Reserve Bank of New Zealand (RBNZ) held rates, but was seen as hawkish. Employment data supported the view of the central bank with the unemployment rate touching a low not seen since 2008. The size of the recovery took the market by surprise and boosted the kiwi against the US dollar.
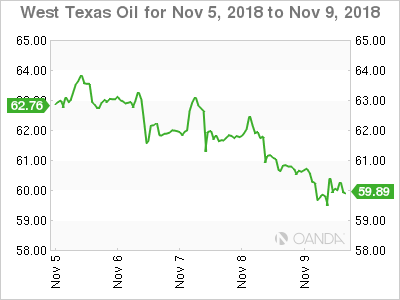
**Oil Stuck in Downward Spiral **
Energy prices fell this week, West Texas Intermediate dropped 4.67 percent and Brent 3.64 percent as fears that the market will have more oil in play than what it is justified by existing demand. The US sanctions against Iran triggered a rise in prices, with Saudi Arabia and Russia pledging higher production to cover the gap in supply. As sanctions got closer it was announced that Iran’s biggest clients would get waivers, reducing the need for more barrels, but it was already too late to correct production schedules and trades valued oil lower accordingly.
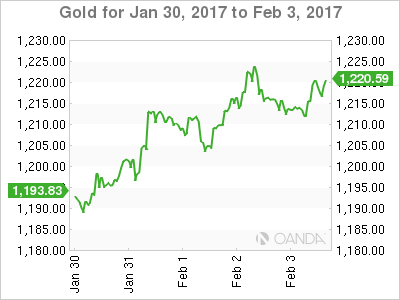
Gold Drops as Dollar Goes Big After Midterms
Gold fell 1.92 percent during the week after the Fed’s Federal Open Market Committee (FOMC) statement made clear the central bank will continue its pace of monetary policy tightening. A December rate hike. The CME FedWatch tool shows a 75.8 percent probability of a lift to the Fed funds rate at the FOMC meeting on December 19.
Market events to watch this week:
Monday, November 12
- 8:30pm AUD NAB Business Confidence
Tuesday, November 13
- 5:30am GBP Average Earnings Index 3m/y
- 5:30am GBP Unemployment Rate
- 6:00am EUR German ZEW Economic Sentiment
- 7:50pm JPY Prelim GDP q/q
- 8:30pm AUD Wage Price Index q/q
- 10:00pm CNY Fixed Asset Investment ytd/y
- 10:00pm CNY Industrial Production y/y
Wednesday, November 14
- 3:00am EUR German Prelim GDP q/q
- 5:30am GBP CPI y/y
- 5:30am GBP PPI Input m/m
- 5:30am GBP RPI y/y
- 6:00am EUR Flash GDP q/q
- 9:30am USD CPI m/m
- 9:30am USD Core CPI m/m
- 8:30pm AUD Employment Change
Thursday, November 15
- 5:30am GBP Retail Sales m/m
- 9:30am USD Core Retail Sales m/m
- 9:30am USD Retail Sales m/m
- 9:30am USD Empire State Manufacturing Index
- 9:30am USD Philly Fed Manufacturing Index
- 12:00pm USD Crude Oil Inventories
- 5:30pm NZD Business NZ Manufacturing Index
Friday, November 16
- Tentative GBP Inflation Report Hearings
- 9:30am CAD Foreign Securities Purchases
- 9:30am CAD Manufacturing Sales m/m
*All times EDT
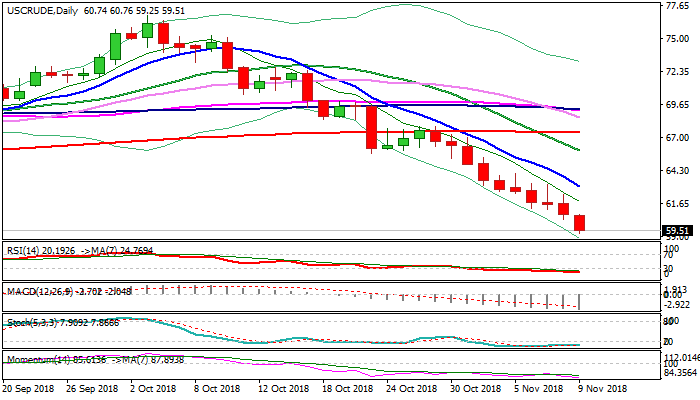
WTI Extends Free Fall Below Psychological $60 Support
WTI oil holds firmly in red for the tenth straight day on Friday and hit new nine-month low on break below psychological $60 support. Free fall is expected to extend as oil price is on track to end fifth consecutive week in red. Friday's extension through $60 handle cracked support at $59.46 (Fibo 50% of $42.04/$76.88), opening way towards supports at $58.29 (100WMA) and $58.19/06 (14/09 Feb through, also lows of 2018). Strong bearish setup of daily / weekly techs supports scenario, with oversold conditions being ignored for now. Rising global output offsets threats of shortage on sanctions on Iran and producing oversupply in the market, which keeps oil prices under strong pressure along with lower demand on weakening global growth adding to strong negative sentiment. Strong bears could be interrupted by corrective upticks which are expected to provide better selling opportunities.
Res: 60.00; 60.76; 61.30; 62.40
Sup: 59.25; 59.02; 58.29; 58.06
Sunset Market Commentary
Markets
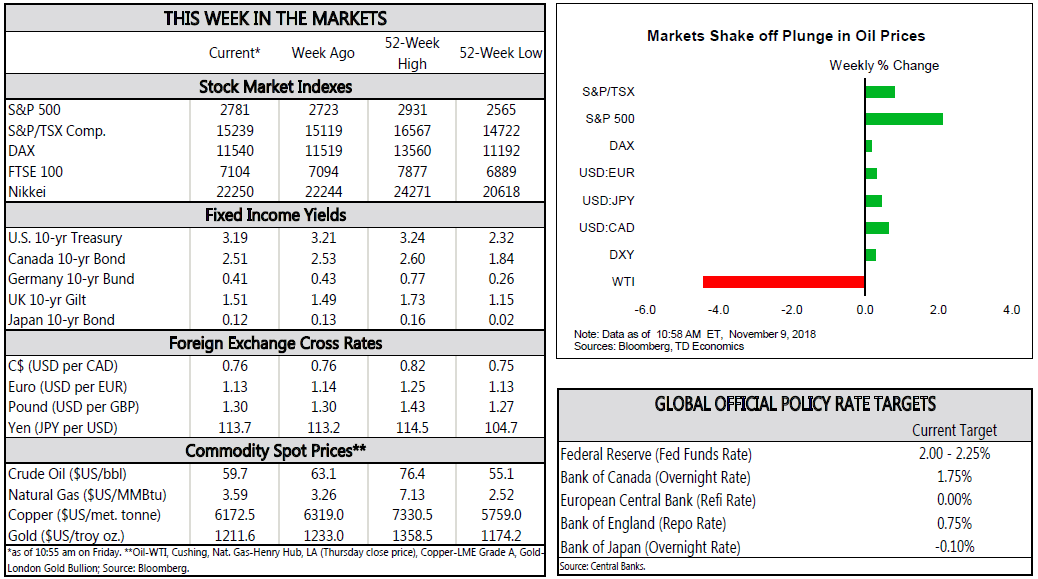
Global core bonds gain ground today as risk sentiment deteriorated. German Bunds and US Treasuries both edged higher. Equity indices around the world continue yesterday’s move south. Several factors may be at play. The US dollar has been strengthening since the US midterm results. The S&P index tried to break through the 62% retracement but failed, dragging other equities with it. Oil prices perish a global correction. Enough to put investors on edge, especially with the long weekend ahead (Veterans’ day). Exchange markets are open though. All factors in play pushed some safe haven flows into the bond market. US Treasuries paired some of its intraday gains as PPI’s proved very solid supporting the Fed’s gradual rate hike approach. There was no EMU data, but the Bund outperformed. The German yield curve declines with changes from -1.8 bps (2-yr) to -2.9 bps (10-yr). The US yield curve edges lower with the belly of the curve underperforming the wings. Changes range from -0.8 bps (30-yr) to -1.5 bps (5-yr).Peripheral yield spreads versus Germany widen with Greece (+8 bps) and Italy (+6 bps) underperforming. Italy’s credit spread heading back to 300 bps.
USD trading was at the mercy of global risk sentiment today. Yesterday’s Fed policy decision was very close to expectations. However, at least part of the market maybe hoped that the Fed would have given a bit more weight to the recent up-tick in market volatility. However, for now, there are few signs that the Fed will provide such a ’put option’ anytime soon. US/Fed interest rates will probably remain on an upward trajectory. US yields held close to recent highs, the dollar extended its post-election rebound and risk assets came under further pressure. The trade-weighted dollar is again nearing the recent top in the 97.00 area. In EUR/USD, the 1.13 range bottom also is again on the radar. However, with no really important eco data on the agenda, there was no strong enough driver for the dollar to challenge those technical levels. US PPI were higher than expected, but had little impact on the dollar. The market focus is on next week’s US CPI data. EUR/USD trades currently in the 1.1350 area. The risk-off sentiment prevented further USD/JPY gains. However, the pair also stays within reach of the 114 barrier.
There were plenty of UK eco data including the Q3 UK GDP today. UK growth reaccelerated to a solid 0.6% Q/Q and 1.5% Y/Y. However, details/other evidence suggest that growth will very likely slow in the last quarter of the year. For now, the report also doesn’t change the expected rate bath of the BoE. Sterling hardly reacted to the report. The focus remains on the ‘final’ stage in the Brexit negotiations. Over the previous days, sterling profited from an avalanche of political headlines that a Brexit deal might be reached in the very near future. This talk continued today, but it didn’t cause any further sterling gains anymore. EUR/GBP shifted into wait-and-see modus awaiting potential new developments in during the weekend or early next week. EUR/GBP trades in the low 0.87 area.
News Headlines
Norwegian headline inflation slowed in October from 3.4% YoY (0.6% MoM) to 3.1% (-0.2%). Core measures showed a similar slowdown from 1.9% YoY to 1.6% YoY. The data suggest the country’s central bank should be in no hurry to raise rates for the second time since 2011. The Norwegian koruna lost ground as markets buried any expectations for an early December hike.
Oil prices entered bear market territory, extending their 10 day losing streak while mounting losses up to more than 20%. After peaking mid-October, prices dropped after supply concerns eased following US sanction waivers to big Iranian oil importers while Saudi, Russian and US shale oil production more than compensate any Iranian outfall. Brent and WTI crude is trading respectively close to $70/barrel and $60/barrel.
US PPI came in stronger than expected in October, touching the highest in six year. Headline PPI increased 0.6% MoM. vs. a 0.2% MoM expected. Core PPI, excluding food and energy, increased 0.5% MoM vs. 0.2% anticipated.
Australia & New Zealand Weekly: AUD/USD to Move Below 70¢ in 2019 as Fed Continues to Hike
Week beginning 12 November 2018
- AUD/USD to move below 70¢ in 2019 as Fed continues to hike.
- RBA: Deputy Governor Debelle speaks.
- Australia: Westpac-MI Consumer Sentiment, wage price index, employment.
- NZ: retail card spending, house sales and prices.
- China: retail sales, industrial production, fixed asset investment.
- Europe: GDP 2nd estimate.
- US: Fed chair Powell speaks, CPI, retail sales, Veterans Day.
- Key economic & financial forecasts.
Information contained in this report current as at 9 November 2018.
AUD/USD to Move Below 70¢ in 2019 as Fed Continues to Hike
Over the last month the AUD has lifted from USD 0.705 to around USD 0.73. Markets had abruptly dumped the AUD over the previous two months. Momentum dictated that we should have extrapolated that trend and called AUD into the 60's last month. Certainly many commentators took that option.
Westpac resisted that temptation and noted in our October Outlook, "Westpac is retaining its target for AUD to end 2018 around USD 0.72 with further weakness in the AUD through the first three quarters of 2019, bottoming out at USD 0.70 around the middle of 2019."
However, despite the recent resurgence in AUD we are now revising down our estimate of its low point in this cycle. This is largely because we have reviewed our outlook for the US economy and US Federal Reserve policy.
We have extended our profile for interest rate increases by the Federal Reserve's FOMC by 25 basis points. We now expect the final hike in this cycle to be September 2019 rather than June. This will see the federal funds rate peak at 3.125%.
This profile is somewhat more hawkish than current market pricing which expects the federal funds rate to peak at around 2.9% by end 2019. While the FOMC's "dots" envisage a peak of 3.4%, this assumes a continuation of above-trend growth in 2020. We instead expect growth to decelerate to trend in late 2019.
In choosing this somewhat higher "pause point" we have studied "pauses" in the three previous tightening cycles (1995; 2000; 2006). Then the FOMC responded to a slowdown in employment growth and spending, particularly housing and durable consumer goods.
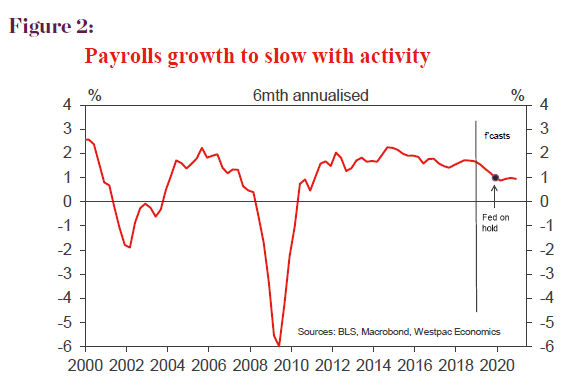
We are expecting a slowdown in employment growth through the second half of 2019 from around 1.6% at March 2019 (six month annualised) to around 1% by year's end. Furthermore we expect the contributions to growth from housing and durables spending to decline significantly in the second half.
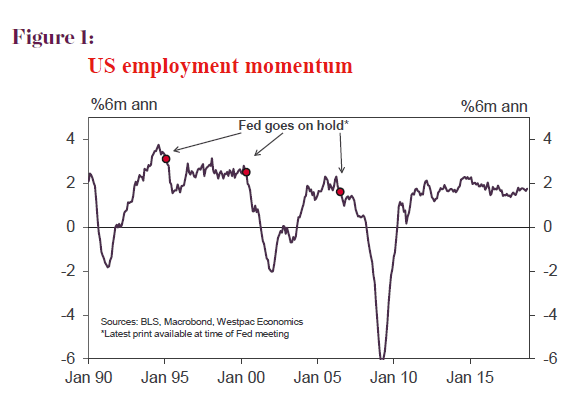
However our estimates indicate that with the unemployment rate settling around 3.5% in the second half of 2019 the FOMC will persevere a little longer with their gradual normalisation through 2019 before the slowdown evidence around employment; housing and durables becomes clear. Figure 1 highlights the importance of jobs growth to the timing of "pauses" while Figure 2 shows our forecasts for jobs growth and the expected timing of the pause in 2019, giving the FOMC ample time to observe the necessary slowdown.
At that key point in December 2019 when we see the FOMC pausing it will feel reasonably comfortable that it has reached a sustainable neutral setting. Inflation will be around the 2% target; growth will have slowed to near "potential" and the unemployment rate, while lower than the previously assessed "full employment" level, will not be driving excessive wage pressures.
In previous tightening cycles (see Figure 1) the labour market subsequently deteriorated sharply whereas in this cycle we anticipate that employment growth can "settle" around 1% - closely aligned with working age population growth. The FOMC will, in those circumstances, be able to hold the federal funds rate around that "neutral" level throughout 2020.
This slight change of profile for the federal funds rate has some implications for our bond and currency forecasts.
Our expected peak in the US 10 year bond rate of 3.5% has been lifted to 3.6% and been extended from June to September. The margin between the US and Australian 10 year bond rate increases from a peak of 60 basis points to 70 basis points through mid 2019.
Given this additional increase in US rates we have also extended and lifted our forecast for the USD with DXY now expected to peak near 100 by September.
For the Australian dollar, we now anticipate a further "leg down" to USD0.68 by September. The USD should then start to lose ground through the December quarter 2019 as markets detect the employment and spending slowdown and anticipate the December pause. In this way AUD would lift through the December quarter to USD0.70, lower than our previous forecast.
The week that was
The US mid-term elections were the focal point for markets this week. However, monetary policy also remained in view, with the RBA, RBNZ and FOMC all meeting.
Who won the US mid-term elections? Seemingly, the answer is everybody. As expected, the Democrats won the house; however, the Republicans increased their majority in the Senate. Equities rallied the day after, while the US dollar and term rates initially edged back before returning to their previous levels.
For the economy, the implications are minimal. In the shortterm, the result clears the way for a planned hike by the FOMC in December. On fiscal policy, infrastructure is set to replace tax and regulatory change as the potential expansionary catalyst. However, if seen at all, progress on this front looks a long way off, with President Trump and the Democrats holding disparate positions on the matter. Also worth noting is that this outcome does not stop President Trump from doubling down on his 'trade war' with China. The hope on that front is an upcoming meeting between President Trump and President Xi in late November.
From the FOMC at their November meeting, the message was simple. The US economy is strong and a continued gradual normalisation of the policy stance to neutral justified. While we continue to believe that US growth will slow back to trend in late-2019 as the consumer pulse follows the deceleration already underway for investment, the time taken by the FOMC to reassess their course at prior cycle peaks has led us to add a fourth hike to our federal funds profile. Whereas we previously saw 2.875% at June 2019 as the peak, now we forecast 3.125% at September 2019 to be the point at which the Committee pauses indefinitely. That would leave policy a little above neutral, seeing growth remain at trend and inflation at target, given the strong labour market.
Coming back to Australia, the RBA's November meeting statement offered no surprise in terms of themes, but did highlight greater optimism over growth, with the GDP forecasts revised up to 3.50% out to June 2019. In the RBA's view, growth will slow to 3.0% by end 2020, but that is still above trend. The unemployment rate forecast was revised from 5.00% to 4.75% and underlying inflation for 2019 was revised up to 2.25%.
Our own view on unemployment is not dissimilar. However, we are less positive on the pass-through to wages and hence spending. Also front of mind for us is the more firmly entrenched downtrend in house prices, most evident in Sydney and Melbourne. To us, the expected consequence of this trend is declining dwelling investment and a subdued consumer. It is chiefly for these reasons that we see GDP growth slowing to 2.70% in 2019, materially below the RBA's forecast. If accurate, this is clearly an outturn that would warrant the RBA remaining on hold through 2019 and 2020.
In NZ, the statement from the RBNZ after their November meeting also carried a few hawkish tweaks. Most notably they moved away from a near-term rate cut by removing the previous reference to the next move in the cash rate potentially being "up or down". Further signalling that the next move in rates will be up, the RBNZ's medium-term inflation outlook now settles a little above the 2.0%yr target range mid-point as 'full employment' is achieved and exceeded. However, even though the RBNZ is projecting an overshoot for these targets in the medium-term, current slow progress for underlying inflation and an absence of untoward wage pressures despite the unemployment rate being historically low warrant stable policy until mid-2020, as risks remain balanced.
Chart of the week: Australia housing finance
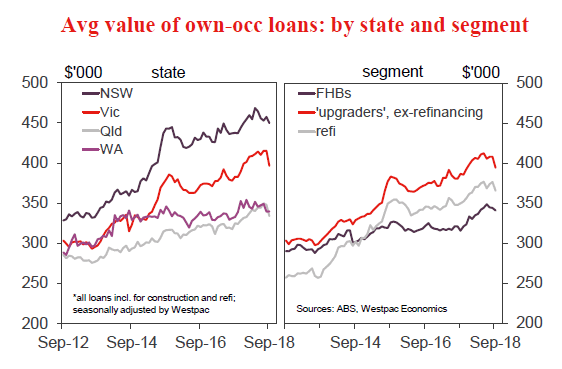
Australian housing finance approvals continued to soften in September. The headline number of owner occupier loans declined 1% in line with the consensus forecast. Ex refinancing, the decline was a milder 0.5%mth.
The value of loans was considerably weaker. In particular the value of owner occupier loans dropped 4.2%mth to be down 8% in the space of two months. With the number of approvals showing much milder declines, the implied average loan size has declined notably, by 3.6% since May, or $14.6k. Note that this captures composition shifts such as reduced activity in higher-priced markets such as Sydney and Melbourne, although the detail shows declining average loans sizes across all states suggesting tighter lending conditions reducing borrowing capacity has been the main driver.
New Zealand: week ahead & data wrap
What target?
The past week has been huge for New Zealand economists and financial markets. It started with the September quarter Household Labour Force Survey, which registered a ten-year low in the unemployment rate of 3.9%. That was a lot lower than we were expecting, given that jobseeker benefit numbers are on the rise.
We are wary of the inherent noise in the HLFS survey. On this occasion the drop in unemployment was heavily concentrated among very young people, which may be a sign that sampling error was a factor. One-quarter moves of this size are often followed by at least a partial reversal in the next quarter, and that's what we expect on this occasion.
That said, a broad sweep of all relevant data does suggest that the labour market is more positive than we gave it credit for. The HLFS probably overstates the case, but the fact remains that unemployment is trending down despite the economic slowdown of 2017 and early-2018. Evidently, low business confidence has not stopped firms from hiring.
Given this evidence of improving employment conditions, the lack of wage growth looks all the more mysterious. The September Labour Cost Index rose by 0.5%, with annual growth slowing a little to 1.9%. The drop in the annual growth rate is not surprising, as the aged care workers' pay equity settlement had boosted the numbers previously. Private sector wage growth has arguably started to pick up on a quarterly basis, and other measures of wage growth are a little stronger. But it's been a very incremental lift in wage growth so far.
Our view is that wage growth will gradually strengthen as the labour market continues to tighten. Wage growth is also going to be boosted by the rising minimum wage, pay settlements for nurses and teachers, and moves towards more collective wage bargaining. But this acceleration in wage growth will be too slow to generate much inflation, particularly considering other forces will be acting to keep inflation contained, such as extending free tertiary education beyond one year and competition in the retail sector.
The Reserve Bank's November Monetary Policy Statement came hot on the heels of the super-strong labour market report, and followed similar massive upside surprises on GDP and inflation. We were expecting a slightly hawkish shift, and that's exactly what we got. The Reserve Bank removed the phrase that the next move in the OCR could be "up or down", issued evenly balanced alternative scenarios (rather than skewing them to the downside), and lifted its inflation forecast.
At the same time however, the RBNZ remained adamant that the OCR is not going to rise any time soon. They retained the phrase that the OCR is expected to remain "at this level through 2019 and into 2020", and the OCR forecast was unchanged from August.
Given the sheer scale of the data surprises over the past three months, this really was a tiny shift in position. This underscores just how much less hawkish the Reserve Bank has become since the change to a dual mandate and a new Governor. We suspect that this week's events will become a theme. Over the coming year, we expect the economy to strengthen and inflation to rise. Yet we remain very comfortable forecasting no OCR hike until mid-2020.
The most extraordinary aspect of this week's Monetary Policy Statement related to the Reserve Bank's medium-term forecasts. The Reserve Bank is actually forecasting that inflation will rise above the 2% mid-point of their inflation target band, on a sustained basis, over the medium term. At the same time, they predict that employment will rise above its maximum sustainable level. In other words, the Reserve Bank is saying that it is going to overshoot its targets. Yet it is not planning to adjust the OCR to avert that miss.
Usually, the Reserve Bank forecasts that it is going to hit its inflation target over a horizon of, say, three years. After all, if inflation was in danger of heading higher three years in the future, the Reserve Bank would still have time to lift the OCR and avert the rise in inflation. On this occasion, rather than forecasting a rise in the OCR it is simply saying that it is not going to hit its inflation target, although admittedly the margin is small.
The situation has become more complex now that the RBNZ must target both employment and inflation. One could imagine the RBNZ forecasting one variable above target and one below, in a sort of balancing act. But that is not the case here – the RBNZ is saying it expects both employment and inflation to be above target.
Perhaps the RBNZ is more wary after many years of below-target inflation, and is prepared to take a small risk on the other side. Or perhaps it is interpreting differently the requirement to keep inflation "near the 2% mid-point" of its target range, and regards 2.2% as close enough. Whatever the explanation, this is a small but significant departure from the approach that the previous Governor would have taken.
Financial markets have taken the recent strong data and slight shift in tone from the RBNZ as licence to mark swap rates and the NZD much higher. That may prove to be a mistake. Our prediction is that the Reserve Bank will remain very dovish even if the data remains strong. If we are right, two-year swap rates above 2.2% are not tenable.
Data Previews
Aus Q3 Wage Price Index - %qtr
- Nov 14, Last: 0.6%, WBC f/c: 0.6%
- Mkt f/c: 0.6%, Range: 0.4% to 0.7%
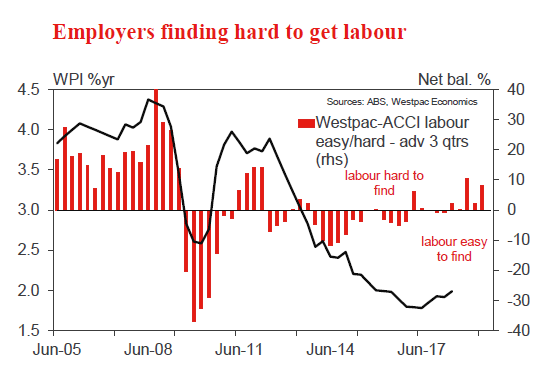
There has been some removal of excess slack in the labour market, as measured by falling unemployment and modest declines in broader measures of labour market utilisation. In the last year there was also the larger than usual boost from the annual lift in the minimum wage. And yet we are still waiting for a meaningful pickup in wage inflation.
Total hourly wages ex bonuses increased 0.6% in Q2, in line with market and Westpac expectations; lifting the annual rate to 2.1%yr from 2.0%yr (was 2.1%yr). Private sector wages grew 0.5% lifting the annual rate slightly to 2.1%yr. Public sector wages grew 0.6% holding the annual rate at 2.4%yr - a pace maintained since 2017 Q1.
This year the lift in the minimum wage was 3.5%yr, a small increase on the 3.3%yr granted in 2017. However, in 2017 the minimum wage increase did not have a meaningful impact on aggregate wages. Will we see a larger impact in 2018?
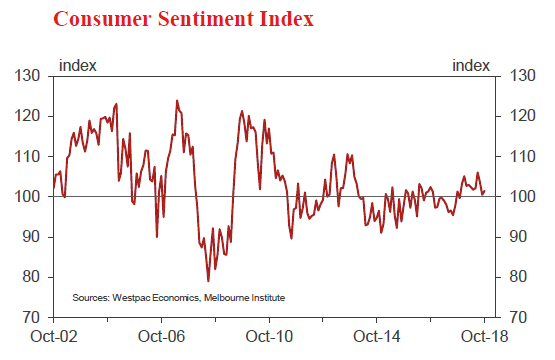
Aus Nov Westpac-MI Consumer Sentiment
- Nov 14 Last: 101.5
The Westpac Melbourne Institute Index of Consumer Sentiment rose 1% to 101.5 in October from 100.5 in September. The small gain follows a 5.2% decline over the previous two months as an earlier boost from tax cuts announced in the May budget faded and negatives around the political backdrop; mortgage rate increases; declining house prices and rising petrol prices weighed on confidence. The October gain suggests some of the drag from these negatives has eased while positives around economic growth and the labour market have provided some support.
The November survey is in the field from November 5-10. The backdrop has again been a little more settled although global trade tensions, declining house prices in Sydney and Melbourne and sluggish income growth remain clear headwinds.
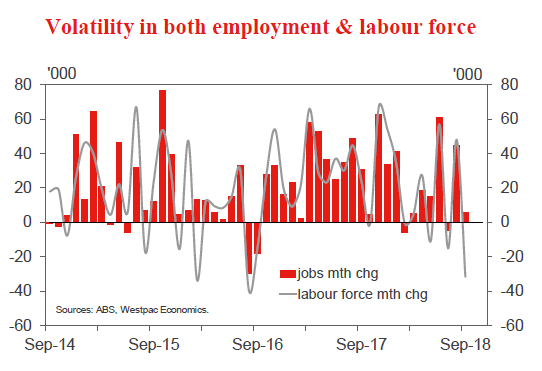
Aus Oct Labour Force Survey - Employment '000
- Nov 15, Last: 5.6k, WBC f/c: 20k
- Mkt f/c: 20k, Range: 10k to 30k
The Sep Labour Force Survey was full of surprises. The first was that employment came in less than expected rising just 5.6k in the month (the bottom of the range of expectations) with a more positive 20.3k gain in full-time employment vs. a –14.7k decline in part-time employment.
At the same time there was a drop in participation to 65.4% from 65.6% (both male and female participation fell) resulting in a –31.6k decline in the labour force. Our holistic view of the survey is that some of the monthly volatility is associated with the rolling of the groups in the survey sample. In original terms, the ABS notes that the incoming rotation group had a lower employment to population ratio (61.9%) than the entire sample (62.1%).
Given this, we are looking for a slightly above trend bounce in employment, up 20k with an associated rise in the labour force.
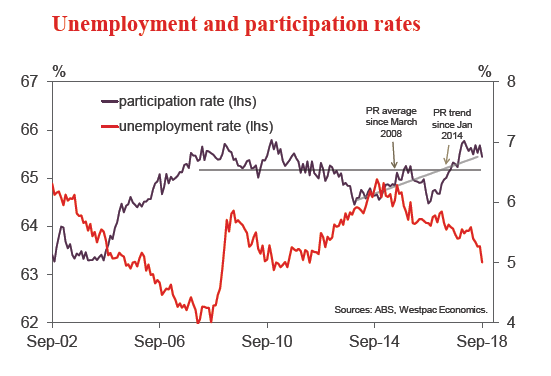
Aus Oct Labour Force Survey - Unemployment %
- Nov 15, Last: 5.0%, WBC f/c: 5.1%
- Mkt f/c: 5.1%, Range: 4.9% to 5.2%
The other big surprise in the Oct Labour Force was the fall in unemployment to 5.0% which has historically been argued to be the level for the natural rate of unemployment.
As the fall was associated with a fall in participation, some may be tempted to argue that were it not for the fall in participation then the unemployment rate would have been higher. We don't give countenance to such a statement as we believe you should take a holistic view of the labour market and not just look at one factor (say employment) and ignoring others (unemployment, participation, and hours worked).
With our forecast 20k rise in employment and a lift in participation to 65.5% this will see the unemployment rate lift to 5.1%.
.
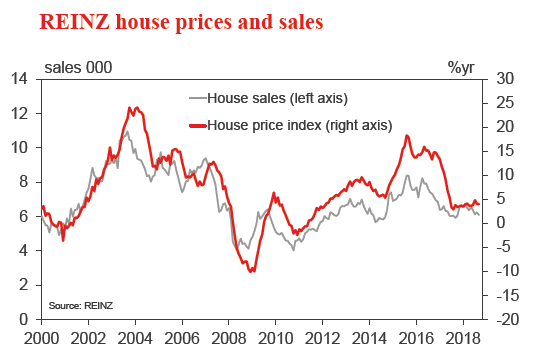
NZ Oct house sales and prices
- Nov 10 (tbc), Sales last: -2.5%, Prices last: +5.4%yr
House price inflation has slowly strengthened in recent months, although there is stark regional variation. Auckland and Canterbury prices are flat to falling, others are rising rapidly.
Going forward the market will be influenced by the recentlyintroduced foreign buyer ban and a recent sharp drop in mortgage rates. We expect the balance to be positive, but less so in Auckland.
We have already seen stronger listings and strong sales from one agency, the October REINZ data may show a modest pickup in sales.
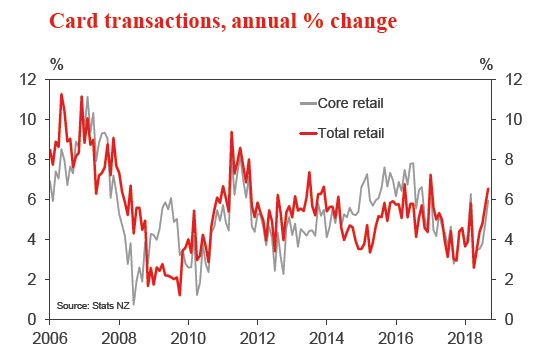
NZ Oct retail card spending
- Nov 12, Last: +1.1%, WBC f/c: +0.5%
Retail spending levels rose by a solid 1.1% in September, following a similar sized gain in August. Those gains were underpinned by increased spending on consumables (e.g. groceries), as well as firm spending on durables. Spending levels have been boosted by the Government's Families Package, which has added to the disposable incomes of many households.
We expect more modest spending growth in October and are forecasting a 0.5% gain in the month. While the lift in disposable incomes has added to the level of spending, higher fuel prices are limiting increases in discretionary expenditure in core categories.
US Oct CPI and retail sales
- Nov 14, CPI, last 0.1%, WBC 0.3%
- Nov 15, retail sales, last 0.1%, WBC 0.7%
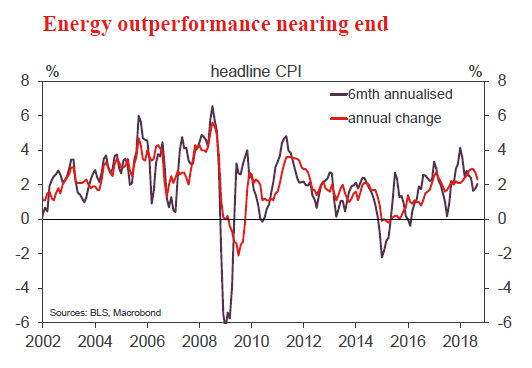
CPI inflation has held above the FOMC's 2.0%yr target for much of 2018, the headline measure averaging 2.6%yr over the 7 months to Sep. Highlighting the significance of energy to this result, the core measure (excludes food and energy) has averaged 2.2%yr over the same period.
October looks set to continue this trend, respective 0.3% and 0.2% monthly gains to see annual inflation at 2.5%yr for headline and 2.2%yr for core.
On retail sales, monthly volatility has been considerable, both with respect to initial outcomes and revisions. Looking through this however, the trend remains robust. After a weak September, we are due a bounce come October. Furthermore, the risks are skewed upward, given the need to replace auto purchases following Hurricane season.