Sample Category Title
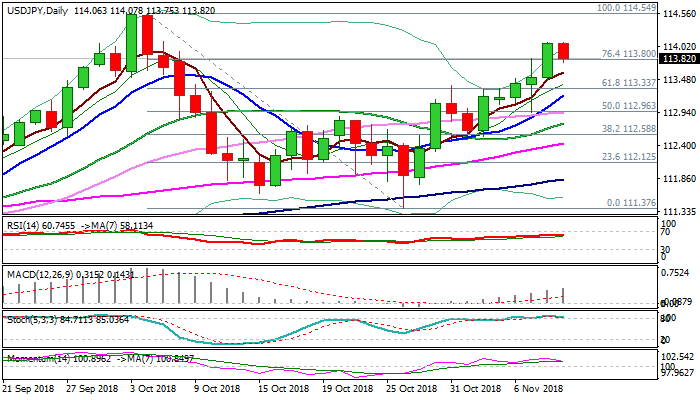
USDJPY Outlook: Bulls May Hold In Extended Consolidation Before Final Push Towards Key Barriers At 114.54/73
The pair moved lower on Thursday as traders took some profit from uninterrupted rally in past five days which accelerated on Thursday, resulting in daily gain of 0.5%. Signals that Fed remains on track for another rate hike in December keeps the dollar supported, as further interest rate divergence between the US and other major economies increases pressure on dollar's major counterparts.
Thursday's break and close above pivotal Fibo barrier at 113.80 (76.4% of 114.54/111.37 bear-leg) was bullish signal which opened way towards key barrier at 114.54 (04 Oct high). Bulls are likely to consolidate before final push higher.
Broken Fibo 76.4% barrier at 113.80 holds for now, with bullish signal expected on weekly close above, however, deeper pullback towards 113.33/22 (broken Fibo 61.8% / rising 10SMA) cannot be ruled out as slow stochastic is overbought on daily chart and momentum studies are weaker. Only close below 10SMA would put bulls on hold for deeper correction.
Res: 114.08, 114.54, 114.73, 115.50
Sup: 113.75, 113.59, 113.33, 113.22
The Fed Is Not For Turning, Yet
Markets in the red as Fed holds off on policy change
It would appear we’re going to end an otherwise positive week on a negative note, with equity markets around the globe in the red following the Fed decision on Thursday.
The Fed is not for turning, not yet at least. It was always a bit of a long shot that the central bank would choose a meeting that did not produce new economic projections or be followed by a press conference to change course, even a little, unless things had got especially bad. The recovery in the markets last week will have provided enough comfort to convince them it was not necessary and a decision can be made in December.
That’s not stopped traders from being disappointed though, with some hoping the central bank would soften their hawkish views and bring some calm to the markets. I don’t think this is going to trigger another sell-off like the one that followed Jerome Powell’s comments last month but then again, I don’t think anyone thought they would either.
UK growth stalls in September
This morning’s UK data did little to shift traders attention away from the infinitely more important matter of Brexit, partly because in the grand scheme of things it’s borderline irrelevant and partly because the numbers were broadly in line with expectations.
An early summer economic boost from the double whammy of great weather – by our standards – and World Cup fever was unfortunately, but predictably, unsustainable. Still, flat growth in September was still enough to secure the strongest quarterly growth since the end of 2016, at 0.6%.
Brexit deal brings weekend risk for GBP
Business investment was a drag on growth in the quarter though, dropping 1.2% on a quarterly basis – the most since 2015 – and 1.9% on an annual basis, the most since the end of 2016. While the link to Brexit in all of the above data is clear for all to see, the positive from this is that this could provide a tailwind for the economy if a good Brexit deal is secured.
News on this could come at any time, with both sides apparently desperate to find an agreement in time for a special EU summit later this month, which would conveniently free up the holiday period. I remain optimistic that a technical fudge will be found but obviously this takes time which makes it difficult to predict when. This naturally creates additional risk for the pound, particularly over the weekend and also if a deal does somehow collapse.
Elliott Wave Analysis: Bulls Taking Over USDMXN
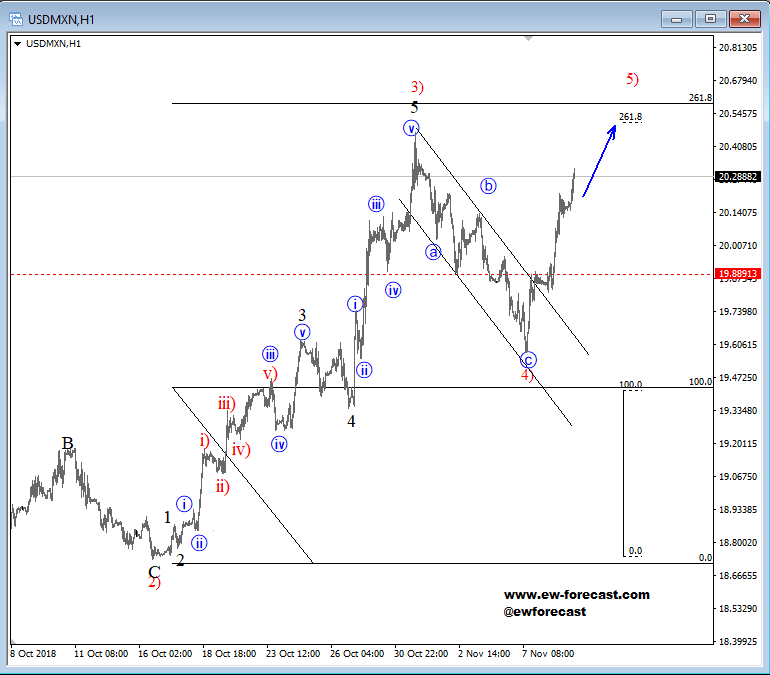
USDMXN made a nice and clear breach above the upper corrective channel line, connected from October highs which is a suggestion of a completed wave 4) correction and that more gains in view. A rally in five waves is now expected for wave 5), which can take price towards the 20.60 region in upcoming sessions. That said, because we are tracking wave 5), final wave of a bigger impulse, we need to be aware of top that may follow near the 20.60, region and with it a bearish reversal.
USDMXN, 1h
AUD/USD Bullish Continuation After A Pullback
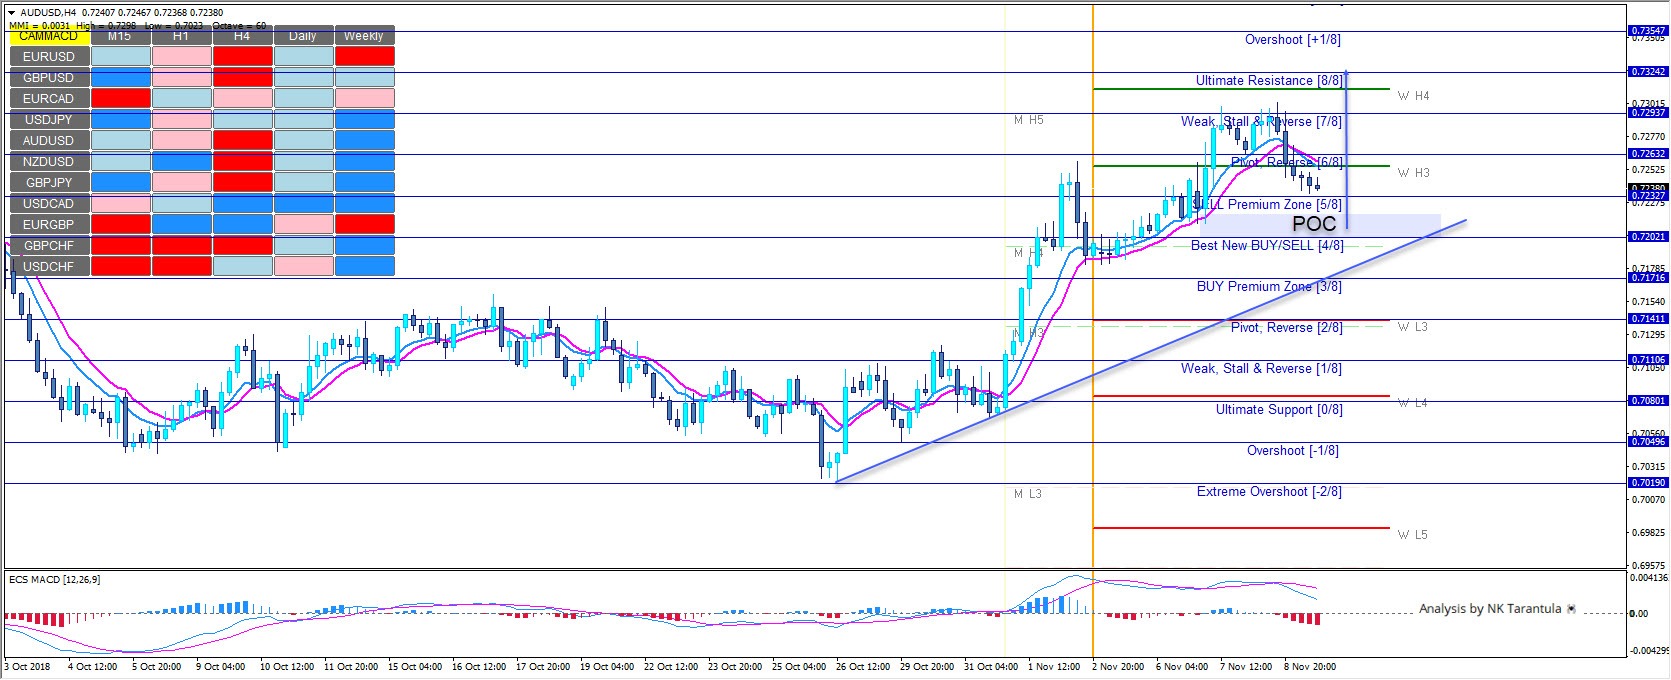
The AUD/USD should make a bullish continuation move after a pullback. The POC zone stands in-between 0.7200-30 and traders should watch for potential bounce.
If the price retraces to 0.7230-00 zone we should watch for a potential reversal signals that would spark a new rally. If that happens targets are 0.7290 and 0.7335. However a loss of 0.7170, might instill a bearish move towards 0.7140 another confluence zone. However based on the latest bullish zigzag rejections from the POC zone look more likely.
Italy Tria to keep the main pillars of budget, EU Dombrovskis said assumptions overly optimistic
Italy Economy Minister Giovanni Tria said today that the coalition government is "busy drafting the answer to the European Commission with regards to the most contentious points of the budget." Italy is requested to present a new or revised draft budget plan to the Commission by November 13. Despite the the requests, Tria told the parliament today that they will confirm the budget plan's "Main pillar". Tria reiterated the commitment to cap 2019 budget deficit at 2.4% of GDP. But based on the Commission's projection released yesterday, Italy's budget deficit would hit 2.9%.
European Commission Vice President Valdis Dombrovskis blasted Italy's projections were based on "overly optimistic assumptions." He added, "Basically the assumption is that if they ... increase public spending, it will stimulate the economy and thus will help to reduce budget deficit. We see that this is actually not materializing."
The Analytical Overview Of The Main Currency Pairs
The EUR/USD currency pair
Technical indicators of the currency pair:
Prev Open: 1.14256
Open: 1.13629
% chg. over the last day: -0.51
Day's range: 1.13318 – 1.13469
52 wk range: 1.1299 – 1.2557
Yesterday, the bearish sentiment was observed on the EUR/USD currency pair. The Fed, as the experts expected, kept the range of the key interest rate at the same level of 2.00-2.25%. The regulator noted a stable growth of the economy and a strong labor market. The Central Bank plans to adhere to a gradual increase in interest rates. At the moment, the local support and resistance levels are 1.13250 and 1.13550, respectively. Positions should be opened from these marks. The trading instrument has the potential for further decline.
The news feed on 09.11.2018:
Producer price index in the US at 15:30 (GMT+2:00).
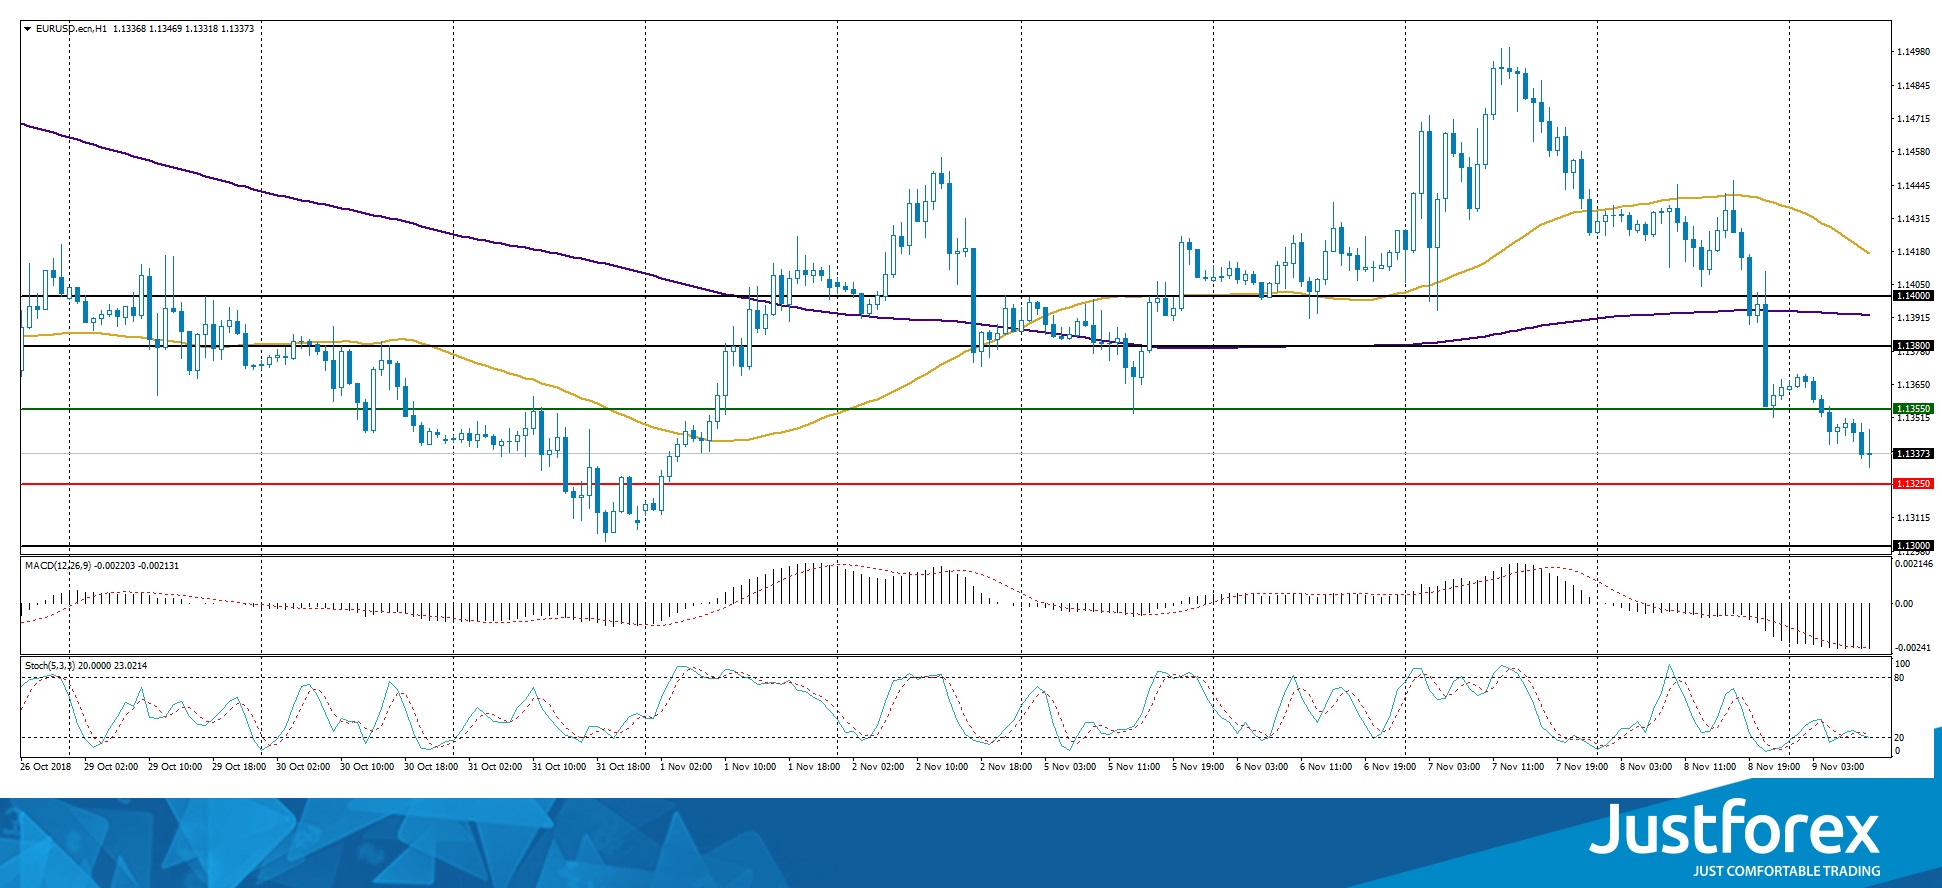
Indicators point to the power of sellers: the price is being traded below 50 MA and 200 MA.
The MACD histogram is in the negative zone and below the signal line, which gives a strong signal to sell EUR/USD.
The Stochastic Oscillator is located near the oversold zone, the %K line is crossing the %D line. There are no signals at the moment.
Trading recommendations
Support levels: 1.13250, 1.13000
Resistance levels: 1.13550, 1.13800, 1.14000
If the price fixes below the support level of 1.13250, a further fall in the EUR/USD quotes is expected. The movement is tending to 1.13000-1.12750.
Alternative option. If the price fixes above the 1.13550 mark, it is necessary to look for entry points to the market to open long positions. The movement is tending to 1.13800-1.14000.
The GBP/USD currency pair
Technical indicators of the currency pair:
Prev Open: 1.31227
Open: 1.30607
% chg. over the last day: -0.46
Day's range: 1.30045 – 1.30209
52 wk range: 1.2662 – 1.4378
The GBP/USD currency pair has been declining. During yesterday's and today's trading, the drop in quotes exceeded 120 points. At the moment, the key support and resistance levels are 1.29800 and 1.30400, respectively. We recommend following the current information regarding Brexit. Positions should be opened from the key levels.
The news feed on 09.11.2018:
Data on the UK GDP at 11:30 (GMT+2:00);
The volume of production in the UK manufacturing industry at 11:30 (GMT+2:00).
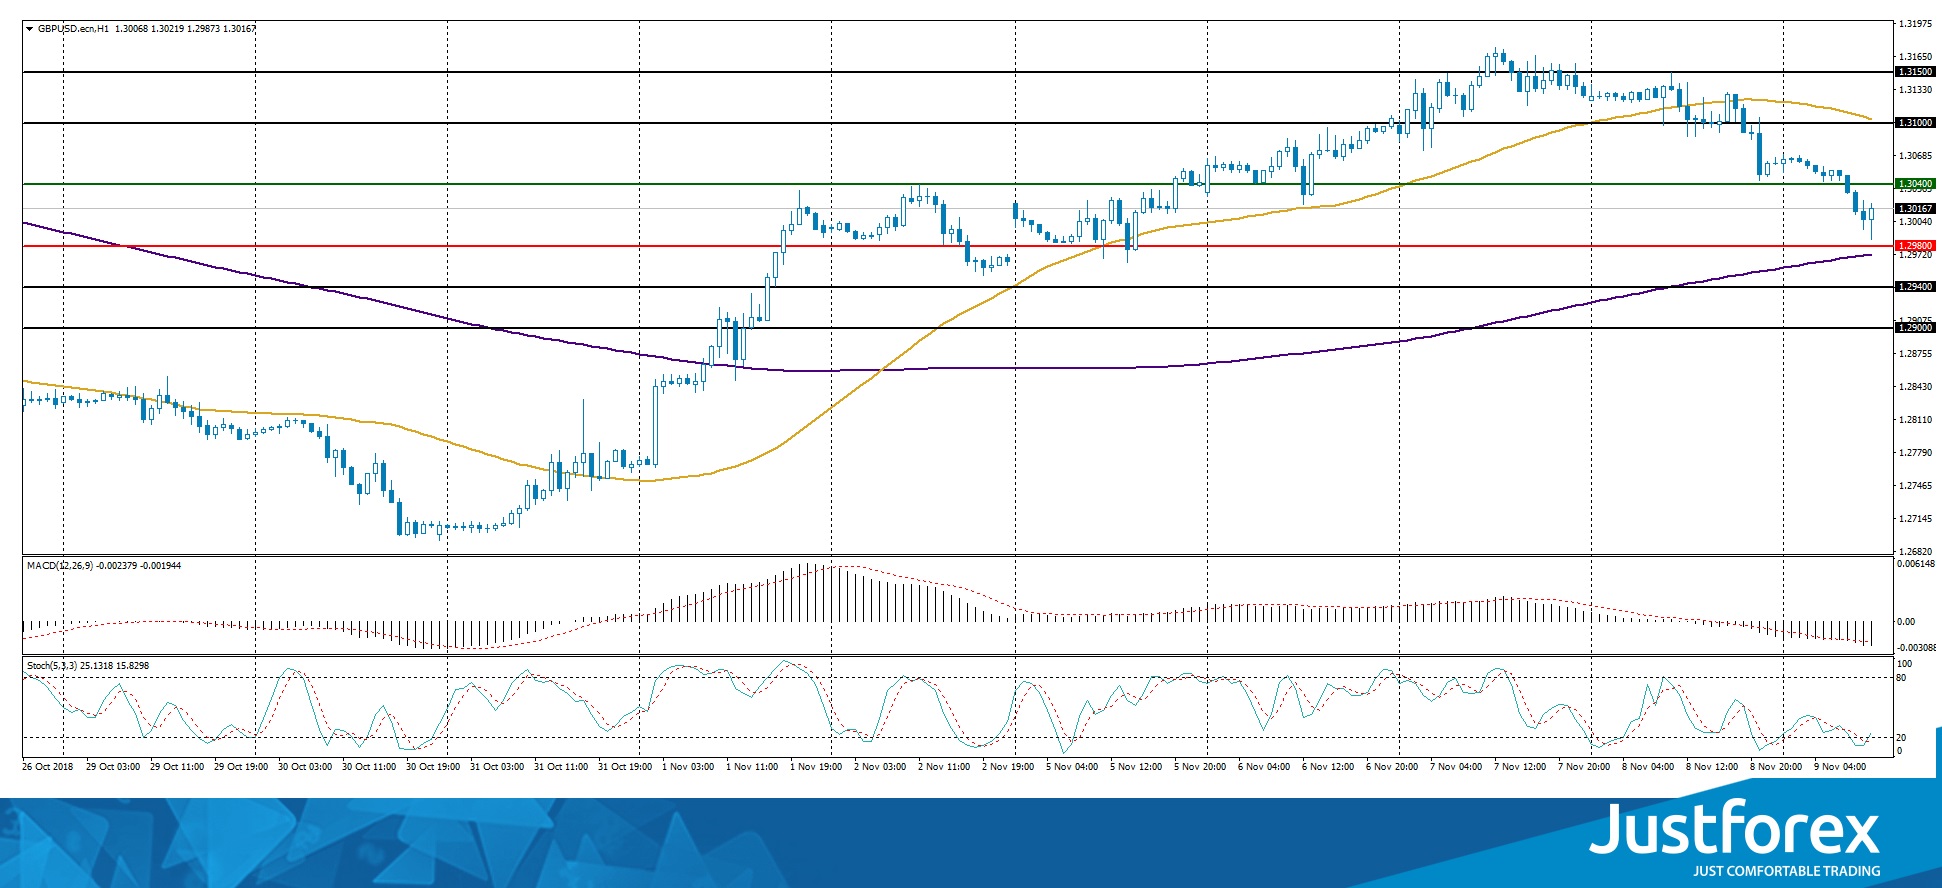
Indicators do not send accurate signals: the price is being traded between 50 MA and 200 MA.
The MACD histogram is in the negative zone, below the signal line, which gives a strong signal to sell GBP/USD.
Stochastic Oscillator is in the oversold zone, the %K line is below the %D line, which gives a weak signal to sell GBP/USD.
Trading recommendations
Support levels: 1.29800, 1.29400, 1.29000
Resistance levels: 1.30400, 1.31000, 1.31500
If the price fixes below the support level of 1.29800, a further drop in the GBP/USD quotes is expected. The movement is tending to 1.29400-1.29000.
An alternative may be the GBP/USD currency pair growth to the level of 1.30500-1.30750.
The USD/CAD currency pair
Technical indicators of the currency pair:
Prev Open: 1.31130
Open: 1.31552
% chg. over the last day: +0.24
Day's range: 1.31932 – 1.31945
52 wk range: 1.2248 – 1.3387
Aggressive purchases are observed on the USD/CAD currency pair. During yesterday's and today's trading, quotes have risen by more than 100 points. At the moment, local support and resistance levels are 1.31700 and 1.32000, respectively. Positions should be opened from these marks. We recommend paying attention to the dynamics of oil prices. Trading instrument has the potential for further growth.
The news feed on the economy of Canada is quite calm.
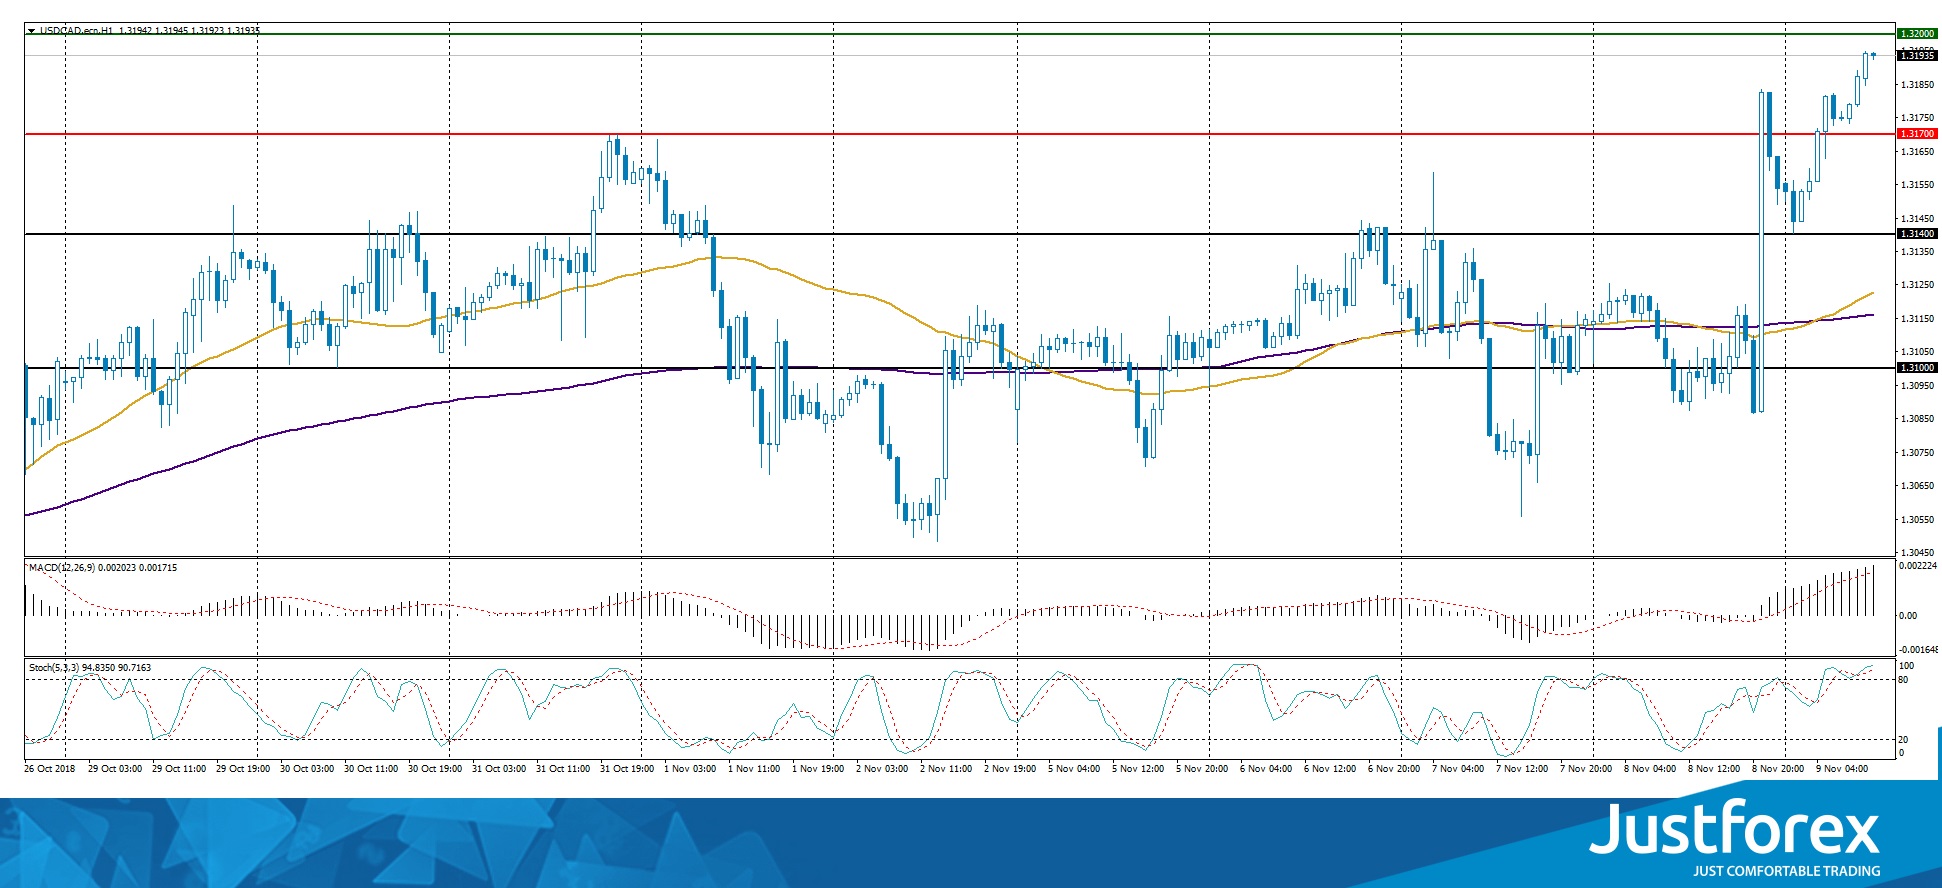
Indicators point to the power of buyers: the price has fixed above 50 MA and 200 MA.
The MACD histogram is in the positive zone and above the signal line, which indicates the bullish sentiment.
The Stochastic Oscillator is located near the overbought zone, the %K line is above the %D line, which gives a weak signal to buy USD/CAD.
Trading recommendations
Support levels: 1.31700, 1.31400, 1.31000
Resistance levels: 1.32000, 1.32300
If the price fixes above the round level of 1.32000, we recommend considering purchases of USD/CAD. The movement is tending to 1.32300-1.32500.
An alternative may be a decrease in the USD/CAD currency pair to 1.31400-1.31200.
The USD/JPY currency pair
Technical indicators of the currency pair:
Prev Open: 113.400
Open: 114.057
% chg. over the last day: +0.38
Day's range: 113.779 – 113.809
52 wk range: 104.56 – 114.74
Yesterday, the bullish sentiment was observed on the USD/JPY currency pair. At the moment, the technical pattern is ambiguous. Local support and resistance levels are 113.700 and 114.000, respectively. Positions should be opened from these marks. In the near future, technical correction is not excluded. We recommend paying attention to the economic reports from the United States.
Today, the publication of important news from Japan is not expected.
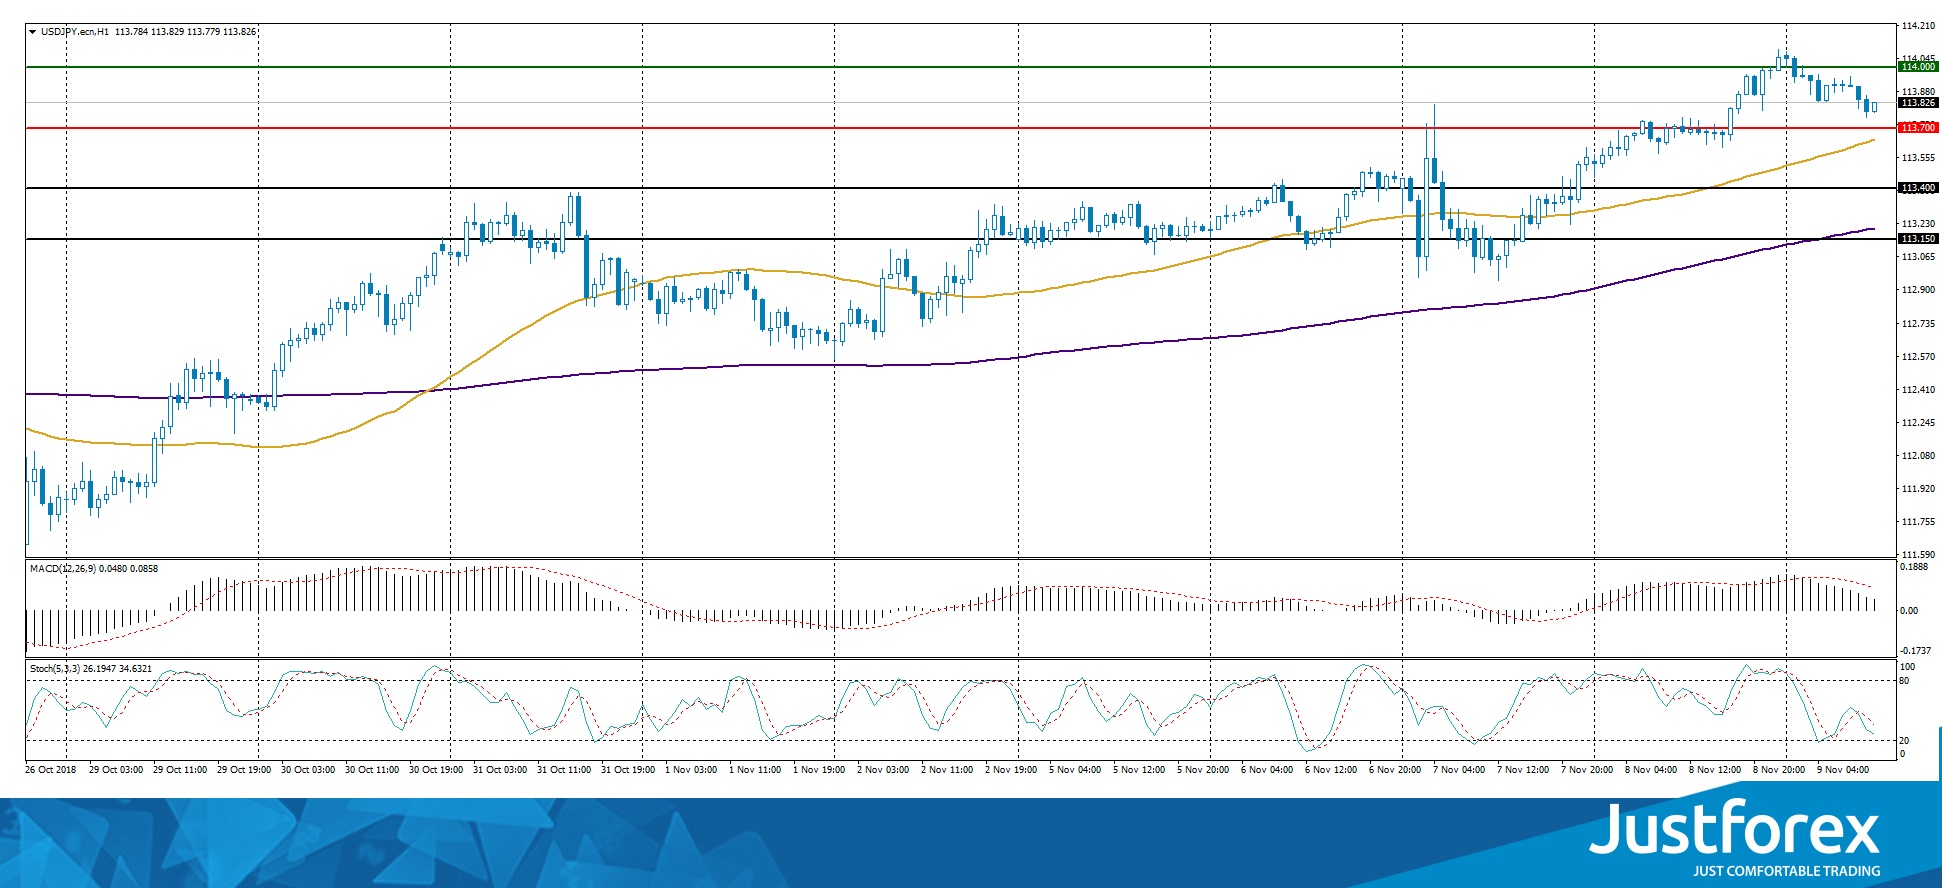
Indicators point to the power of buyers: the price is being traded above 50 MA and 200 MA.
The MACD histogram is in the positive zone, but below the signal line, which gives a weak signal to buy USD/JPY.
Stochastic Oscillator is in the neutral zone, the %K line is below the %D line, which indicates the bearish sentiment.
Trading recommendations
Support levels: 113.700, 113.400, 113.150
Resistance levels: 114.000, 114.350
If the price fixes below the support of 113.700, correction of the USD/JPY quotes is expected. The movement is tending to 113.400-113.150.
An alternative may be the USD/JPY currency pair growth to 114.350-114.500.
UK Hammond: Q3 GDP proof of the economy’s underlying strength
UK Chancellor of Exchequer Philip Hammond hails today's GDP release with his tweet.
"Our economy grew 0.6% between July and September – proof of its underlying strength. That’s 8 straight years of economic growth, 3.3 million more people in jobs and wages growing at their fastest pace in almost a decade."
https://twitter.com/PhilipHammondUK/status/1060843347273809920
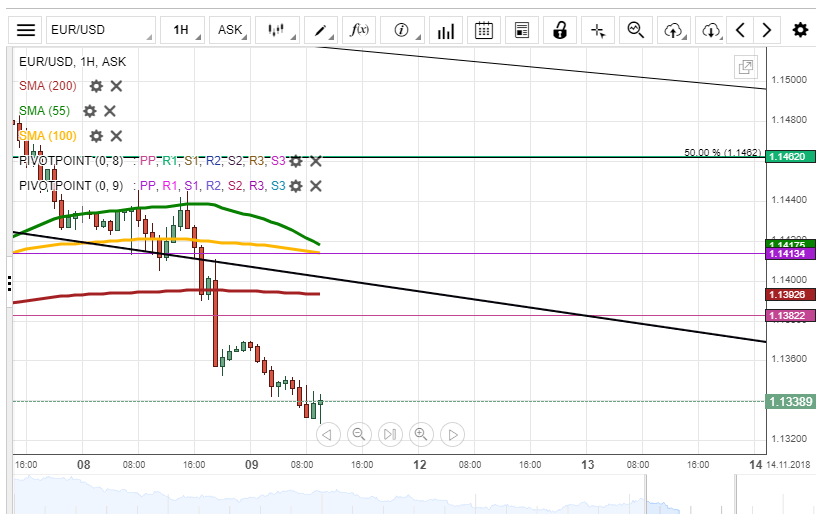
EUR/USD Is Heading To 1.13
On Friday, the EUR/USD traded below the 1.1350 mark. It had declined there after plummeting suddenly in the afternoon of Thursday.
In the near future, the currency exchange rate is expected to continue to decline down to the 1.1300 level. At that level the weekly S1 and the lower trend line of a dominant pattern will meet with the rate.
If the rate, bounces off the support level it will face no resistance to reach back up to the 1.1380 levels. On the other hand it might pierce it and continue to decline.
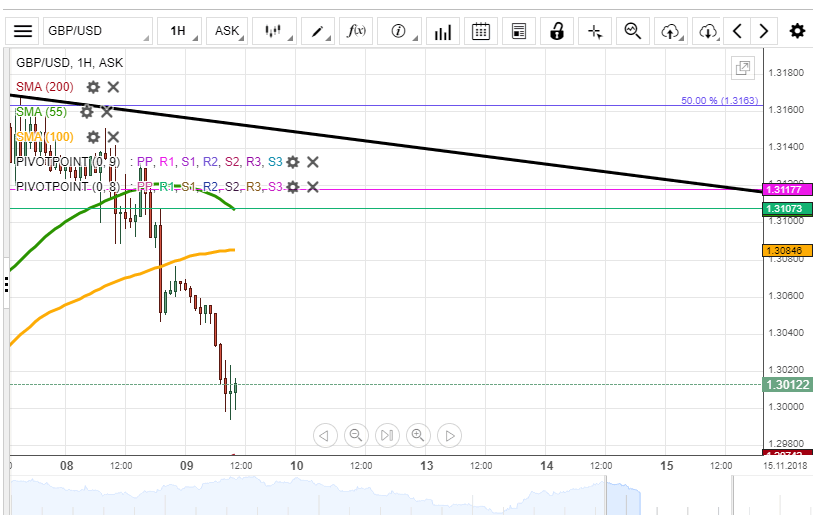
GBP/USD Reaches For SMA At 1.2970
The GBP/USD is heading lower on Friday. Previously, the rate confirmed the 100-hour simple moving average as resistance and began a decline. The decline of the pair was almost over by the middle of Friday's trading. The reason for that was the fact that the pair was about to meet with the lower trend line of the 200-hour SMA at 1.2970.
After meeting the SMA the rate has two scenarios. It will either bounce off the support and surge back up to the 1.3080 level, where the 100-hour SMA is located at. On the other hand the 200-period SMA might get passed and the 1.2900 level could be reached in that case.
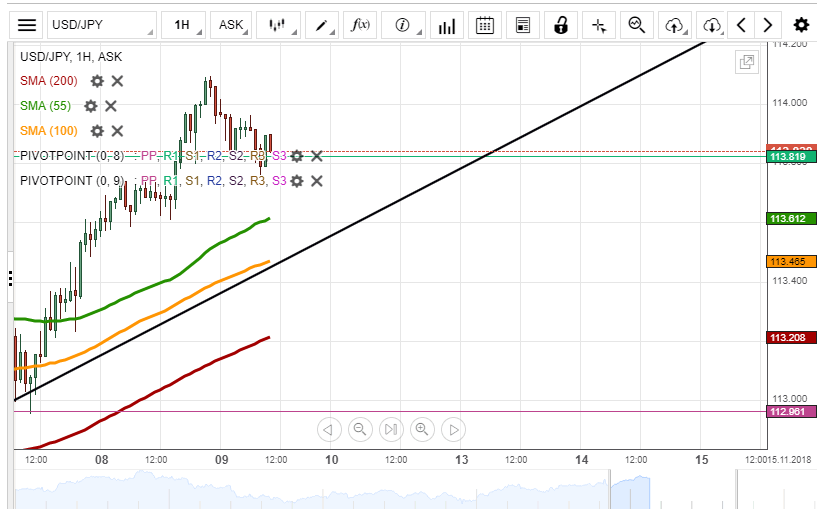
USD/JPY Retraces To 113.80
The US Dollar is taking a break from the surge against the Japanese Yen. Namely, the rate was retracing downwards after reaching the 114.10 level.
On Friday morning the pair found support in a pivot point at 113.80. Due to this support it was assumed that the surge was about to resume and the rate will eventually reach the 114.40 level.
On the other hand, it might trade sideways until the additional technical support of the 55-hour simple moving average approaches. On Friday that SMA was located at 113.60.