Sample Category Title
EURUSD Outlook: Key Supports At 1.1300 Zone Under Pressure But Strong Headwinds Could Be Expected Here Again
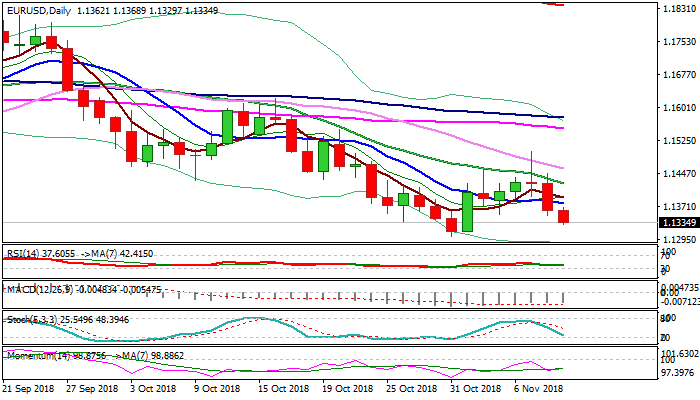
The Euro remains firmly in red and extends lower on Friday, following previous day’s 0.5% fall, which completed bull-trap pattern on daily chart and shifted near-term focus lower.
The single currency came under pressure after strong upside rejection on Wednesday, with further acceleration lower sparked by hawkish Fed on Thursday.
Bears now look for retest of key supports at 1.1311 (200WMA) and 1.1300 (lows of 15 Aug / 31 Oct) but may again face strong headwinds here.
Momentum turn up on daily chart while slow stochastic nears oversold territory support scenario.
Failure on initial attack at 1.1311/00 pivots would result in rebound which could be seen as positioning ahead of final break lower.
Falling 10SMA marks initial resistance at 1.1377, with stronger upticks expected to stall under 1.1400 (daily Tenkan-sen) and keep bears alive.
The pair is on track for the fourth straight bearish weekly close, with long upper shadow on the weekly candle weighing.
Eventual break below 1.1300 zone would signal continuation of larger downtrend from 2018 high at 1.2555 towards next strong support at 1.1186 (Fibo 61.8% of 1.0340/1.2555 rally).
Res: 1.1368, 1.1377, 1.1400, 1.1425
Sup: 1.1311, 1.1300, 1.1255, 1.1226
The FOMC’s Optimism Has Strengthened The Dollar, But There Are Growing Doubts About The Prospects
The US dollar has turned to growth this week following its previous decline in uncertainty. First of all, the risks of unpleasant surprises due to the elections are now gone and the results were close to predictions. Often, subsequent to elections, the currency and stock market of the country experiences some upswing, which was also evident this time, since key American indices added more than 2%.
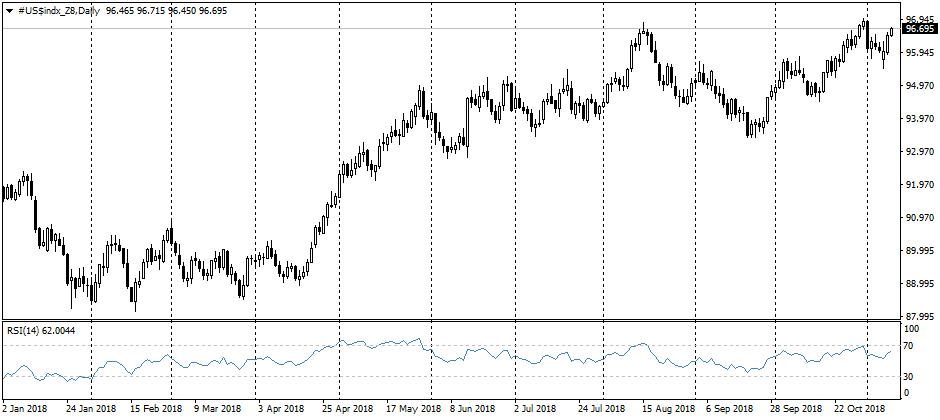
Despite a small decline immediately after the announcement of the election results, the U.S. dollar has turned to growth, adding 1.2% to the Wednesday lows.
The growth wave of the dollar on Thursday supported the Fed. Keeping the policy unchanged, the U.S. Central Bank called the economy “strong” and highlighted the need to maintain its course to gradual rates hiking. Regarding the comments relating to the decision, there was only one cautions moment, about slowing business investments. Such approach has caused yield growth for short-term government bonds that support demand for a dollar as a more yielded currency.
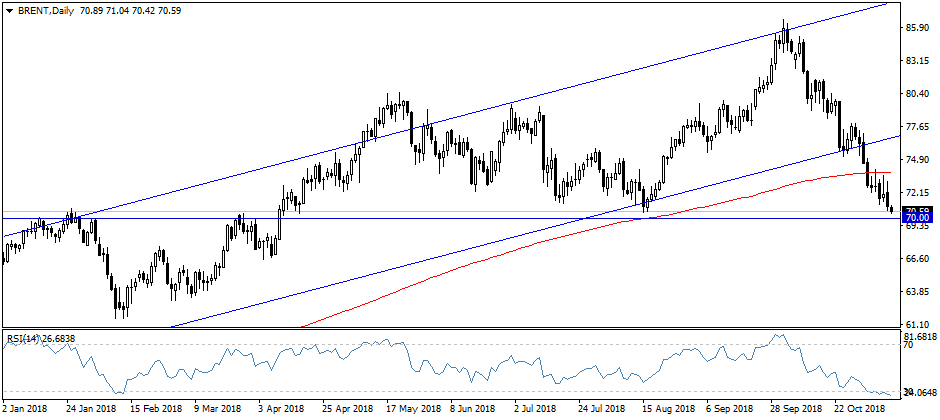
The increase in the dollar due to higher interest rates usually has a negative impact on the demand for developing country currencies and commodities. This week we saw a decrease there, despite the growing demand for risks at American exchanges
It won't be surprising to witness the development of this trend soon, as the events with the greatest potential risks for the dollar (Employment report, Elections, FOMC decision) are already behind.
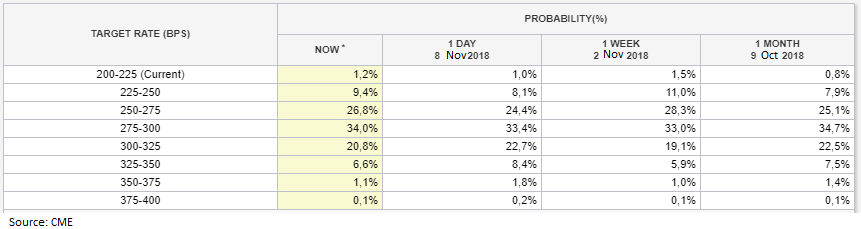
At the same time, it is worth mentioning that over the past month the markets have become less believing that the Fed will produce more than three increases in rates next year. Latest data from CME's FedWatch tool indicate that investors are considering a 27.8% chance to see more than three hikes, against 31.5% a month earlier.
Empowering of this trend could undermine the dollar belief over the long-term perspective.
Forex: Sterling Could See A Major Upward Move
Sterling is weak against the dollar but the move isn't the same agains the Euro, there is an important reason behind this.
GBP/USD In A Freefall
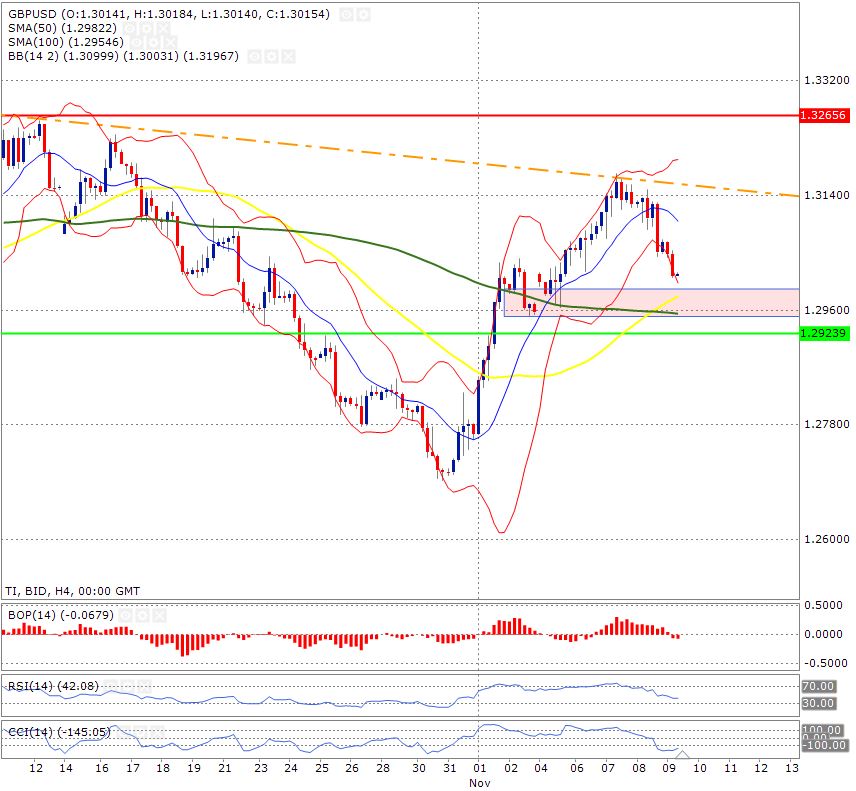
The GBP/USD pair is facing a sharp sell-off on a 4-hour time frame. The price volatility is high as the price has pierced the Bollinger Band. But, an important thing is that the 50-day moving average (shown in yellow) has moved above the 100-day moving average (shown in green) and this is a bullish sign. Of course if the 50—day moving average falls below the 100-day moving average than all bets are off. For the bulls to show that they do have strength, we need the price to break above the downward trend line (shown in orange). The red rectangle area on the chart shows a small area of support and this is could actually push the price back up before it tests its major support mentioned below.
The Balance of power is confirming that the bears have lost control of the price. The Relative strength indicator is moving closer towards its oversold zone but it is still away from the extreme level of 30 which usually calls for a corrective move. Perhaps, the price still has a little more room to go before we that snap back reaction.
The support zone is shown by the horizontal green line-1.2939
The resistance zone is shown by the horizontal red line – 1.32656
EUR/GBP- Faces Lower Volatility
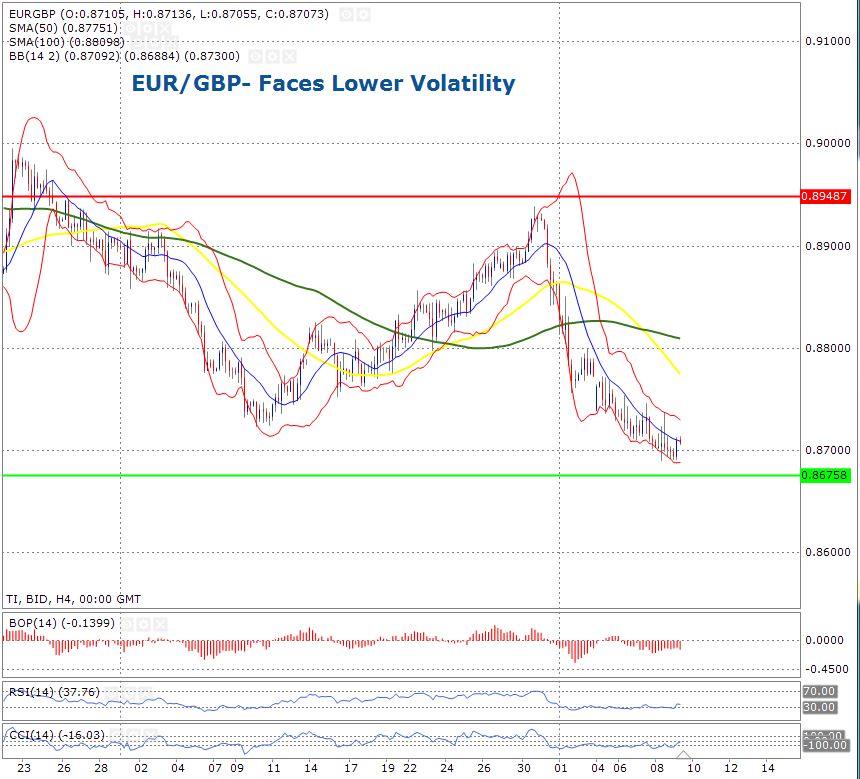
The EUR/GBP pair is trading with the Bollinger band on a 4-hour time frame and this gives us the confirmation that there is very little to no volatility for the pair. In terms of trend, the price is clearly moving downward and it is also trading below the two critical moving averages; 50-day and 100-day moving averages. They are shown in yellow and green colour respectively. The bears are in control of the price and the confirmation of this comes from the Balance of power indicator as it is trading below the 0. When the bars are below 0, it shows that the bears are in control of the price and when the bars are above 0, it confirms that the bulls are in control of the price.
The RSI is trading near an extreme oversold level of 30 and this presents an opportunity for the price of the pair to move higher. Technical traders usually consider the RSI reading of 30 as a bull signal.
The support zone is shown by the horizontal green line- 0.8758
The resistance zone is shown by the horizontal red line – 0.89487
Morning Call: European And U.S Futures Lower | All Eyes On U.K GDP Data
U.K can strike a deal with the EU and this would be the major trendsetter for the pound
European and U.S futures are trading lower today as investors have reacted to the Fed’s firm stance towards their monetary policy and the growing weakness in the Chinese economy. From the FOMC minutes released it was clear that the industry should be expecting another rate hike in December. In other words, a rate hike is engraved on the cards no matter what. The question only is if we are going to see three rate hikes for the next year or if the Fed would be even more aggressive. The dollar index is clearly the beneficiary of this and it has picked up some steam. The index is trading at 96.78 and I think that it is likely that it may touch the level of 97.20.
The Fed confirmed that the U.S. economy is strong and robust. The economic data is due today it could serve as a catalyst for the dollar index continue to be moving higher. We have the core PPI m/m, PPI m/m and Prelim UoM consumer sentiment data due later today. No change is expected in the PPI and core PPI number as the forecast is for 0.2% which is the same as the last month. The consumer sentiment number may show some weakness due to the ongoing trade war and it may print the number of 98.0, which is a little weak as compared to the previous number of 95.6.
Closer to home, it is all about if the U.K can strike a deal with the EU and this would be the major trendsetter for the pound. Fund managers have clearly shifted their stance towards the currency and they have become a lot more bullish. They anticipate that it is likely that the currency could see some strong days in the coming weeks. So far this month, we have already seen a 3 percent rally in the pound. Hopes are high that Theresa May may be able to strike a deal with the EU as early by next week. She has started to brief her team on the almost-finished deal, But if her deal is rejected in the parliament then it may be just the best option for the UK to throw the towel on the Brexit hope and just stay in the EU. One can never factor out this scenario and that itself would be highly positive for Sterling.
In terms of economic data, we have the UK’s 3Q GDP data due at 09:30 and the likely chances are that this number may confirm that the UK’s economy experienced a temporary growth. Remember during the Q2, it was the services sector which pulled more weight on a month on month basis and the construction sector also provided some support for the GDP. However, the monthly data also confirm that the number may not remain this hot during the fourth quarter. But, this could change if the U.K is able to strike a deal with the EU. Remember if that happens, then we must expect the bank of England to play an aggressive hand and the interest rate in the U.k could start moving higher steeply. A Good luck to those who are trying to jump on the property ladder.
Gold and Crude Oil Could Accelerate Declines
Gold price topped near the $1,237 level and declined recently. Crude oil price is under a lot of pressure and it may slide further towards the $60.00 or $58.00 levels.
Important Takeaways for Gold and Oil
- Gold price traded higher nicely until sellers appear near the $1,236-1,237 zone against the US Dollar.
- There was a break below a major bullish trend line with support at $1,226 on the hourly chart of gold.
- Crude oil price declined heavily recently after topping above the $68.00 pivot level.
- There is a key declining channel in place with resistance at $61.70 on the hourly chart of XTI/USD.
Gold Price Technical Analysis
Gold price followed a nice upward move from the $1,212 support area against the US Dollar. The price traded higher and it broke key resistances near the $1,220 and $1,224 levels before sellers appeared near $1,237.
The upside move was positive as the price broke the $1,230 resistance and the 50 hourly simple moving average as well. However, the price faced a lot of selling interest near the $1,236, $1,237 and $1,238 resistance levels.
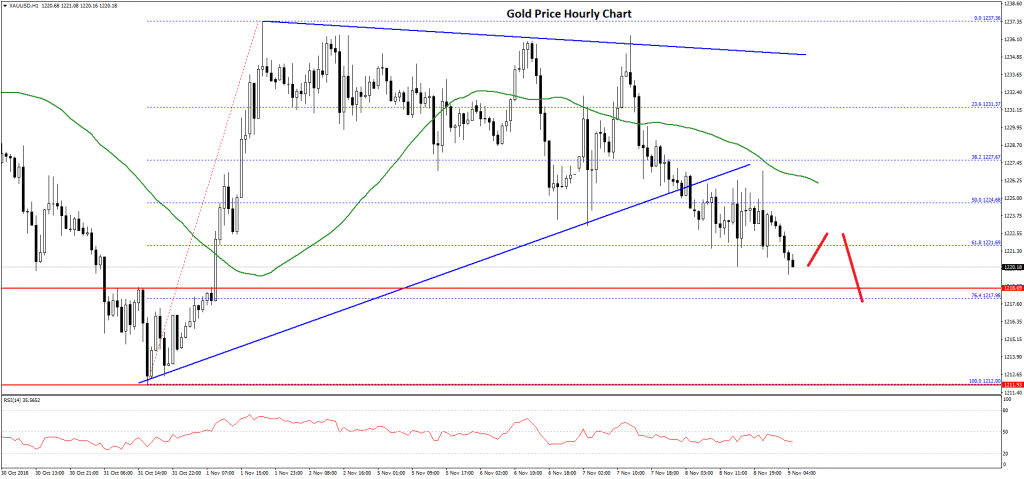
A swing high was formed at $1,237.36 on FXOpen before the price started a downside move. It broke a major bullish trend line with support at $1,226 on the hourly chart. Besides, there was a break below the 61.8% Fib retracement level of the last wave from the $1,212 low to $1,237 high.
It opened the doors for more losses and pushed the price in a bearish zone below the $1,220 support. It seems like the price may continue to move down towards the $1,212 support area in the near term.
On the other hand, if there is an upside correction, the price may face sellers near the $1,221 level. Above $1,220-1,221, the price could retest the $1,225 resistance and the 50 hourly simple moving average where sellers are likely to emerge.
Overall, gold is currently following a bearish path towards the $1,212 support and any recovery is likely to face sellers on the upside.
Oil Price Technical Analysis
Crude oil price failed to hold gains above the $68.00 pivot level and declined heavily against the US Dollar. The price traded lower and broke a few key supports near the $66.00 and $64.00 levels.
The recent decline was such that the price even broke the $62.00 support and the 50 hourly simple moving average. It traded close to the $60.00 support recently and formed a low at $60.42.
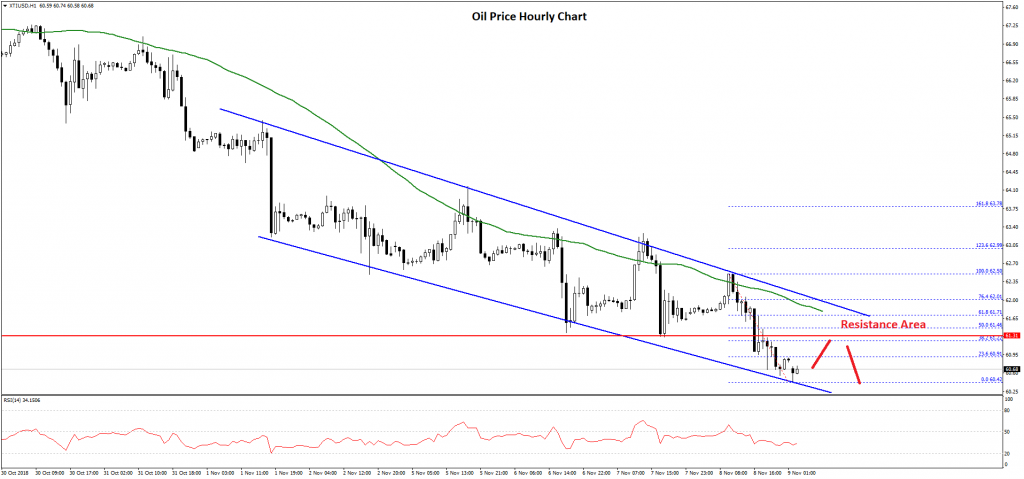
At the moment, the price is consolidating losses and it could test the 23.6% Fib retracement level of the recent decline from the $62.50 high to $60.42 low. More importantly, there is a key declining channel in place with resistance at $61.70 on the hourly chart of XTI/USD.
Around the channel resistance, the 50 hourly SMA is positioned along with the 50% Fib retracement level of the recent decline from the $62.50 high to $60.42 low.
Therefore, if the price corrects higher from the current levels, sellers are likely to appear near the $61.20, $61.50 or $61.80 resistance levels.
On the downside, a downside break below the recent low at $60.40 will most likely increase chances of a push below the $60.00 support. The next major support in the mentioned case could be near the $59.40 level.
Dollar Index Is Testing Annual Highs
The US currency has been growing against the basket of major currencies. Yesterday, the Fed meeting was held, at which the regulator decided on the interest rate. As the experts expected, the interest rate remained unchanged at the level of 2.00-2.25%. The Fed also said that the US economy and labor market were strong, and it intends to adhere to a further gradual increase in interest rates. The next meeting and decision on the Fed interest rate will be held in December. The US dollar index (#DX) has updated the weekly high and closed in the positive zone (+0.71%).
Investors' attention is also focused on Brexit. The European Commission intends to prepare for a tough version of the UK exit from the EU if London and Brussels do not reach an agreement. Starting from November 20, the European Commission will organize special seminars for EU member states. In total, there will be 12 such seminars. Today, investors expect important economic statistics from the UK and the US.
The "black gold" prices have fallen significantly. At the moment, futures for the WTI crude oil are testing a mark of $60.50 per barrel.
Market Indicators
Yesterday, there was a variety of trends in the US stock market: #SPY (-0.18%), #DIA (+0.12%), #QQQ (-0.64%).
At the moment, the 10-year US government bonds yield is at the level of 3.21-3.22%.
The news feed on 09.11.2018:
Data on the UK GDP at 11:30 (GMT+2:00);
The volume of production in the UK manufacturing industry at 11:30 (GMT+2:00);
Producer price index in the US at 15:30 (GMT+2:00).
Dollar Cruises Higher After FOMC, UK GDP In The Spotlight
Here are the latest developments in global markets:
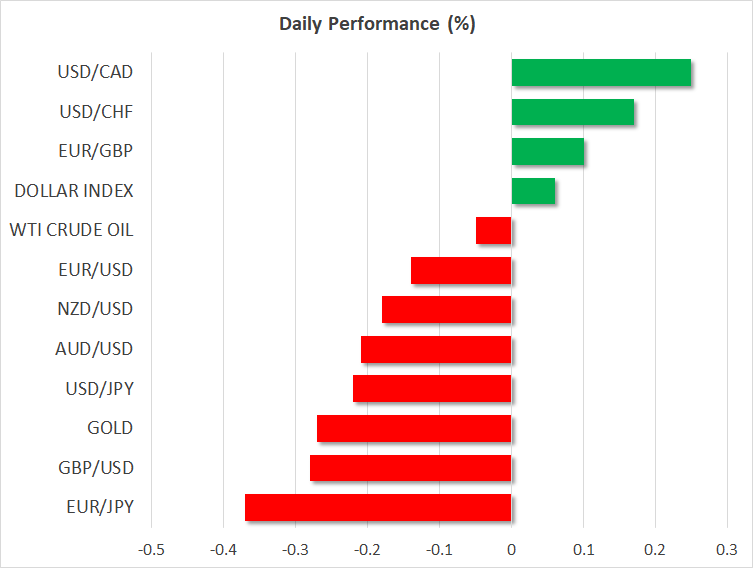
FOREX: The dollar is little changed against a basket of six major currencies on Friday (+0.06%), consolidating the gains it recorded in the previous session as the Fed signaled it remains on track to meet its rate-path projections. Meanwhile, the defensive yen is outperforming, as risk appetite seems to have soured once again. In Canada, the loonie continued to track oil prices lower, touching a fresh two-month low against the dollar.
STOCKS: Wall Street closed lower for the most part on Thursday, as the Fed maintained a relatively confident tone, keeping a December rate hike firmly on the table and providing no hints that trade or other risks will delay its normalization efforts. The result was US bond yields remaining at elevated levels, taking the wind out of the sails of equity investors. The Nasdaq Composite (-0.53%) and S&P 500 (-0.25%) both edged lower, though the Dow Jones managed to eke out a 0.04% gain. Futures tracking the Dow, S&P, and Nasdaq 100 are all pointing to a lower open today as well. Asia was a sea of red on Friday, with Japan's Nikkei 225 (-1.05%) and Topix (-0.49%) posting moderate losses compared to the Hang Seng in Hong Kong (-2.41%). Similarly, all the major European indices were set to open lower today, futures suggest.
COMMODITIES: Oil continued its downfall amid lingering concerns the market may be shifting towards oversupply again, in light of the US waivers on Iranian sanctions and the soaring production domestically in the US. The demand side hasn't been any brighter, with global growth slowing and US-China trade tensions adding another dimension to risks. The only bright spot that may stem the decline is that OPEC is flirting with cutting its output again, though speculation around this hasn't caught much wind yet. In precious metals, gold is down by another 0.27% on Friday at $1,220 per ounce, extending losses from yesterday and looking set to record a sixth day of losses in a row. The near-term outlook is still neutral, though a break back below the $1,212 barrier and the 100-day moving average could turn it negative.
Major movers: Dollar extends gains as FOMC sticks to script
As widely anticipated, the Fed kept rates unchanged yesterday, with the statement accompanying the decision containing few changes from previously. The Committee acknowledged the unemployment rate has declined further and noted household spending continued to grow strongly, but also that business investment moderated somewhat. The absence of concrete policy updates probably enhanced the narrative that policymakers remain committed to raising rates again in December and another 3 times next year, in line with their “dot plot” projections – which are more hawkish than current market pricing. Accordingly, the dollar gained in the aftermath.
In other words, the fact that officials refrained from sounding a note of caution with respect to trade risks or the recent market volatility likely gave the bulls the “green light” to re-enter long-dollar positions. Overall, the message from the Fed was consistent; it remains dedicated to raising rates in a gradual manner amid a fiscally-turbocharged US economy, and the current risks are not enough to derail, or even delay, this normalization process. Euro/dollar fell notably to settle near 1.1340, from around 1.1400 ahead of the decision.
In the broader market, the heightened appetite for risk assets that was evident after the US midterms proved short-lived, with US stock indices closing mostly lower yesterday and markets in Asia flashing red today. Consequently, the defensive yen has attracted some inflows, and looks set to recover some of its latest losses. The catalyst may have been the “confident” tone by the Fed, which assisted in keeping longer-term US Treasury yields at elevated levels, likely reviving some jitters around rising interest rates.
Elsewhere, the loonie touched a two-month low versus the greenback earlier today. The Canadian currency has taken a beating alongside oil prices in recent weeks. News overnight that the widely-touted Keystone oil pipeline has been blocked by a US Federal court likely amplified the negative sentiment. It was expected to connect Canada and Texas, to eliminate transportation bottlenecks.
Day ahead: UK GDP in focus; US PPI and U of M survey also due
Friday's calendar features quarterly GDP figures out of the UK, while the US will be on the receiving end of producer price data, as well as the University of Michigan's (U of M) survey on consumer sentiment.
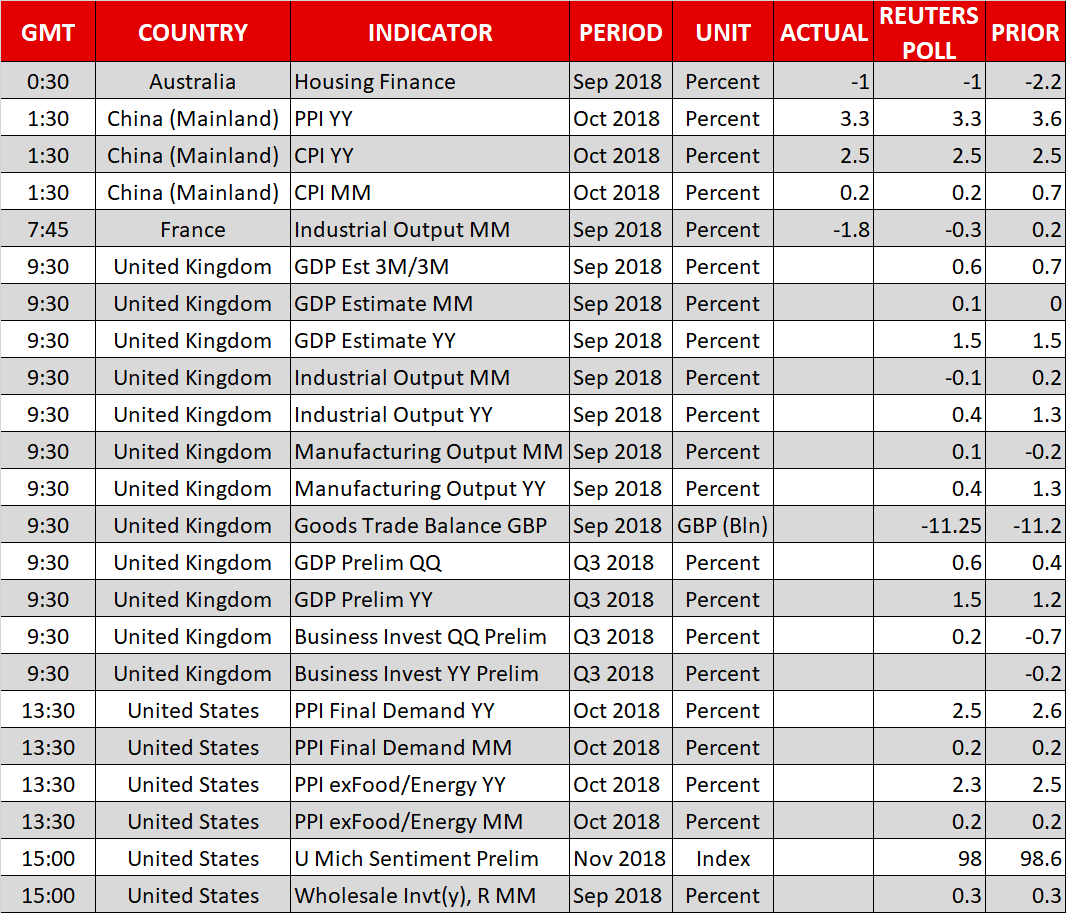
At 0930 GMT, preliminary UK GDP data for Q3 will be made public. The economy is forecast to have accelerated relative to Q2, growing by 0.6% q/q (vs 0.4% previously). The annual pace of growth is projected to stand at 1.5% (vs 1.2% in Q2). While Brexit developments have been acting as the primary driver of sterling pairs, the numbers are significant and deviations from expectations are likely to give some near-term direction to the pound.
Monthly GDP prints for September will also be released out of the nation at 0930 GMT, with the readings on Q3 business investments, September's trade balance, and industrial & manufacturing output for the same month also slated for release at the same time. Manufacturing production is predicted to expand by 0.1% m/m, after contracting by 0.2% in August.
Out of the US, October factory inflation as gauged by the producer price index (PPI) will be hitting the markets at 1330 GMT. Both headline and core PPI – the latter excludes volatile food and energy items – are anticipated to slightly ease on a yearly basis relative to September. Traders may use these numbers to speculate on how next week's (Wednesday) CPI data come out, though it should be stressed that the two measures – PPI and CPI – are far from perfectly correlated.
Also out of the world's largest economy is the U of M's preliminary survey gauging consumer morale during November. The relevant index is projected to weaken, though at 98.0 still remain at relatively elevated levels. The survey's sub-indexes measuring inflation expectations have proved market-moving in the past and will thus also be attracting attention. The readings are due at 1500 GMT, alongside September's wholesale inventory data.
Elsewhere, the EU's warnings over Italy's budget deficit are keeping investors' eyes on a potential clash between Italian and EU officials. Such an outcome is expected to prove euro-negative, at least in the short term.
The ECB's Coeure will be talking at 1000 GMT, with Bank of England chief economist Haldane making a public appearance at 1830 GMT. Numerous Fed policymakers are also on the agenda, specifically Williams (permanent FOMC voting member – 1330 GMT), Harker (non-voter – 1345 GMT) and Quarles (permanent voter – 1405 GMT).
In energy markets, Baker Hughes data on active oil rigs in the US are due at 1800 GMT.
Technical Analysis: GBPUSD looks mostly neutral in short term
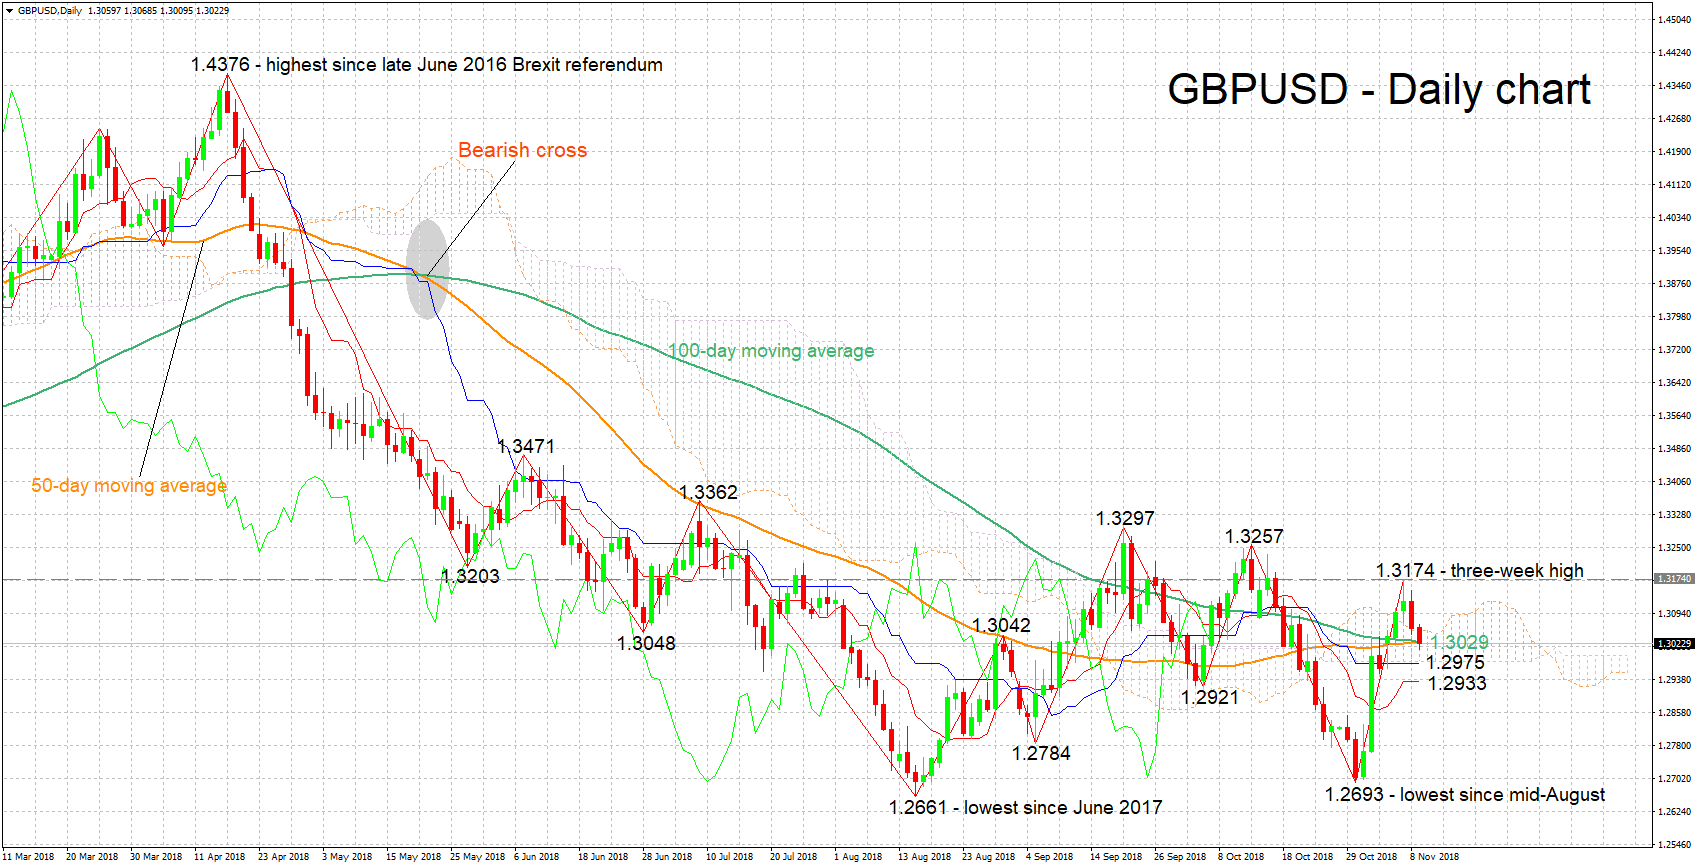
GBPUSD has retreated from the three-week high of 1.3174 hit earlier in the week. The Tenkan- and Kijun-sen lines are negatively aligned, though they have both flatlined, overall pointing to a mostly neutral short-term picture for the pair.
Stronger-than-projected GDP growth out of the UK is likely to boost the pair. Initial resistance to gains may occur around 1.3055, the Ichimoku cloud top. Further above and given a break of the 1.31 handle, Wednesday's three-week high of 1.3174 would come back into view.
In the event of a more decisive move below the 50- and 100-day moving average lines at 1.3029 (the two have converged) coming on the back of downbeat numbers out of the UK, support could occur from the zone around the Kijun-sen. The region around this also includes the 1.30 mark and the Ichimoku cloud bottom. Steeper losses would turn the attention to the Tenkan-sen at 1.2933; the area around this captures a previous bottom at 1.2921. Lower still, early September's trough of 1.2784 would increasingly come within scope.
Brexit headlines and US data out on Friday can also move the pair.
GBP/JPY Daily Outlook
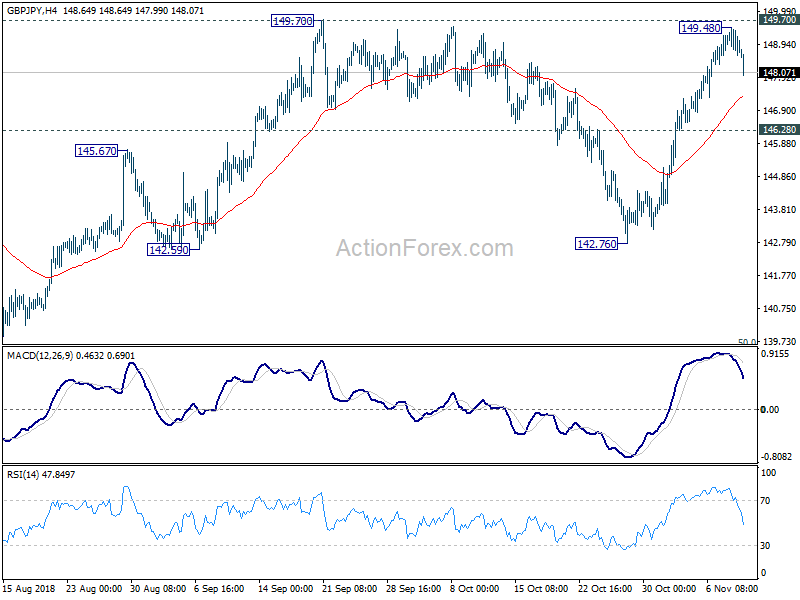
Daily Pivots: (S1) 148.54; (P) 149.01; (R1) 149.42; More...
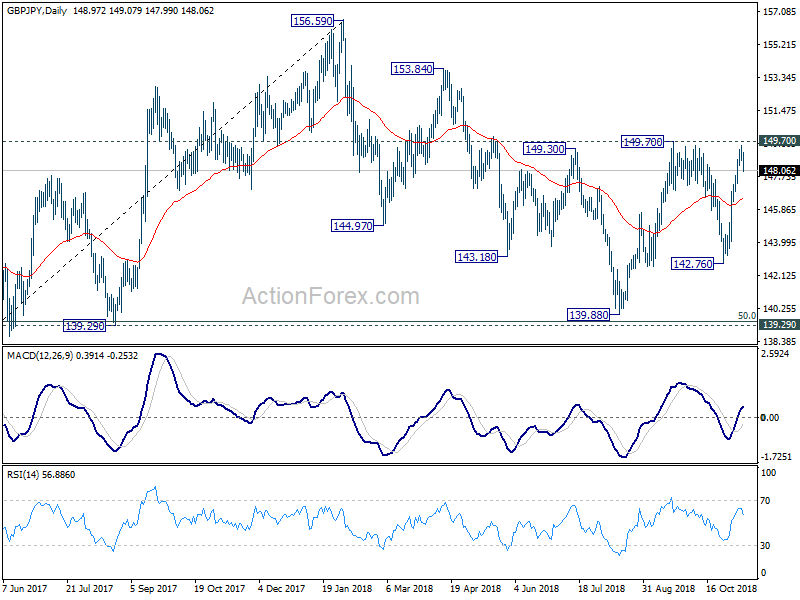
GBP/JPY's decline from 149.48 extends lower today but it's staying above 146.28 minor support. Intraday bias stays neutral first and another rise is mildly in favor. On the upside, decisive break of 149.70 will resume whole rise from 139.88 and target 153.84/156.59 resistance zone. On the downside, below 146.28 minor support will turn bias back to the downside for 142.76 instead.
In the bigger picture, as long as 139.29 cluster support (50% retracement of 122.36 to 156.59 at 139.47) holds, up trend from 122.36 (2016 low) would still extend beyond 156.69 high. However, decisive break of 139.29/47 will suggest that such up trend is completed and turn outlook bearish. In that case, next target is 61.8% retracement at 135.43.
GBPUSD Outlook: Extended Pullback Pressures Key 1.30 Support Zone, UK Data Eyed For Fresh Signals
Sterling bulls gave up after strong upside rejection just under falling 30WMA (1.3183) on Wednesday and subsequent pullback which generated negative signal on formation of bearish outside day on Thursday.
Hawkish tone from Fed on Thursday, after leaving interest rates unchanged as expected, but pointed at strong growth, reaffirming expectations for rate hike in December, inflated the dollar and kept pound in defensive mode.
Cable extends weakness in early Friday's trading through converging 100/55SMA's and pressuring pivotal 1.30/1.2980 support zone (psychological support/Fibo 38.2% of 1.2857/1.3174/daily cloud base).
Firm break here would add to negative signals on confirmation of reversal pattern.
Daily slow stochastic heads south after reversing from overbought zone and supports scenario but momentum is still firm and conflicting bearish signals.
Ability to hold above 1.30 zone would keep bulls in play for fresh attempts higher as overall sentiment is positive on Brexit optimism.
Immediate focus turns towards UK data, with UK GDP forecasted higher in Q3 (q/q 0.6% vs 0.3% prev/y/y 1.5% vs 1.3%), Manufacturing production expected to pick up in Sep (0.1% f/c vs -0.2% prev) while trade gap is expected to widen slightly in Sep (-11.4B f/c vs -11.20B prev).
Stronger than expected figures would offer fresh support to sterling and signal an end of corrective phase, while weak numbers would add to negative near-term outlook.
Res: 1.3033, 1.3055, 1.3071, 1.3149
Sup: 1.3000, 1.2980, 1.2958, 1.2935

EUR/JPY Daily Outlook
Daily Pivots: (S1) 129.28; (P) 129.71; (R1) 130.02; More....
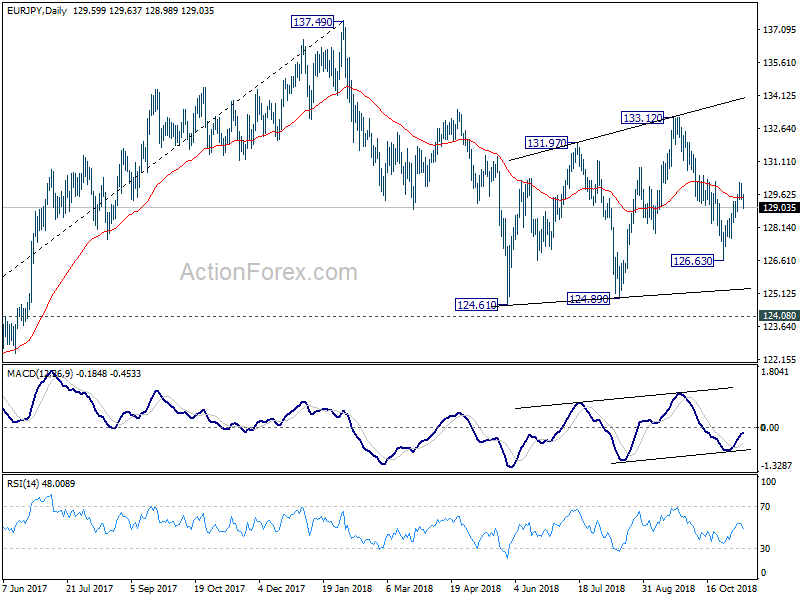
Intraday bias in EUR/JPY stays neutral for the moment and outlook is unchanged. We'd continue to expect strong resistance from 130.20 to limit upside, to resume the decline from 133.12. On the downside, break of 128.38 minor support will turn bias to the downside. Break of 126.63 will extend the fall from 133.12 to retest 124.89 low. Nonetheless, sustained break of 130.20 will pave the way back to 133.12 high instead.
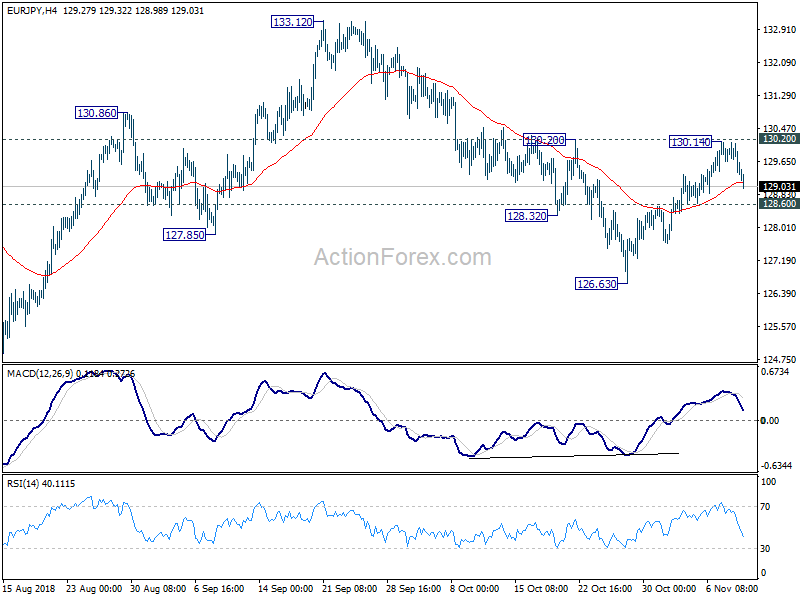
In the bigger picture, as long as 124.08 key resistance turn supported holds, larger up trend from 109.03 (2016 low) is still in progress. Firm break of 137.49 structural resistance will target 141.04/149.76 resistance zone next. However, decisive break of 124.08 will argue that such rise from 109.03 has completed and turn outlook bearish. In that case, deeper fall would be seen to 61.8% retracement of 109.03 to 137.49 at 119.90.