

Sample Category Title
Elliott Wave Analysis: AUDUSD Can Be Facing A Correction
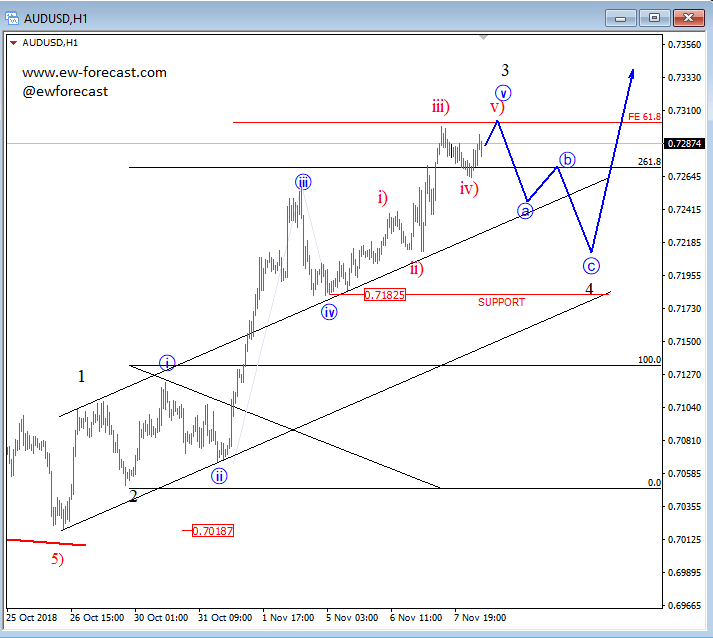
AUDUSD is slowly reversing, ideally unfolding a bigger, five-wave recovery which we labelled as wave 3. Wave 3 is an impulse within a trend, and is the strongest one. Particularely we see sub-wave v of 3 in progress with its five minor legs, up from 0.7183 level which can find a new top near the 0.7300 region. Once we get a full five-wave recovery within sub-wave v of 3, that is when a temporary correction as wave 4 may follow, which can later look for support and a bullish reversal near the 0.7183 level.
AUDUSD, 1h
Yen Falls After Weak After Weak Bank Lending And Machinery Order Data
The US markets moved higher yesterday after the Midterm election results were announced. As predicted, Republicans took control of the House while Democrats took control of the Senate. In a post-election press conference, Donald Trump signaled that he will seek to work with the Democrats. However, analysts expect increasing conflicts in the days to come.
The price of crude oil dropped sharply yesterday after the Energy Information Administration (EIA) released inventory data. The data showed that the inventories were higher than what most traders were expecting. In the past week, inventories rose to 5.783 million barrels, which was higher than the 2.433 million barrels that traders were expecting. This data came hours after API released the inventory numbers of 7.83 million barrels. The inventories have been increasing in the past weeks as companies prepared to fill the gap left by Iran.
Japanese yen declined in the Asian session after disappointing data from Japan. In October, bank lending rose by an annualized rate of2.2%, which was higher than the consensus estimate of 2.4%. Bank lending is important because it is an indicator of consumer spending and investments. Core machinery orders declined by an annualized rate of minus 7.0% - which was lower than the gain of 7.7% that traders were expecting and the lowest level it has been since September last year. As a major industrial country, a decline in machinery orders is a good indicator of business performance.
Today, a number of economic data will be released that will impact the market. China will release its monthly trade data. In the US, the Federal Reserve will release the interest rates decision. While it is not expected to make adjustments, the bank will send signals about its future pace of hikes. The European Union will release the economic forecasts. In the US, the Department of Agriculture will release the World Agricultural Supply and Demand Estimates (WASDE) report. This will lead to major movements in the agricultural crops sector.
EUR/USD
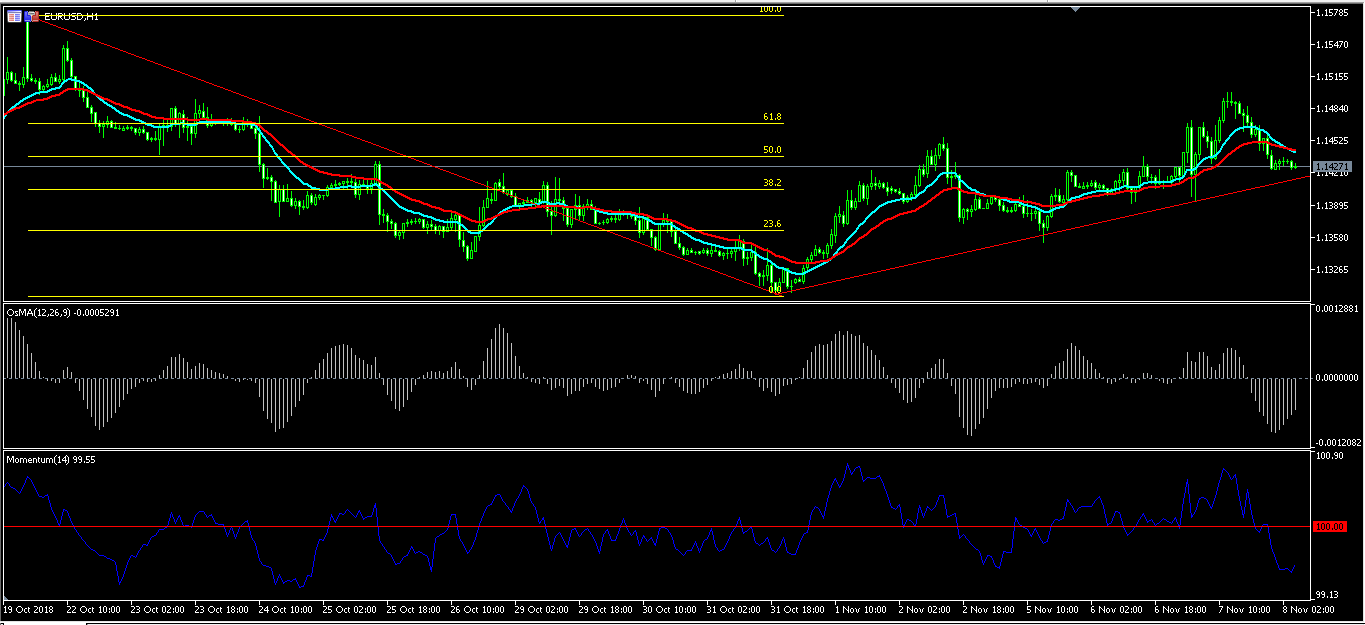
The EUR/USD pair declined in the Asian session ahead of the Fed decision. It reached an intraday low of 1.1425. The pair’s price is slightly below the 50% Fibonacci Retracement level. The moving average oscillator has eased the declines while the momentum indicator shows little downward momentum. Therefore, there is a likelihood that the pair will remain unchanged today ahead of the Fed decision.
USD/JPY
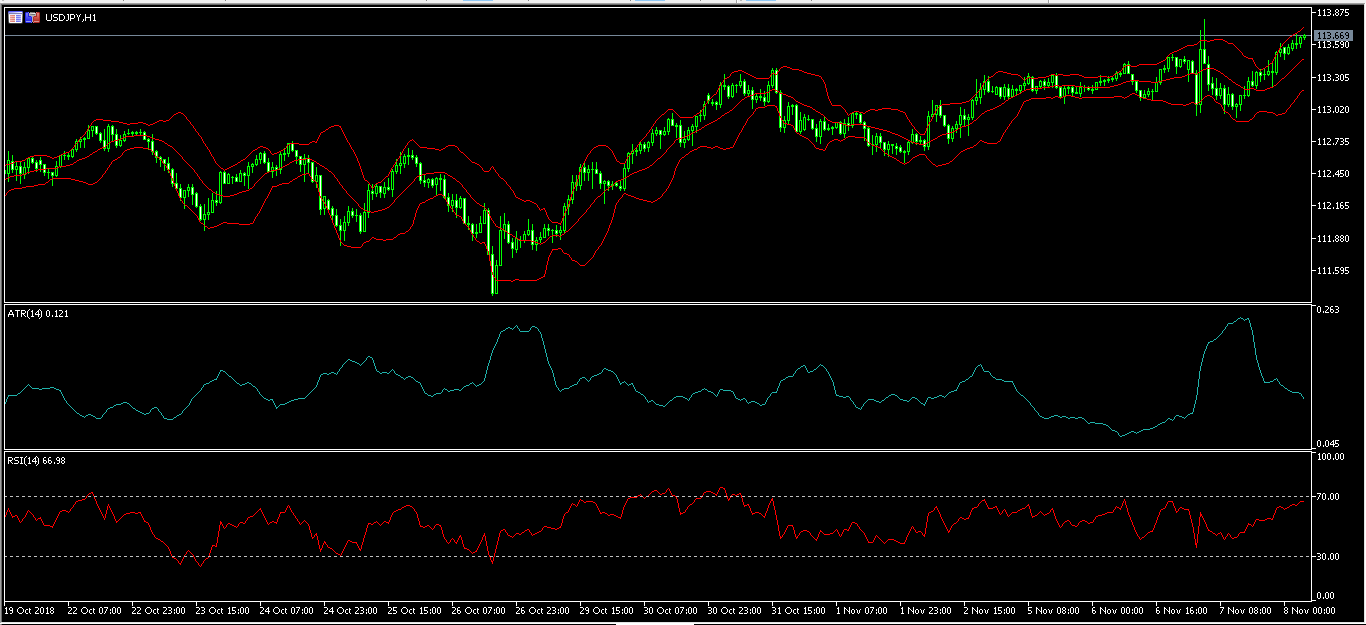
The USD/JPY pair rose in the Asian session after weak economic data from Japan. It is now trading at 113.67, which is the highest level since yesterday morning. The Average True Range indicator has fallen to 0.21, which is an indicator that the pair’s volatility is easing. The RSI indicator is at 67, which is a bullish sign while the MACD is sending bullish signals in the hourly chart. Therefore, there is a possibility that the pair will continue the upward trend ahead of the data from the Fed.
XBR/USD
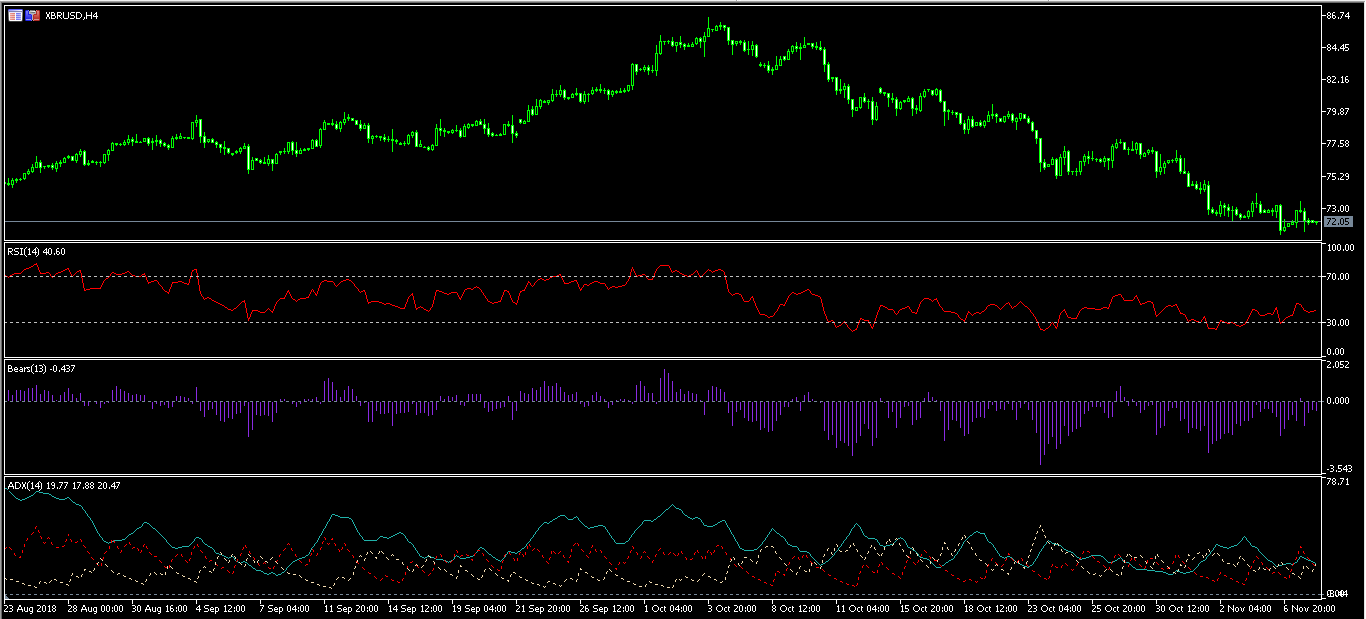
The price of Brent dropped sharply yesterday after the inventories data. It reached a low of $71.35, which was the lowest level since Tuesday. Overnight, the XBR/USD pair rose slightly to 72. On the four-hour chart, the pair’s Relative Strength Index has risen from a low of 23 to the current 43. The Bears Power strength has weakened while the ADX is currently at 17. This data show that the pair has likely found a floor and that it could move higher.
US Midterm Elections – Split Congress Paves the Way for Slower, but More Sustainable, Growth Outlook
The dust is settled on the result of US midterm elections. As polls have suggested, the Congress is split with Republicans continuing the control of the Senate and Democrats is taking over the House.
In our election preview, we have suggested that the most Democrats can do is delaying the legislative process and rejecting some of the new fiscal stimuli. While the Democrats might not want a full-blown trade war against the world, it appears that taking a tougher stance against China’s unfair trade and investment policies towards foreign companies is a consensus between the two parties. They would unlikely be able to repeal the bills passed, let alone successfully impeach the President.
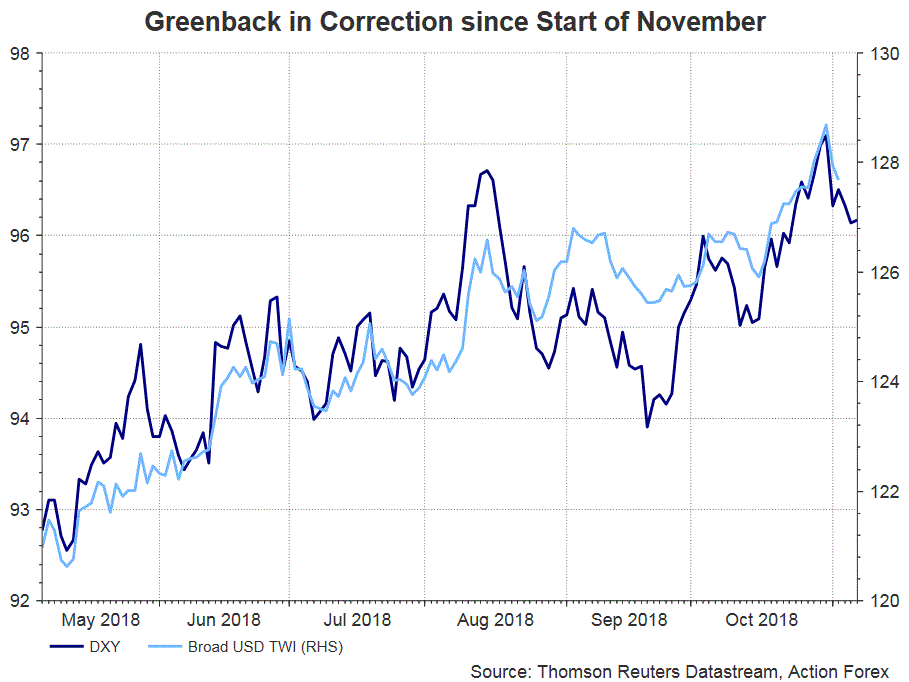
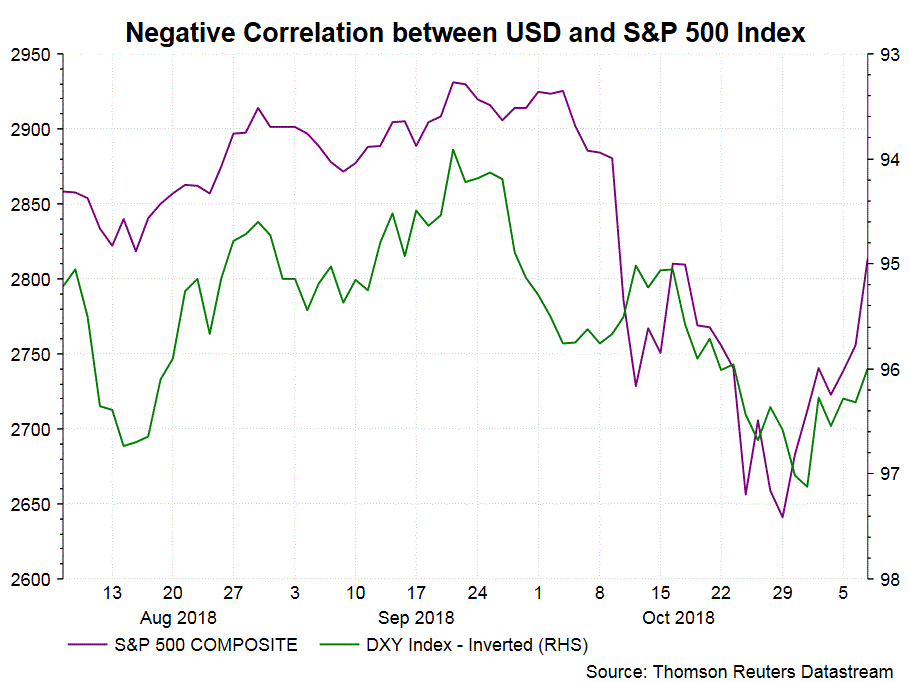
There have been sayings suggesting that US political gridlock is positive for the stock markets. Indeed, S&P 500 has risen more than +3% over the past two days. We believe the rationale of the market rally is that fewer fiscal stimulus should lead to lower chance of an overheating economy. This should in turns lead to deceleration of Fed’s rate hike path, a situation positive for business and household spending. Meanwhile, expectations for a more gradual rate hike path are the reason for US dollar’s recent correction. A weaker currency is usually viewed positively as it helps exports.
Fiscal Stimuli
It is evident that Trump and his Republican Party are seeking a second term in the 2020 presidential election. The key measure they would adopt to secure support is fiscal stimulus. Therefore, if Republicans had been able to retain control of both chambers, more aggressive fiscal stimulus, even another big tax reduction, is more likely in theory. This scenario should raise the probability of economy overheating, resulting in more aggressive Fed funds rate hike. Worse still, the debt-ridden US government (in twin deficits for long), would need to finance the stimuli by borrowing, resulting in higher interest rates in the market.
Fed
Recall that, despite its control over both the House and Senate late year, Republicans found it impossible to pass the tax reform bill without making a number of amendments to get sufficient votes. We expect passage of future of fiscal stimuli would only be harder under a split Congress. Yet, Democrats do not necessarily object all stimulus measures. They are in favor of fiscal stimulus measures that are more beneficial to lower income class. As such, the party might be able to eventually compromise on raising expenditure on social programs and increasing infrastructural spending. In short, we expect less aggressive fiscal stimulus reform in coming years. The US expansion cycle might inevitably be shorter than the one with aggressive fiscal easing. Yet, the Fed might be able to slow monetary tightening, adopting fewer rate hikes to tame down inflation. In this case, we probably could have a more gradual and sustainable growth.
USD
US dollar’s outlook could be gloomier under a split Congress, as the Fed might moderate the rate hike pace. A weaker currency is usually viewed positively as it helps exports. The outlook of USD is also dependent on yield differential between US and other countries. While ECB is expected to end it QE in December, it has pledged to leave the policy rate at exceptionally low level for some time. Struggling with low inflation, BOJ has clung on to yield curve control and record low interest rates. While BOE has signaled to accelerate rate hikes in 2019, implementation still depends on Brexit negotiations. RBA and RBNZ are expected to keep the powder dry in 2019. BOC might be able to catch up with Fed’s rate hike as the USMCA trade deal is secured. As such, the Fed is the only central bank in major economies that is firmly in the rate hike path. This should prevent the greenback from sharp selloff.
Ethereum Outlook After Recent Rally
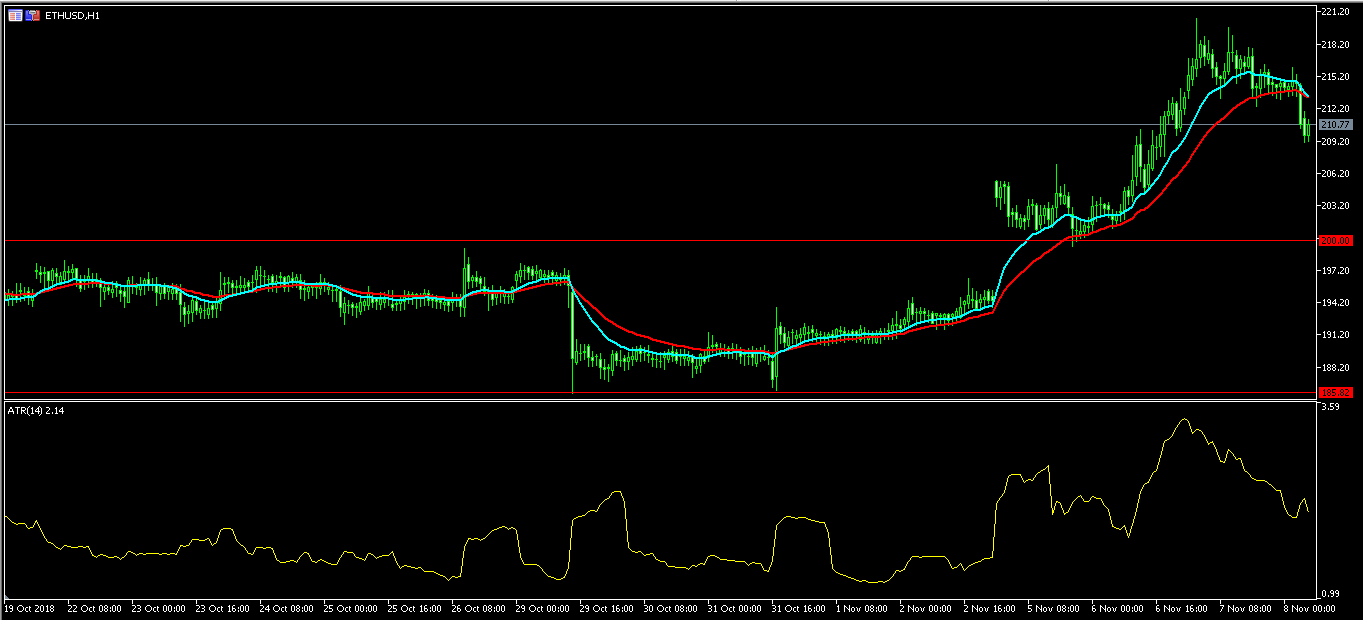
October was a dull month for Ethereum and other cryptocurrencies. The price of Ethereum remained little changed as the Average True Range (ATR) indicator remained at low levels. The ATR is an indicator used to show the volatility of securities.
In November, this has changed. The price of the ETH/USD has rallied from 185 to a monthly high of 220, which is a 18% gain.
There are a number of reasons for this month’s gains. Firstly, there are signs that the SEC could accept a BTC ETF before the year ends. If this happens, it could result in a short-term crypto rally. Secondly, there has been no major news of an exchange hack in recent weeks. In the past, reported hacks have led to increased volatility in the price of Ethereum and other cryptocurrencies. Thirdly, there is a technical factor whereby the consolidation in October led many to believe that a breakout would happen.
Yesterday, in a conference in San Francisco, former Google Chairman, Eric Schmidt, said that Ethereum had a lot of potential. This is because it is built to solve a problem in the smart contract industry. This was affirmation for a cryptocurrency that has been under pressure in the past few months. The pressure started when Tech Crunch published an article criticizing the value of ETH.
This week, mining giant Bitfury announced that it had closed a private placement of more than $80 million. The deal was led by a number of investors such as Michael Novogratz, Macquarie Capital, and Dentsu among others. This was one of the biggest private deals in the cryptocurrencies industry. It comes after two of the biggest Bitcoin miners – Genesis and Bitmain – launched their IPOs.
The ETH/USD pair is trading at 210, which is 10 points lower than this month’s high of 220. The double EMA of 30 and 15 days made a crossover today which is a sign that the pair could continue moving lower. The ATR has moved from a high of 3.38 to the current low of 2. This is a sign that the previous volatility has eased. There is a likelihood that the pair will move lower to probably the 200 level.
China-US trade shrank sharply in October, exports down -8.5%, imports down -12.9%
Trade data from China showed sharp decline in trade between the US and China in October, clearly a result of tariffs. To highlight, exports to US dropped -8.5% mom. Imports from US dropped even more by -12.9% mom. One might argue that imports from EU also dropped -12.5% mom. Admittedly, that could be a warning sign of slowdown in the Chinese economy. But over the year, imports from EU did rose 12.3% yoy.
In USD term, exports rose 15.6% yoy in October to USD 217.3B. Imports rose 21.4% yoy to USD 183.2B. Trade surplus widened to USD 34.0B, below expectation of USD 36.3B.
In CNY terms, exports rose 20.1% to CNY 1490B. Imports rose 26.3% to 1257B. Trade surplus widened to CNY 234B, above expectation of CNY 209B.
With EU in October:
- Total trade dropped -8.8% mom, rose 13.7% yoy to USD 56.7B.
- Exports to EU dropped -6.4% mom, up 14.6% yoy to USD 35.0B
- Imports from EU dropped -12.5% mom, up 12.3% yoy to USD 21.6B
- Trade surplus rose 5.3% mom, 18.5% yoy to USD 13.4B
With EU from January to October
- Total trade rose 12.8% yoy to USD 563.6B
- Exports to EU rose 11.8% yoy to USD 336.7B
- Imports from EU rose 14.3% yoy to USD 226.8B
- Trade surplus rose 7.0% yoy to USD 109.9B
With US in October
- Total trade dropped -9.4% mom, rose 9.8% yoy to USD 53.7B
- Exports to US dropped -8.5% mom, up 13.2% yoy to USD 42.7B
- Imports from US dropped -12.9% mom, down -1.8% yoy to USD 10.9B
- Trade surplus rose 19.4% to USD 31.8B
With US from January to October
- Total trade rose 11.8% yoy to USD 526.1B
- Exports to US rose 13.1% yoy to USD 392.1B
- Imports from US rose 8.2% yoy to USD 134.0B
- Total trade surplus rose 15.8% yoy to USD 258.1B
EURUSD Trading Back Under Key Support
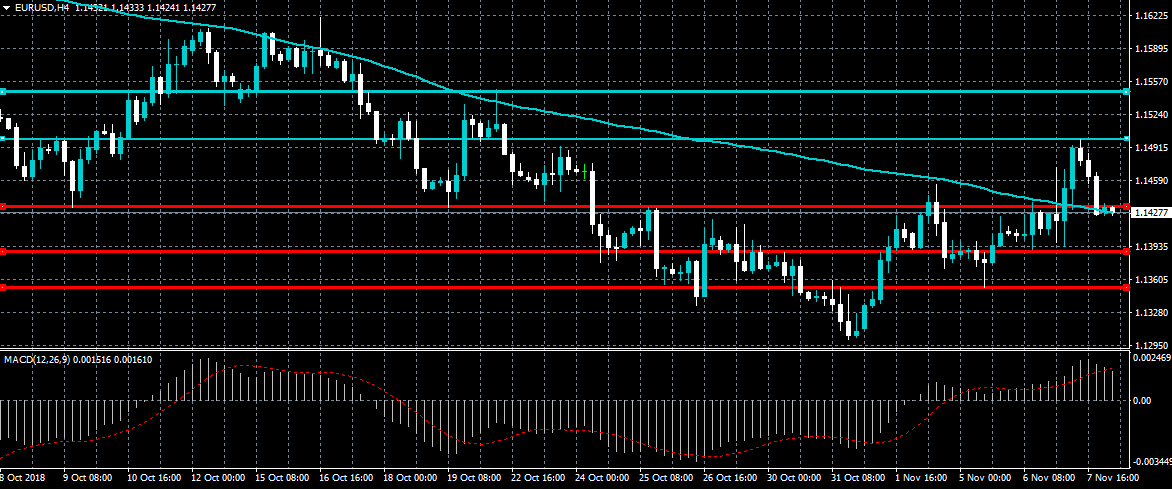
The euro is now trading below the key 1.1431 level against the US dollar, following a strong technical rejection from the 1.1500 resistance level. The EURUSD pair is intraday bearish while trading above the 1.1431 level and could form a bearish head and shoulders pattern if the decline continues. Buyers need to move price back above the 1.1452 level to stabilize the EURUSD.
The EURUSD pair is intraday bearish while trading below the 1.1431 level, key support is found at the 1.1387 and 1.1352 levels.
If the EURUSD pair moves above the 1.1431 level, buyers are likely to test towards the 1.1452 and 1.1500 resistance levels.
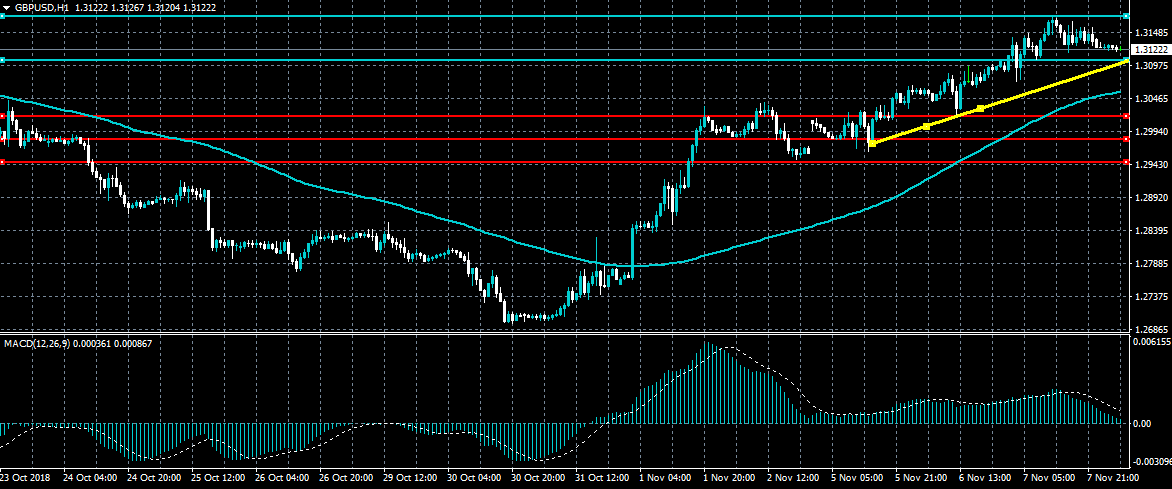
GBPUSD Only Intraday Bullish Above 1.3100
The British pound is moving back towards the 1.3100 support level against the US dollar, after peaking at the 1.3170 level on Wednesday. The GBPUSD pair remains vulnerable to further declines below the 1.3100 support level, with a breach of trendline support likely to promote technical selling. Buyers need to stabilize price above the 1.3100 level to build momentum for another attempt at the 1.3200 level.
The GBPUSD pair is only bullish while trading above the 1.3100 level, key resistance is now found at the 1.3170 and 1.3200 levels.
If the GBPUSD pair moves below the 1.3100 level, key support is found at the 1.3055 and 1.3022 levels.
USDJPY Bulls Still Alive As It Extends Gains To One-Month High
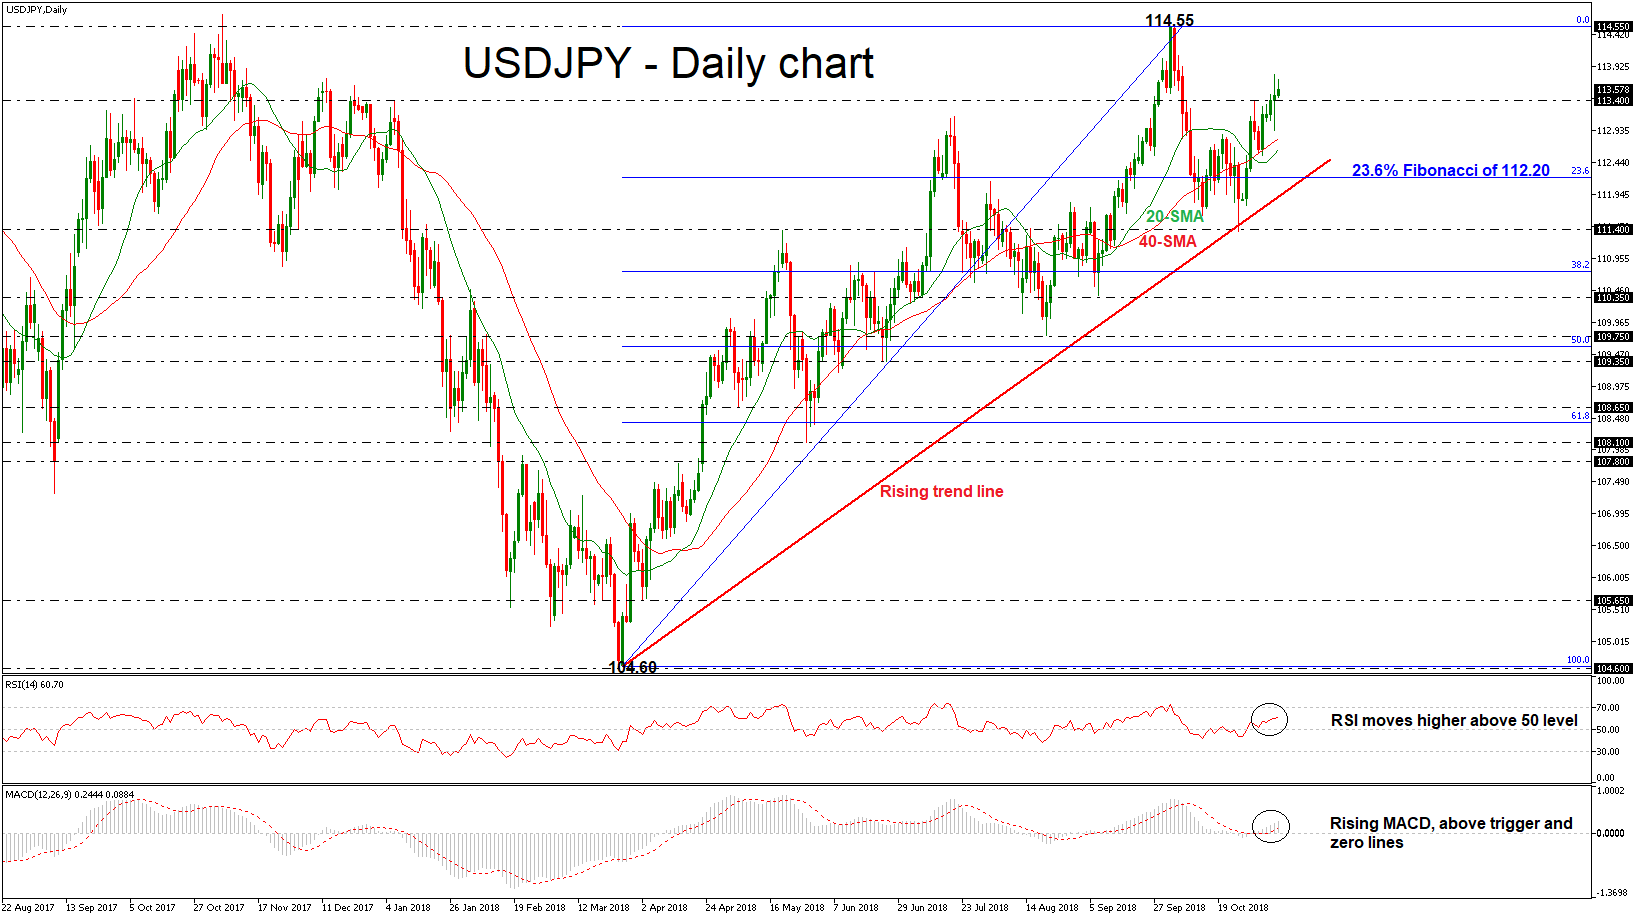
USDJPY continues to rise above the 113.40 key level and is set to complete the fifth bullish day in a row today, stretching its upward tendency to a fresh high.
According to the MACD oscillator, positive momentum could push for further gains in the short-term as the indicator picks up steam above its trigger line. The RSI is also advancing in the positive territory. The 20- and 40-simple moving averages (SMAs) are sloping up, following the price action.
In the positive scenario, where the price continues to expand above yesterday’s one-month high of 113.81, the pair could jump towards the 114.55 resistance level, achieved on October 3. If the market manages to overcome that area, traders could look for resistance at the 115.50 barrier, taken from the peak on March 2017.
A reversal to the downside could stall at the 40- and then at the 20-SMAs, which hover near the 112.80 and the 112.62 levels respectively. Further below, the 23.6% Fibonacci retracement level of the upleg from 104.60 to 114.55, around 112.20, could also provide support. Any violation below this point could potentially trigger a sell-off in the market, probably leading below the long-term ascending trend line until the 111.40 support barrier.
Regarding the long-term picture, the bullish outlook has built up as USDJPY retains bullish tendency, above the rising trend line, which has been standing since March 26; a dive below this line could shift the sentiment into a neutral and then to a bearish one.
EUR/USD Bullish ABC Zigzag Above 1.13 Support
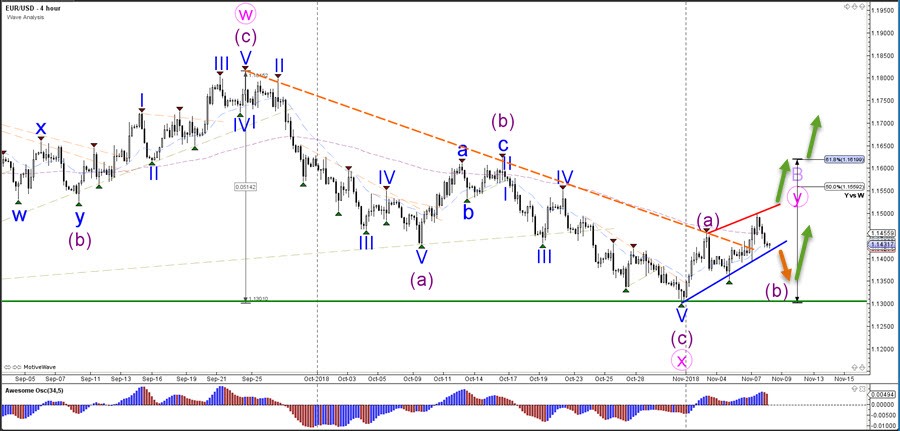
The EUR/USD bullish breakout above the channel could confirm a potential wave C (or wave 3) towards the Fibonacci levels of wave Y vs W. A break below the channel could see price challenge the bottom but a bounce would confirm the wave B (purple).
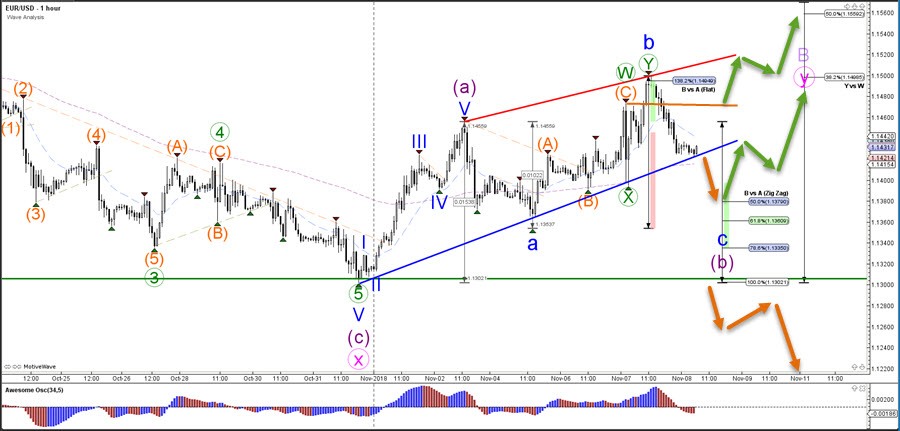
The EUR/USD hasprobably completed a wave B (blue) unless price manages to break above resistance (orange). A bearish break would indicate a retest of the Fibonacci retracement levels of wave B vs A, whichcould act as a potential support.
Risk Assets Boosted By Divided Congress, Dollar Awaits Fed Meeting
Asian stocks followed Wall Street higher after U.S. mid-term elections produced a divided Congress on Wednesday. All major U.S. indices climbed more than 2% yesterday, with the Healthcare and Technology sectors leading the rally. Although a divided Congress will make it tougher for President Trump to pass new bills over the next two years, the market’s initial reaction suggests that investors do not expect any reversal of previously enacted legislation. However, there’s still a high chance to get some middle-class tax cuts as Democrat opposition to themwill increase the probability of another four-year term for President Trump in 2020.
This explains why U.S. 10-year Treasury yields rallied after an initial decline of 8 basis points. Ten-year yields have returned to levels where the markets crashed in early October. However, the CBOE’s volatility index declined 17% yesterday in a sign that investors are less worried about the latest spike in interest rates. It will be very interesting to find out what levels ofthe 10-year bonds will scare the markets again, and I don’t think we are too far away from it. Breaking above 3.25% again will likely bring in some anxiety, but above 3.5% may leave many investors toconsider a heavy rotation from equities to fixed income.
The recovery in U.S. Treasury yields also helped the dollar bounce back after touching a 2.5 week low. The Dollar’s index fell to 95.68, but gradually appreciated throughout the day and is trading at 96.20 at the time of writing. Traders focus will now shift to the Federal Reserve which will conclude its two-day policy meeting. While no rates hikes are expected to take place today, the tone of the statement is what matters. Last week’s employment report showed the economy remained on a solid footing with jobs increasing by 250,000 and wage growth reaching a near decade high. However, the housing market started showing signs of cracks, consumer spending slowed, and business investment decelerated. So, expect the statement to reveal a more dovish than hawkish tilt.
In commodity markets, Oil came under pressure as rising U.S. production and inventories outweighed talks of OPEC production cuts. The Energy Information Administration reported that Oil production will surge towards 12 million barrels-per-day by mid next year. Meanwhile, crude and gasoline inventories rose more than expected in the week ending November 2. Although China’s October crude imports hit a record of 9.61 million barrels-per-day in October, this trend is not likely to continue given the latest signs of economic weakness. So expect to see more willingness from OPEC and friends to cut production again to keep prices supported above $70.