Sample Category Title
Equity Sell-Off Resumes In Asia
The steep sell-off in U.S. equity markets suggests October could be the worst month since the global financial crisis of 2008. Seven trillion dollars have already been wiped from the global market cap, and still there are no signs of bulls returning.
Chinese stocks fell today with the CSI 300 declining more than 3% while the Yuan remained trading near adecade low. The Nikkei 225 gave up gains of more than 1% to trade in negative territory. Moving against the trend were stocks in Australia, with the ASX 200 gaining more than 1% supported by the healthcare and telecom sectors.
The bears seem well in control of the market and there’re many reasons to justify their actions. Whether it’s weakening global economic growth, the ongoing U.S.-China trade war, monetary policy tightening, fears of a hard Brexit, Italy’s budget woes…and the list goes on. What is more interesting is that investors are even punishing companies that have reported positive earnings surprises.
To date, almost half of S&P 500 companies have announced earnings results for Q3. Out of 241 companies, 77% managed to beat on EPS, and 59% beat on sales according to FactSet. Companies that have reported positive earnings surprises saw their stocks declining 1.5% on average two days before the earnings release through two days after the announcement. So, earnings do not seem to be a key reason for the market sell-off despite some big names like Amazon and Alphabet disappointinginvestors.
In fact, valuations are becoming attractive followinga10% plunge in the S&P 500. Forward P/E ratio is currently standing at 15.5 compared to the 5-year average of 16.4. That’s the time when investors should consider buying companies with strong fundamentals. This is especially the case when economic data is still supporting. Friday’s data showed the U.S. economy expanded 3.5% in Q3 after 4.2% growth in the previous quarter mainly driven by consumer spending.
So far, it seems more of a market correction than signs of a recession. However, if leading economic indicators begin pointing south while the Federal Reserve keeps raising interest rates, the stocks correction may become a bear market. Inflationary pressures are the biggest risk to preventing the Fed from slowing the tightening cycle. That’s why investors need to keep a close eye on Friday’s U.S. wage growth figure.
Dollar Index Rises Ahead Of A Busy Market Week
The US dollar index rose slightly during the Asian session following US economic data released on Friday last week. Data showed that the US economy expanded by 3.5% in the third quarter. This was higher than the 3.3% that traders were expecting but lower than the second quarter’s 4.2%. The growth in the economy was mostly attributed to the increase in consumer spending which was facilitated by lower unemployment rates and higher wages.
The price of crude oil rose slightly in the Asian session. On Friday, Baker Hughes released the oil rig data that showed an increase in oil rigs by three. This was the third week of straight increases. The rig counts have been on an upward trajectory since June 2015 when the price of crude oil was still low. However, the price faces major challenges this week as investors worry about supplies.
The euro rose slightly in the Asian session. This was even after Angela Merkel’s coalition government continued to face increased political tensions. On Sunday, a regional election in Hesse saw the coalition parties lose. The Christian democrats lost 10 points while the Social democrats suffered the worst defeat ever. This means that Merkel’s chances of serving a full term have reduced sharply. In addition, on Friday, S&P cut Italy’s outlook to negative and affirmed its credit rating.
EUR/USD
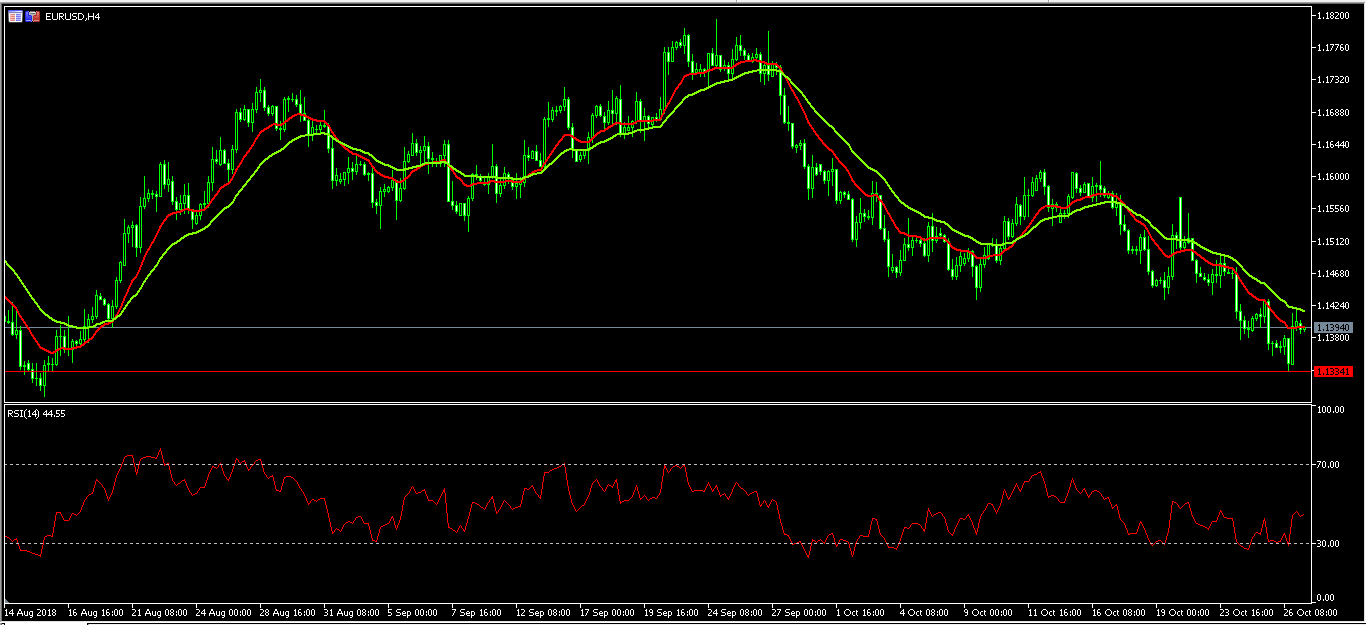
The EUR/USD pair rose slightly today after reaching a low of 1.1335 on Friday. The movement in price today is important because last week, the pair had almost touched the important level of 1.1300. On the four-hour chart, the current price is along the 14-day moving average but lower than the 28-day EMA. The RSI has moved from 30 to the current 44. The pair will likely move up as shorts exit their previous trades at a profit. However, the movement will still depend on the ADP employment data on Wednesday.
GBP/USD
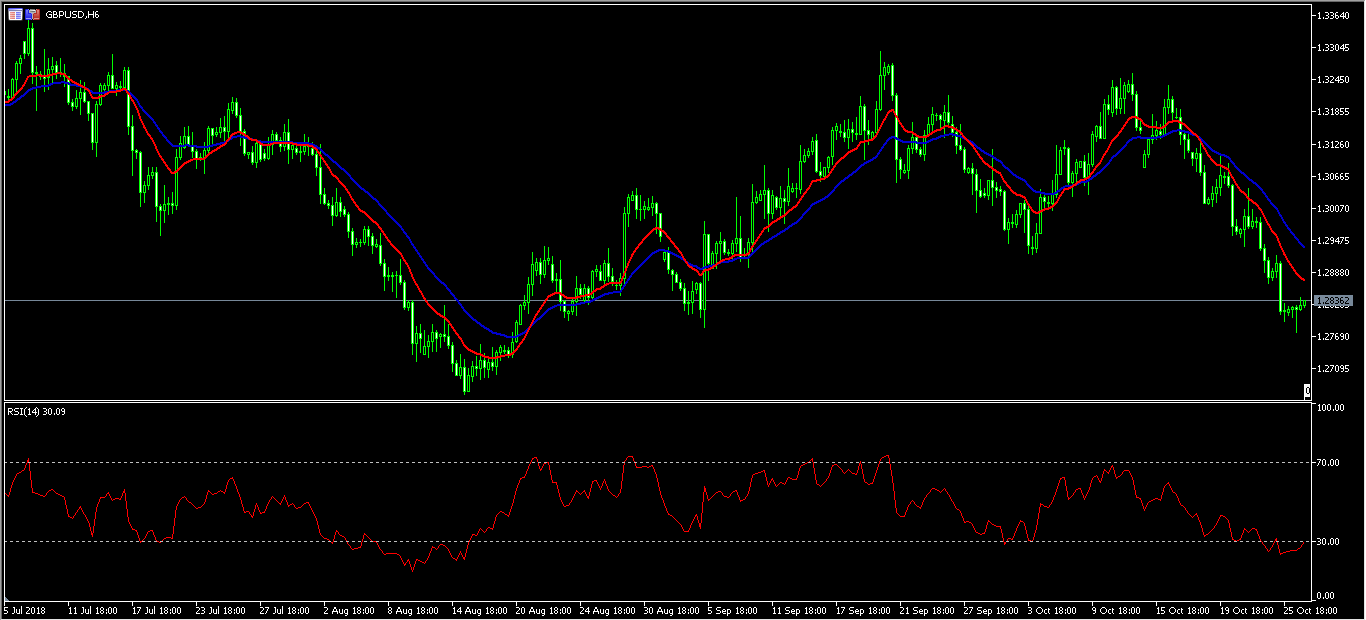
The GBP/USD pair halted the decline started on October 16. The pair is now trading at 1.2833, which is close to the lowest level since September 6. The pair’s price is below the 14 and 21-day EMA. The double EMA shows that the pair has more downward room to run. The RSI is currently at 29, which is a further proof of the downward momentum. Therefore, the pair could drop to the 1.2800 level. However, the decline will also depend on the decision by the Bank of England on Thursday.
XBR/USD
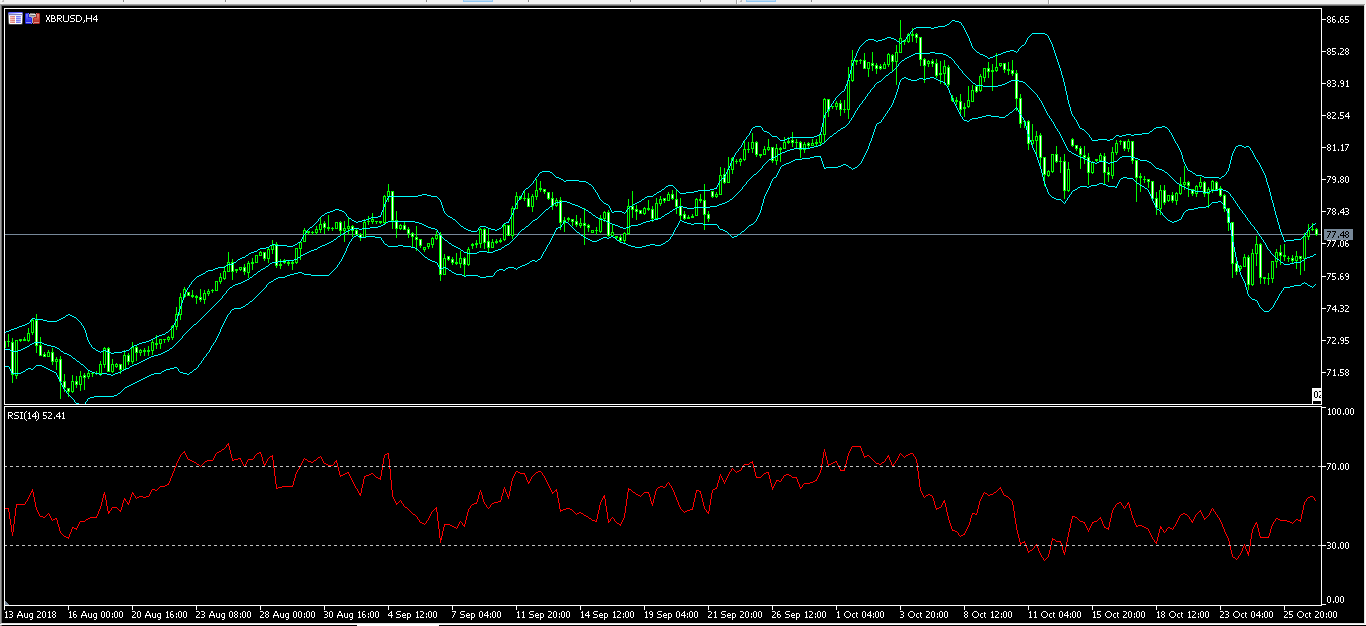
The XBR/USD pair halted the recent declines and rose to an intraday high of 77.93. This was the highest level since October 23. The price is also along the upper band of the Bollinger Bands while the RSI is at 52. While the pair could continue to rise, there is a likelihood that it will continue the downward trend. If it does, it will continue until it reaches a low of 70.
GBP/JPY Daily Outlook
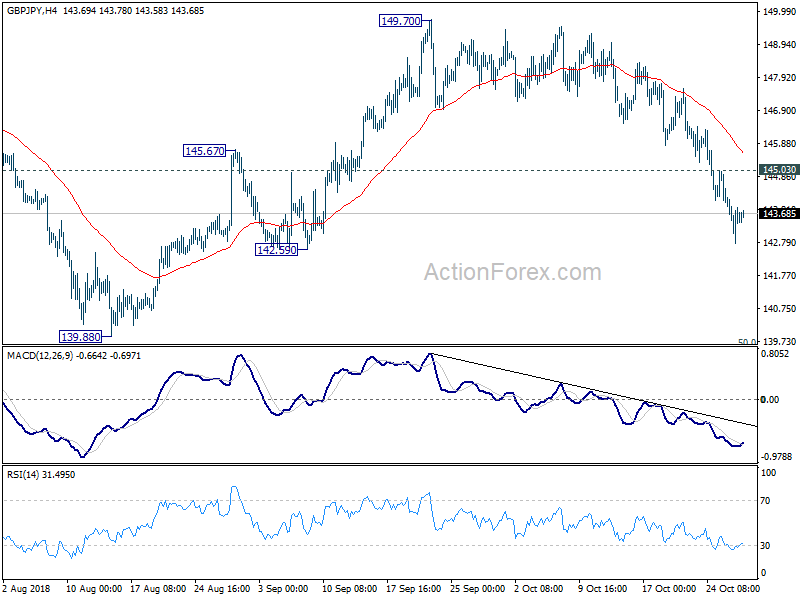
Daily Pivots: (S1) 142.81; (P) 143.51; (R1) 144.24; More...
Intraday bias in GBP/JPY remains on the downside at this point. Current fall from 149.70 is in progress for retesting 139.88 low. On the upside, above 145.03 will turn intraday bias neutral and bring consolidation first, before staging another decline.
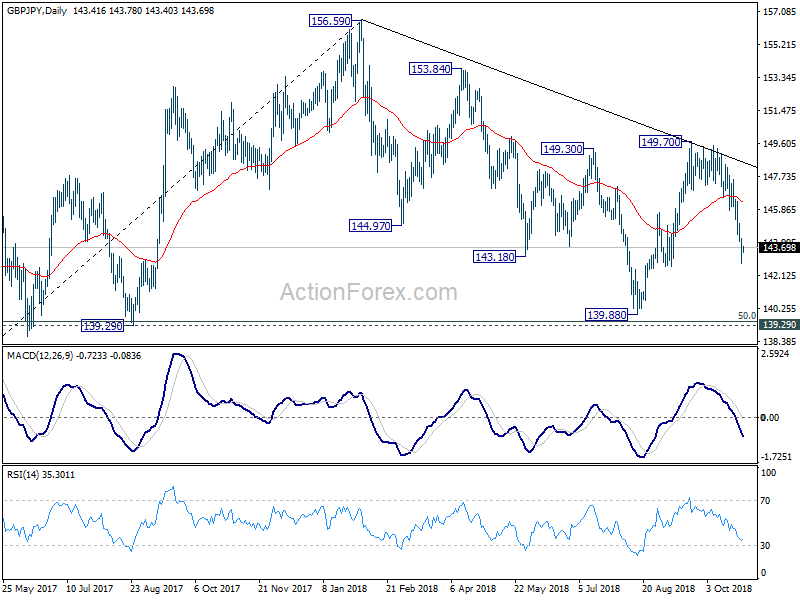
In the bigger picture, as long as 139.29 cluster support (50% retracement of 122.36 to 156.59 at 139.47) holds, up trend from 122.36 (2016 low) would still extend beyond 156.69 high. However, decisive break of 139.29/47 will suggest that such up trend is completed and turn outlook bearish. In that case, next target is 61.8% retracement at 135.43.
EURUSD May Test 1.1431 Level
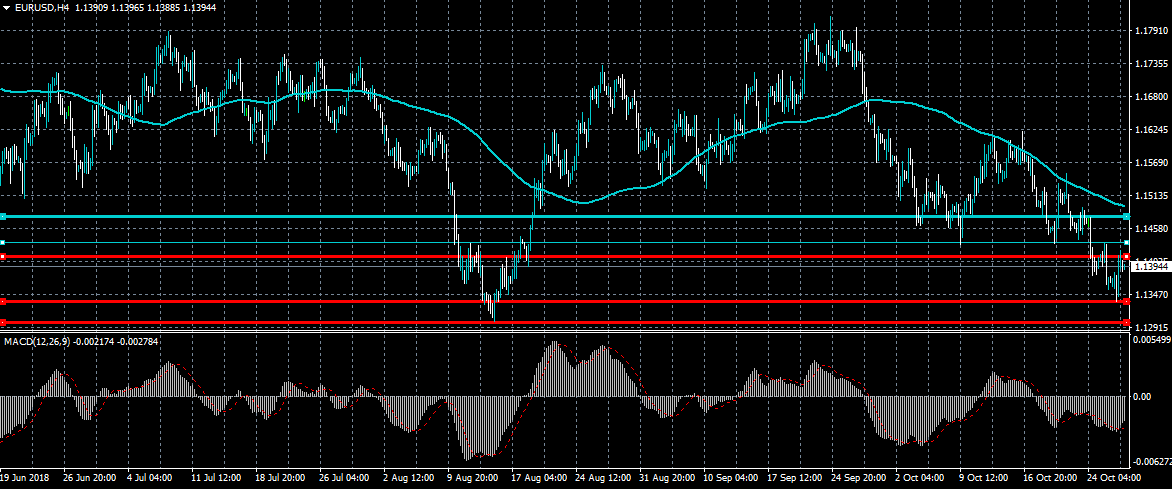
The euro currency is testing towards the 1.1400 resistance level against the US dollar after sellers failed to break below the key 1.1300 level on Friday. Indicators are now starting to turning higher, hinting that the EURUSD pair may once again test toward the 1.1431 resistance level. Sellers need to break the 1.1340 level while buyers need to move price above the 1.1400 level to build bullish momentum.
The EURUSD pair is strongly bearish while trading below the 1.1400 level, key technical support is found at the 1.1340 and 1.1300 levels.
If the EURUSD pair moves above the 1.1400 level, key intraday resistance is found at the 1.1431 and 1.1480 levels.
USDJPY Intraday Bearish Below Trendline
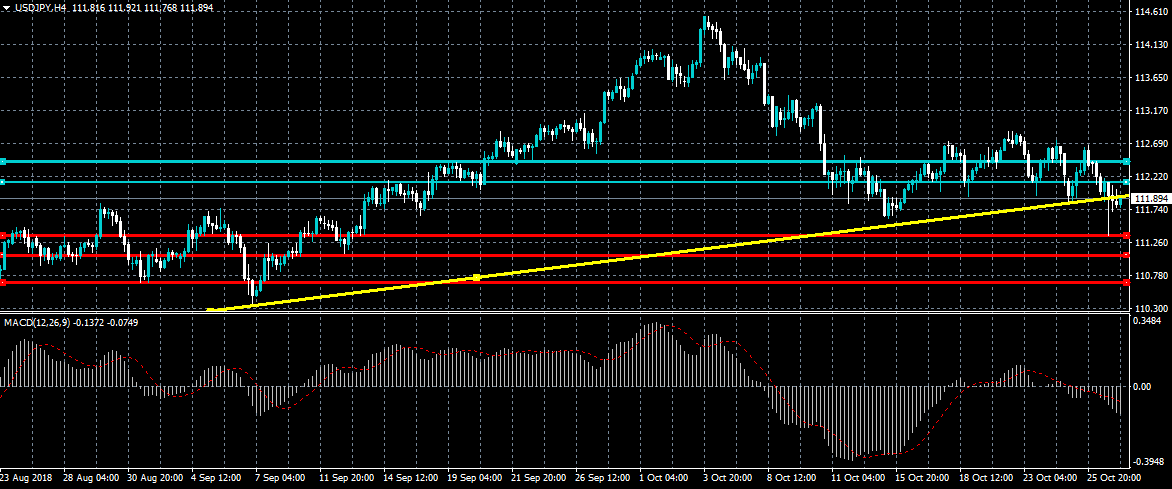
The US dollar is attempting to correct higher against the Japanese yen currency in early Monday trade after falling below trendline support. The USDJPY pair fell towards the 111.35 level after the key trendline break and remains intraday bearish while trading below the 112.00 level. Traders now look to the release of Core PCE data from the US economy later today, which is the Federal Reserve’s preferred measure of inflation.
The USDJPY pair is strongly bearish while trading below the 112.00 level, key support is now found at the 111.35 and 110.90 levels.
If the USDJPY pair trades above the 112.00 level, buyers will likely test the 112.18 and 112.45 resistance levels.
Bitcoin Price Little Moved After A New Exchange Hack
Having been the biggest crypto exchange in the world handling around 70% of all Bitcoin-related transactions at its peak, Mt. Gox closed in February 2014 following a hack. In total, more than 850,000 Bitcoins were stolen which were valued at over $450 million. Following today’s exchange rates, the Bitcoins wiped from the exchange would have been worth more than $5 billion.
Since then, the crypto industry has seen many changes with crypto exchanges increasing in number. At the same time, hacking attempts have also increased. A recent approximation showed that cryptocurrencies worth more than $750 million have been stolen this year.
The latest occurred over the weekend. A small crypto exchange from Canada announced through social media that all of its Bitcoins had been stolen. It made the announcement and then deleted its social media platforms and its website, leaving customers in the dark. However, a close investigation of MapleChange reveal that this was the company’s exit strategy. Firstly, if it was a real hack, the company would not have deleted its social media accounts. Secondly, a closer look at the company’s domain registration shows that the owners were likely fraudulent. Security issues are why large institutional investors fear investing in digital assets.
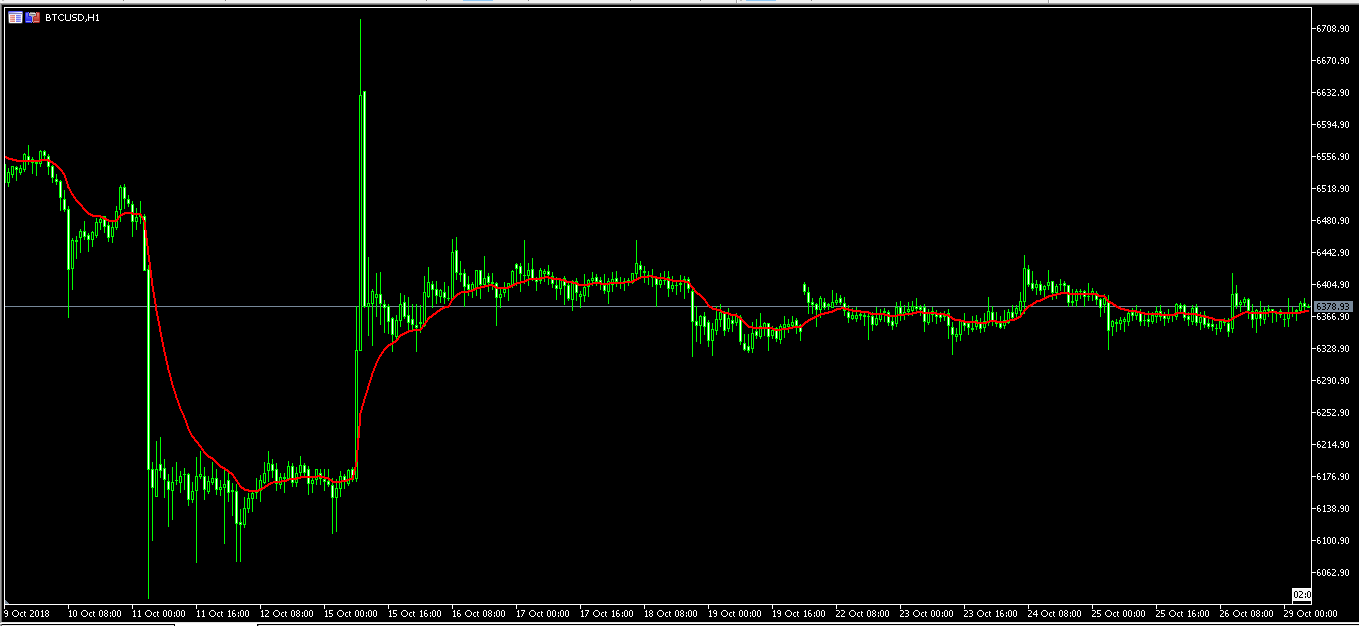
The BTC/USD pair remained unchanged in the Asian session. In fact, the price has not seen any major changes since October 15. This consolidation is an indicator that the pair will likely see a breakout in the near future.
EUR/JPY Daily Outlook
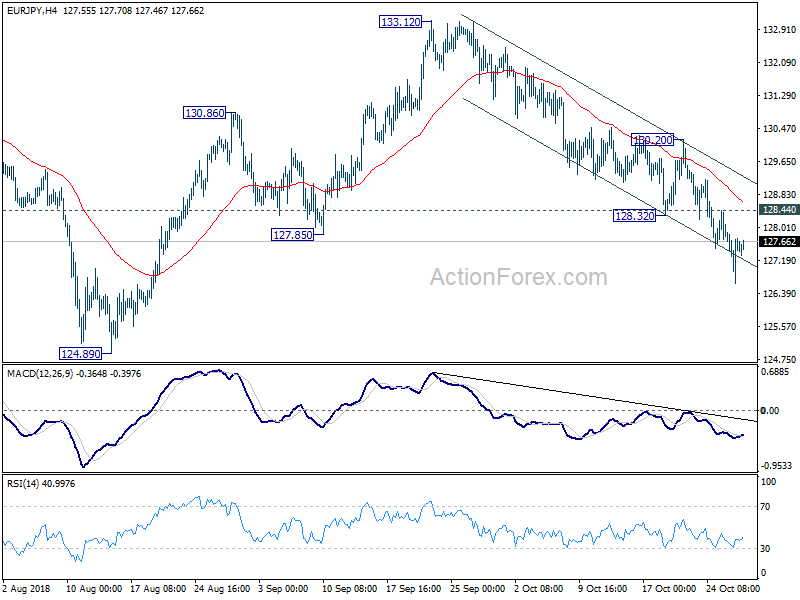
Daily Pivots: (S1) 126.83; (P) 127.38; (R1) 128.12; More....
Intraday bias in EUR/JPY remains on the downside at this point. Fall from 133.12 is in progress for retesting 124.89 low. On the upside, above 128.44 minor resistance will turn intraday bias neutral first. But break of 130.20 resistance is needed to indicate completion of the fall from 133.12. Otherwise, near term outlook will now be mildly bearish even in case of recovery.
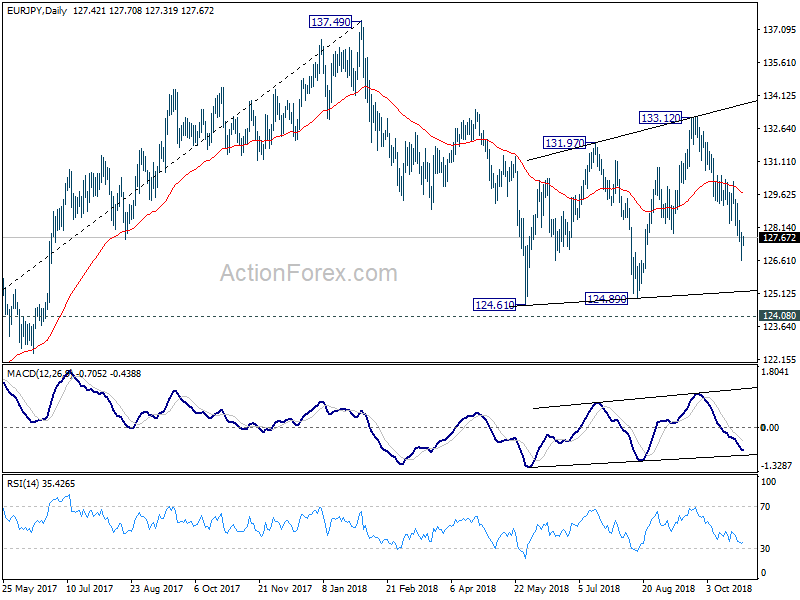
In the bigger picture, as long as 124.08 key resistance turn supported holds, larger up trend from 109.03 (2016 low) is still in progress. Firm break of 137.49 structural resistance will target 141.04/149.76 resistance zone next. However, decisive break of 124.08 will argue that such rise from 109.03 has completed and turn outlook bearish. In that case, deeper fall would be seen to 61.8% retracement of 109.03 to 137.49 at 119.90.
EUR/GBP Daily Outlook
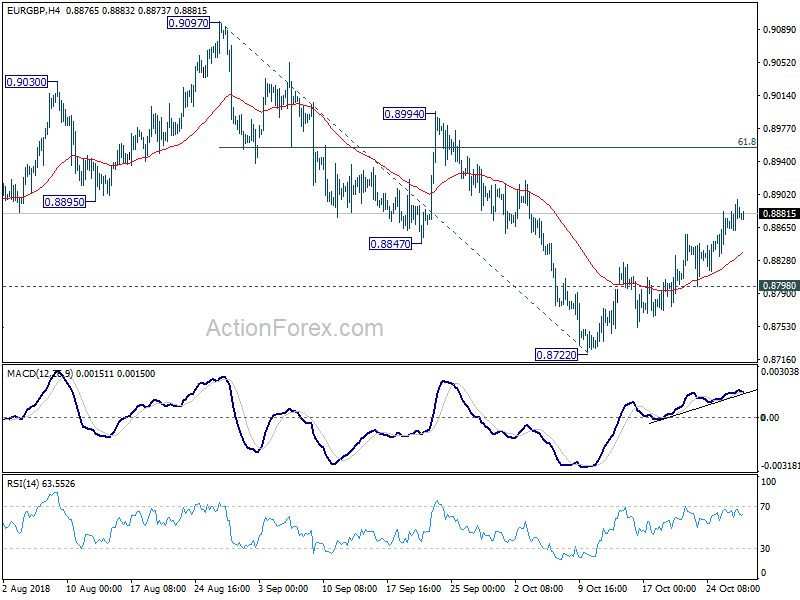
Daily Pivots: (S1) 0.8865; (P) 0.8883; (R1) 0.8903; More...
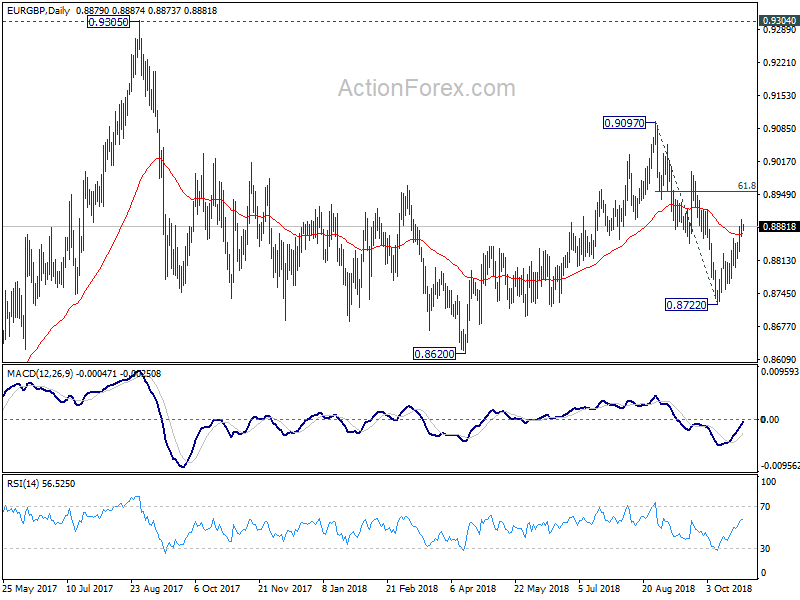
Intraday bias in EUR/GBP remains on the upside for the moment. Corrective rebound from 0.8722 is still in progress for 61.8% retracement of 0.9097 to 0.8722 at 0.8954 and above. On the downside, break of 0.8798 minor support will turn bias back to the downside for 0.8722 and possibly below.
In the bigger picture, EUR/GBP is seen as staying in long term range pattern started at 0.9304 (2016 high). On the downside, break of 0.8722 will extend the falling leg through 0.8620 support. On the upside, break of 0.9097 will target 0.9304 resistance instead.
EUR/AUD Daily Outlook
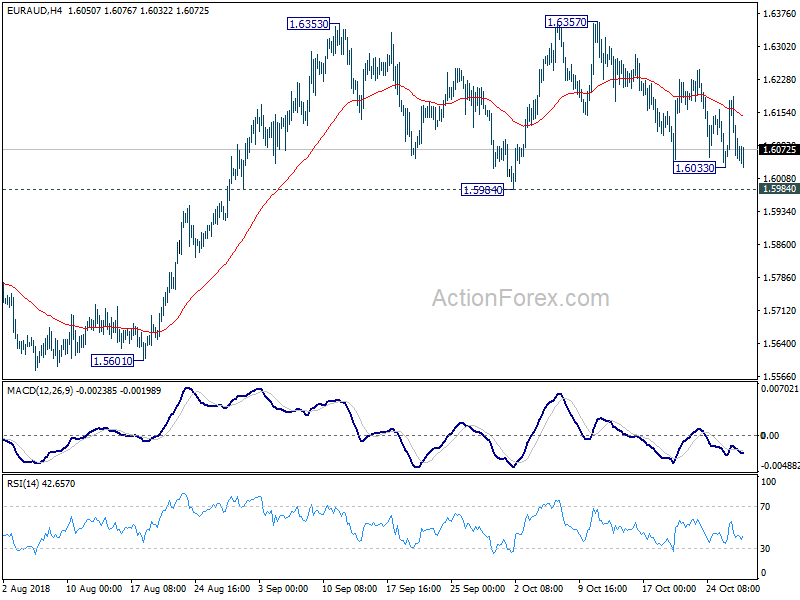
Daily Pivots: (S1) 1.6032; (P) 1.6111; (R1) 1.6170; More....
Intraday bias in EUR/AUD remains neutral as range trading continues inside 1.5984/6357. As long as 1.5984 support holds, further rise is still expected. On the upside, break of 1.6357 will resume larger up trend and target 1.6587 key resistance next. On the downside, however, break of 1.5984 will be an early sign of trend reversal and turn outlook bearish.
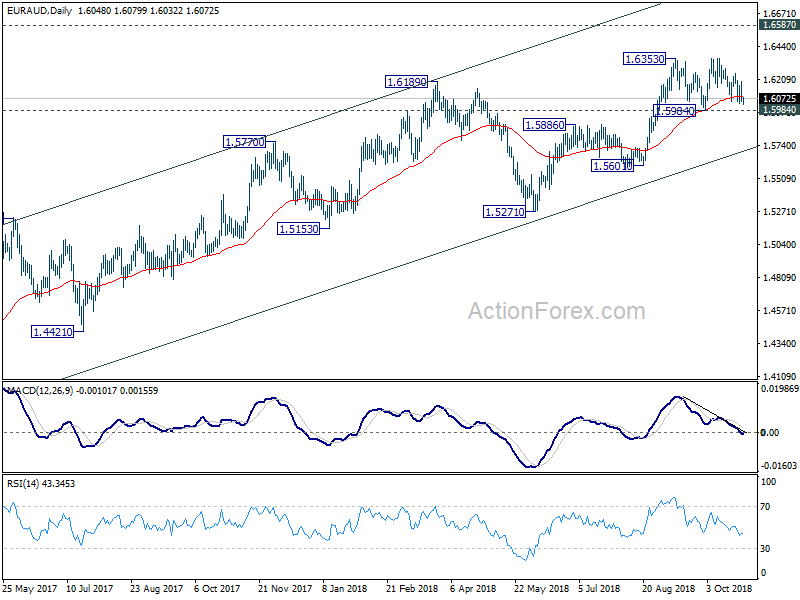
In the bigger picture, up trend from 1.3624 (2017 low) is still in progress. Further rise should be seen to retest 1.6587 (2015 high). Decisive break there will resume the long term rally and target 1.7488 fibonacci level. On the downside, break of 1.5984 support is need to be the first sign of medium term reversal. Otherwise, outlook will remain bullish in case of deep pull back. However, sustained break of 1.5984 will be an early sign of trend reversal and turn focus to 1.5601 support for confirmation.
EUR/CHF Daily Outlook
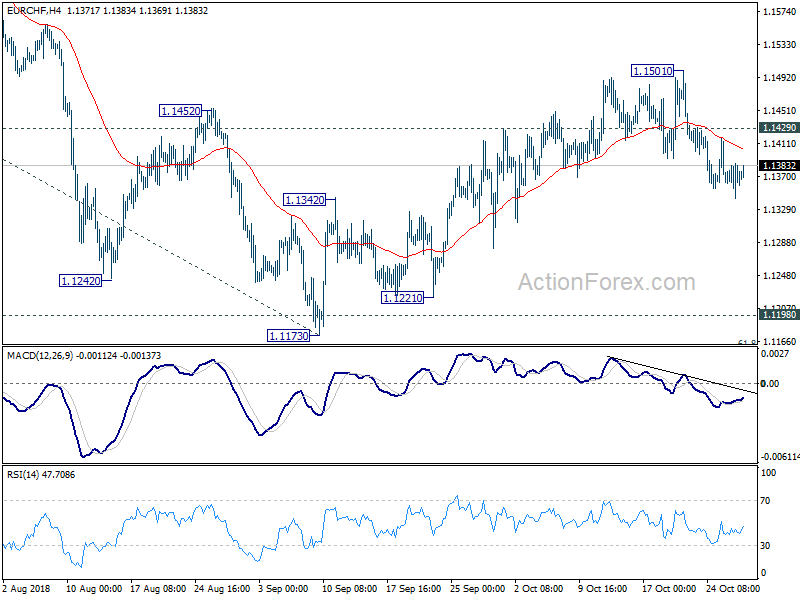
Daily Pivots: (S1) 1.1346; (P) 1.1367; (R1) 1.1390; More...
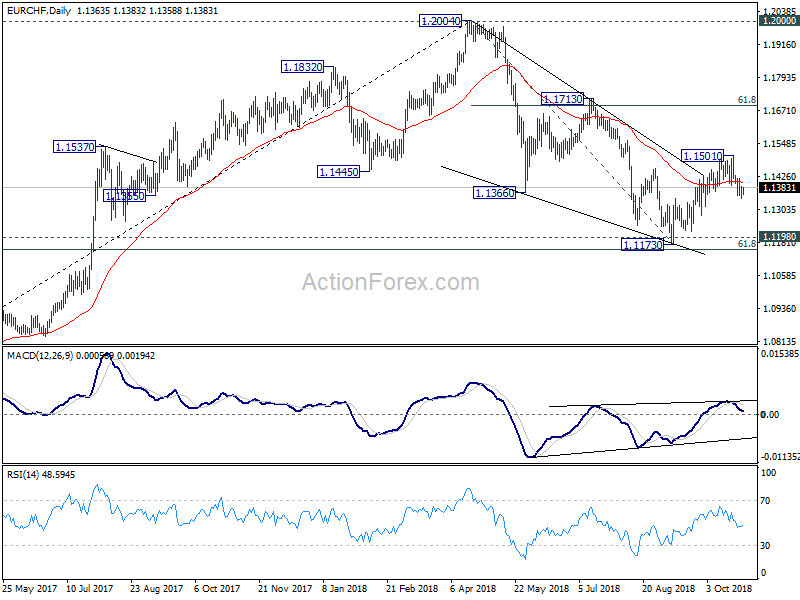
With 1.1429 minor resistance intact, deeper fall is expected in EUR/CHF. As noted before, corrective rise from 1.1173 could have completed at 1.1501 already. Further fall would be seen to back to 1.1154/98 key support zone again. At this point, we'd still expect this key support zone to hold. On the upside, above 1.1429 minor resistance will turn focus back to 1.1501 first. But still, break there is needed to confirm rally resumption. Otherwise, risk will stay on the downside even in case of strong recovery.
In the bigger picture, price actions from 1.2004 medium term top is seen as a correction only. Downside should be contained by support zone of 1.1198 (2016 high) and 61.8% retracement of 1.0629 to 1.2004 at 1.1154 to complete it and bring rebound. This cluster level is in proximity to long term channel support (now at 1.1243) too. A break of 1.2 key resistance is still expected in the medium term long term. However, sustained break of the mentioned support zone will mark reversal of the long term trend. In that case, 1.0629 key support will be back into focus.