Sample Category Title
The Analytical Overview Of The Main Currency Pairs
The EUR/USD currency pair
Technical indicators of the currency pair:
Prev Open: 1.14521
Open: 1.15163
% chg. over the last day: +0.54
Day's range: 1.15382 – 1.15502
52 wk range: 1.0571 – 1.2557
On Friday, the EUR/USD currency pair was showing a bullish sentiment. The USD is under pressure due to the report on existing home sales, which counted to 5.15M in September instead of the expected 5.30. Currently, the key support and resistance levels are 1.15100 and 1.15500 respectively. You should open positions from these levels. The investors are waiting for the ECB meeting on Thursday, October 25.
The economic news feed for the EU and US is calm today.
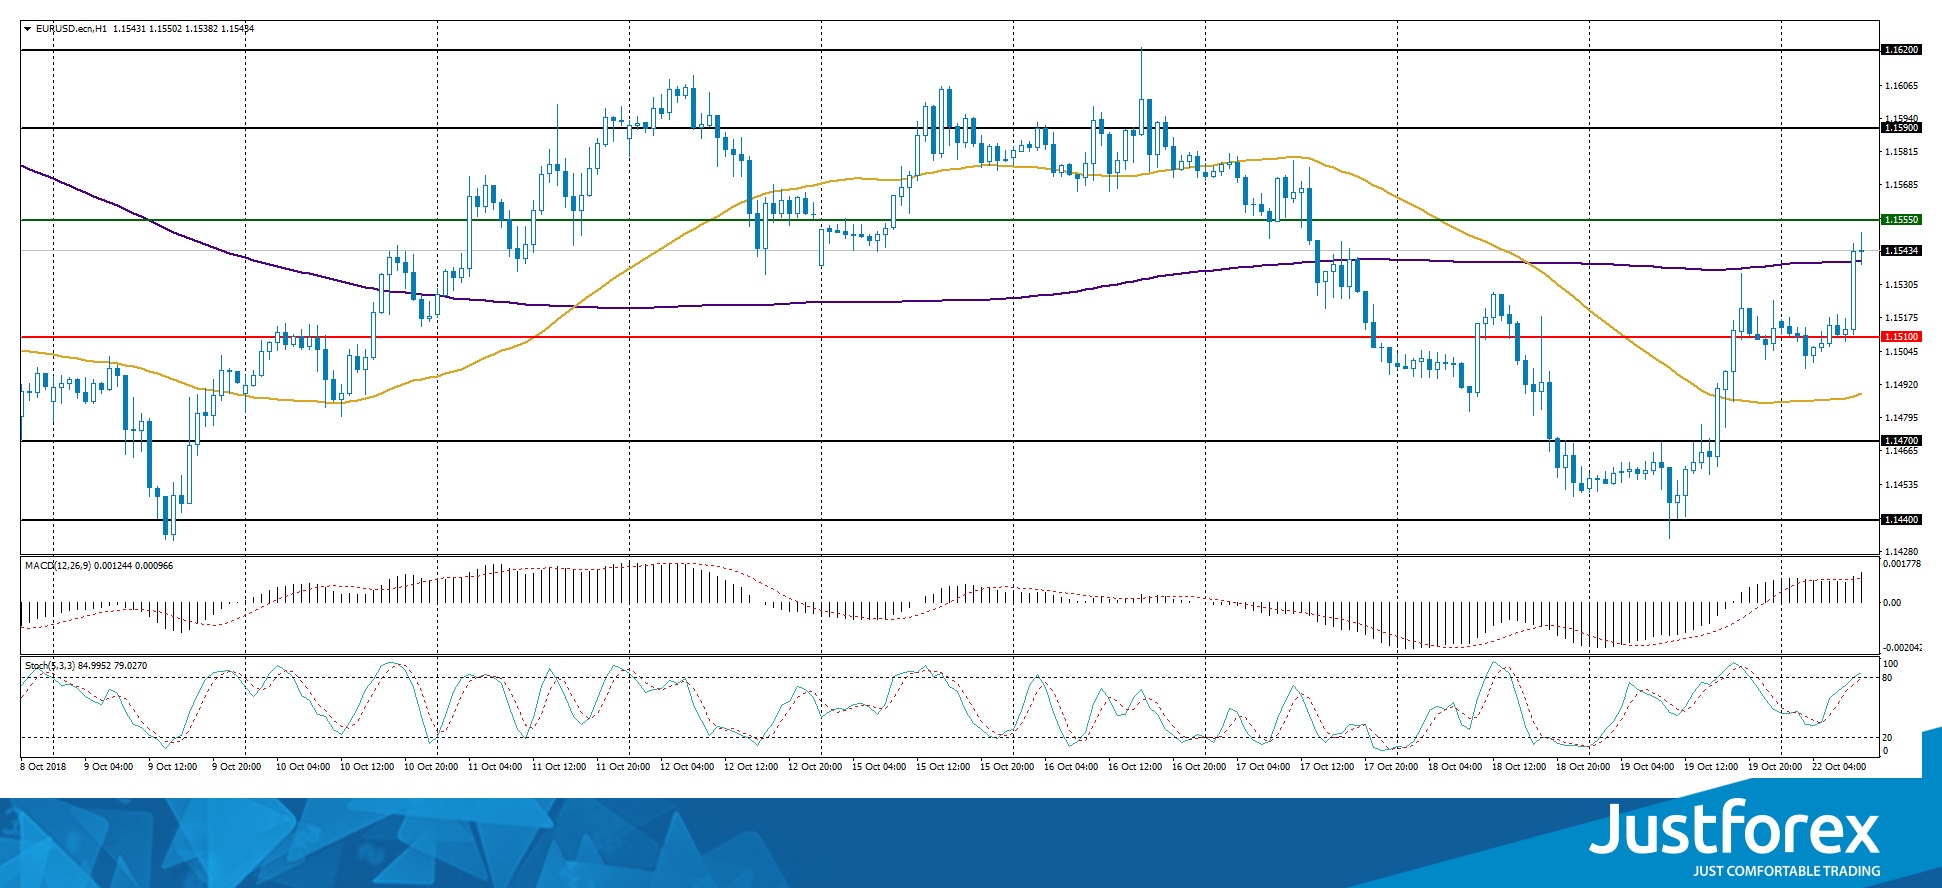
Indicators do not provide accurate signals: the price is over 200 МА.
The MACD histogram is in the positive zone, higher than the signal line, which gives a weak signal towards a purchase of the EUR/USD.
The Stochastic Oscillator is in the overbought zone, the %K line is higher than the %D line, which gives a weak signal towards a purchase of the EUR/USD.
Trading recommendations
Support levels: 1.15100, 1.14700, 1.4400
Resistance levels: 1.15550, 1.15900, 1.16200
If the price fixes above the support level of 1.15100, EUR/USD is expected to decline. The movement is tending to 1.14700-1.4400.
Alternatively, the EUR/USD currency pair can grow towards 1.15900-1.16200.
The GBP/USD currency pair
Technical indicators of the currency pair:
Prev Open: 1.30171
Open: 1.30660
% chg. over the last day: -0.74
Day's range: 11.30749 – 1.30860
52 wk range: 1.2361 – 1.4345
The GBP/USD started to recover. At the moment, the key support and resistance levels are 1.30500 and 1.31000 respectively. Positions should be opened from these levels. The investor's attention is focused on the Brexit issue. A technical correction is not excluded in the near future.
The news feed on the UK economy is calm.
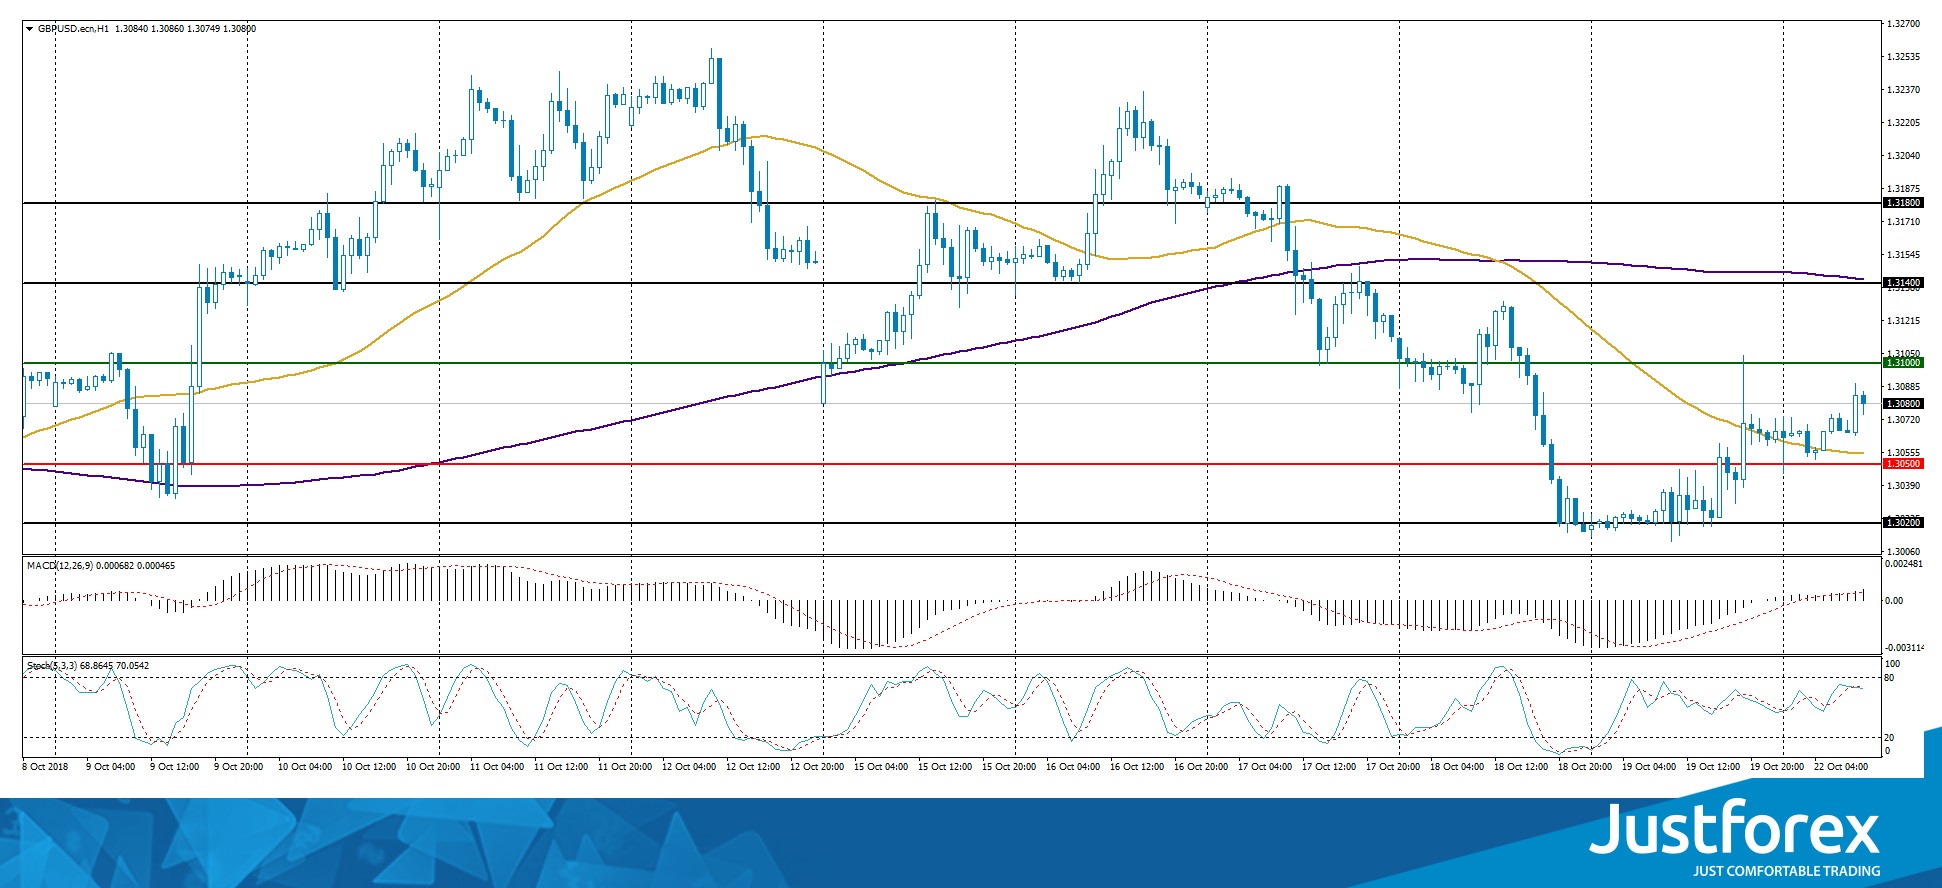
The price fixes between 50 MA and 200 MA, which represent dynamic levels of support and resistance.
The MACD histogram is in the positive zone, higher than the signal line, which gives a strong signal towards a purchase of GBP/USD.
The Stochastic Oscillator is in the neutral zone, the %K line is over the %D line. There are no precise signals.
Trading recommendations
Support levels: 1.30500, 1.30200
Resistance levels: 1.31000, 1.31400, 1.31800
If the price fixes above the support level of 1.30500, the GBP/USD quotes are expected to decline. The movement is tending to 1.30200-1.30000.
Alternatively, the currency pair may grow towards 1.31400-1.31600.
The USD/CAD currency pair
Technical indicators of the currency pair:
Prev Open: 1.30833
Open: 1.30894
% chg. over the last day: +0.10
Day's range: 1.30828 – 1.30845
52 wk range: 1.2059 – 1.3795
On Friday, the USD/CAD currency pair was showing an aggressive buyout. The Canadian dollar is weakened against the USD after a publication of the weak economic stats. For example, the core consumer price index lowered to 1.5% year-to-year in September. The core retail sales index lowered in September to -0.4%, while the experts predicted the growth up to 0.2%. At the moment, the technical data is highly ambiguous. The local support and resistance levels are 1.30700 and 1.31100 respectively. Positions should be opened from these levels.
The economic news feed for Canada is calm today.
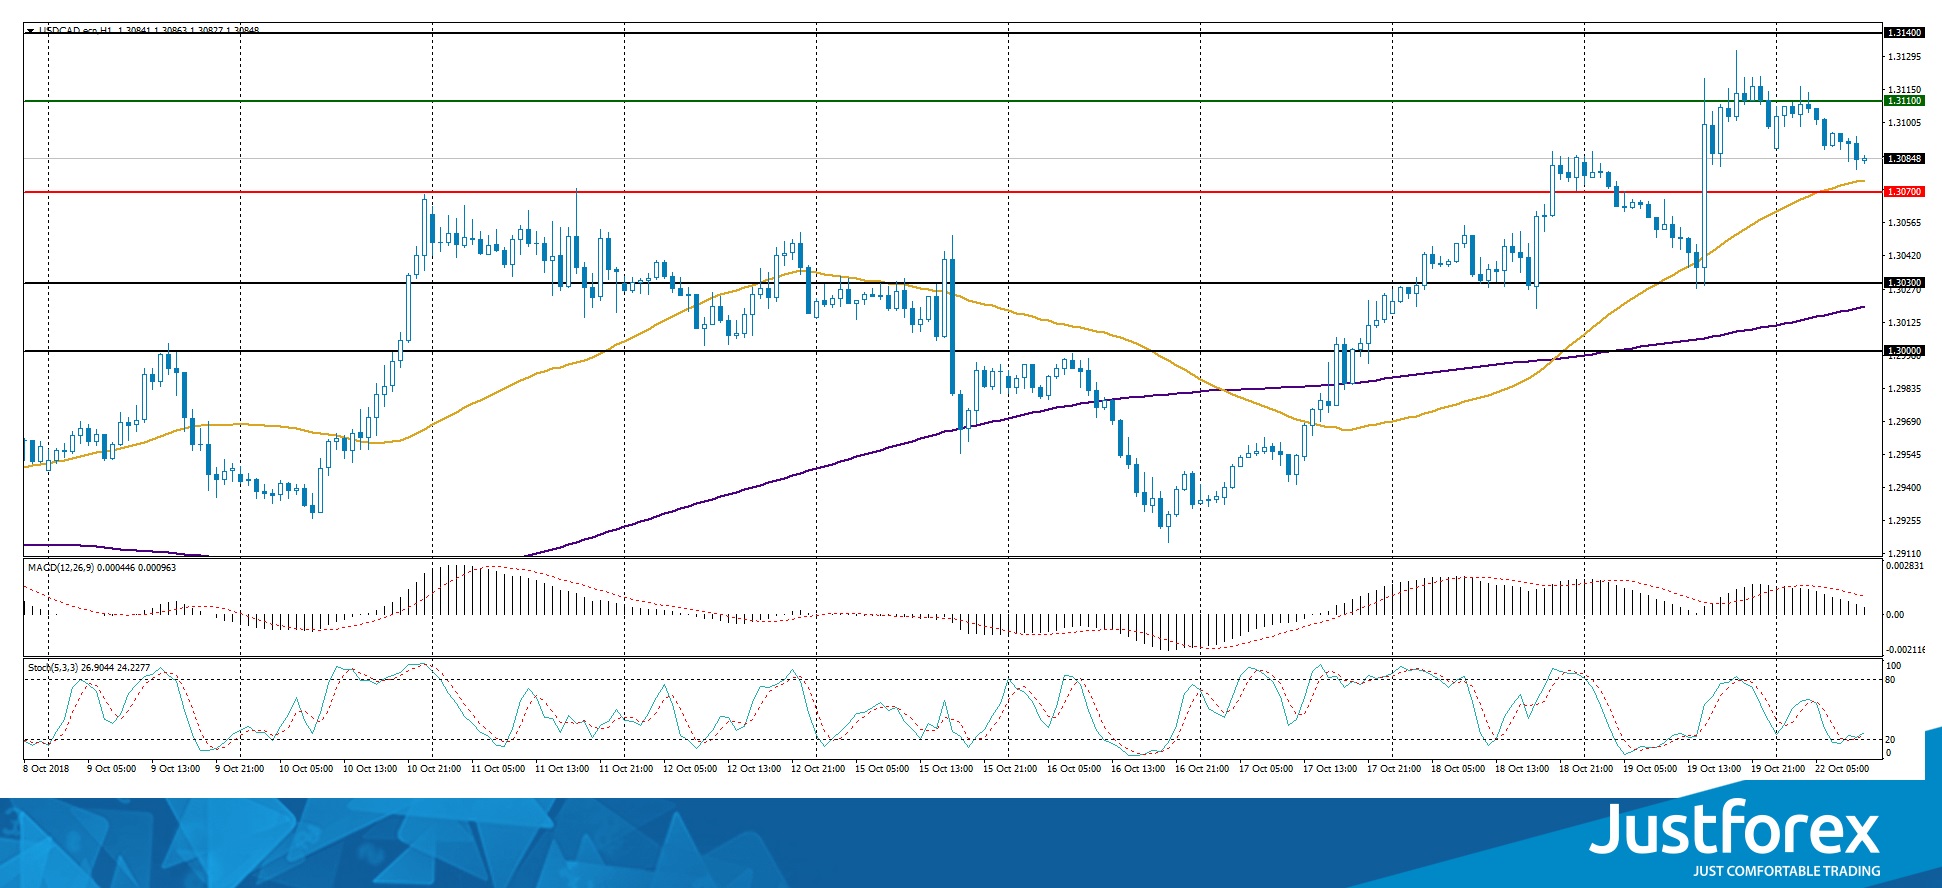
The price fixes between 50 MA and 200 MA, which represent dynamic levels of support and resistance.
The MACD histogram is in the positive zone, higher than the signal line, which gives a strong signal towards a purchase of GBP/USD.
The Stochastic Oscillator is in the neutral zone, the %K line is over the %D line. There are no precise signals.
Trading recommendations
Support levels: 1.30500, 1.30200
Resistance levels: 1.31000, 1.31400, 1.31800
If the price fixes above the support level of 1.30500, the GBP/USD quotes are expected to decline. The movement is tending to 1.30200-1.30000.
Alternatively, the currency pair may grow towards 1.31400-1.31600.
The USD/CAD currency pair
Technical indicators of the currency pair:
Prev Open: 1.30833
Open: 1.30894
% chg. over the last day: +0.10
Day's range: 1.30828 – 1.30845
52 wk range: 1.2059 – 1.3795
On Friday, the USD/CAD currency pair was showing an aggressive buyout. The Canadian dollar is weakened against the USD after a publication of the weak economic stats. For example, the core consumer price index lowered to 1.5% year-to-year in September. The core retail sales index lowered in September to -0.4%, while the experts predicted the growth up to 0.2%. At the moment, the technical data is highly ambiguous. The local support and resistance levels are 1.30700 and 1.31100 respectively. Positions should be opened from these levels.
The economic news feed for Canada is calm today.
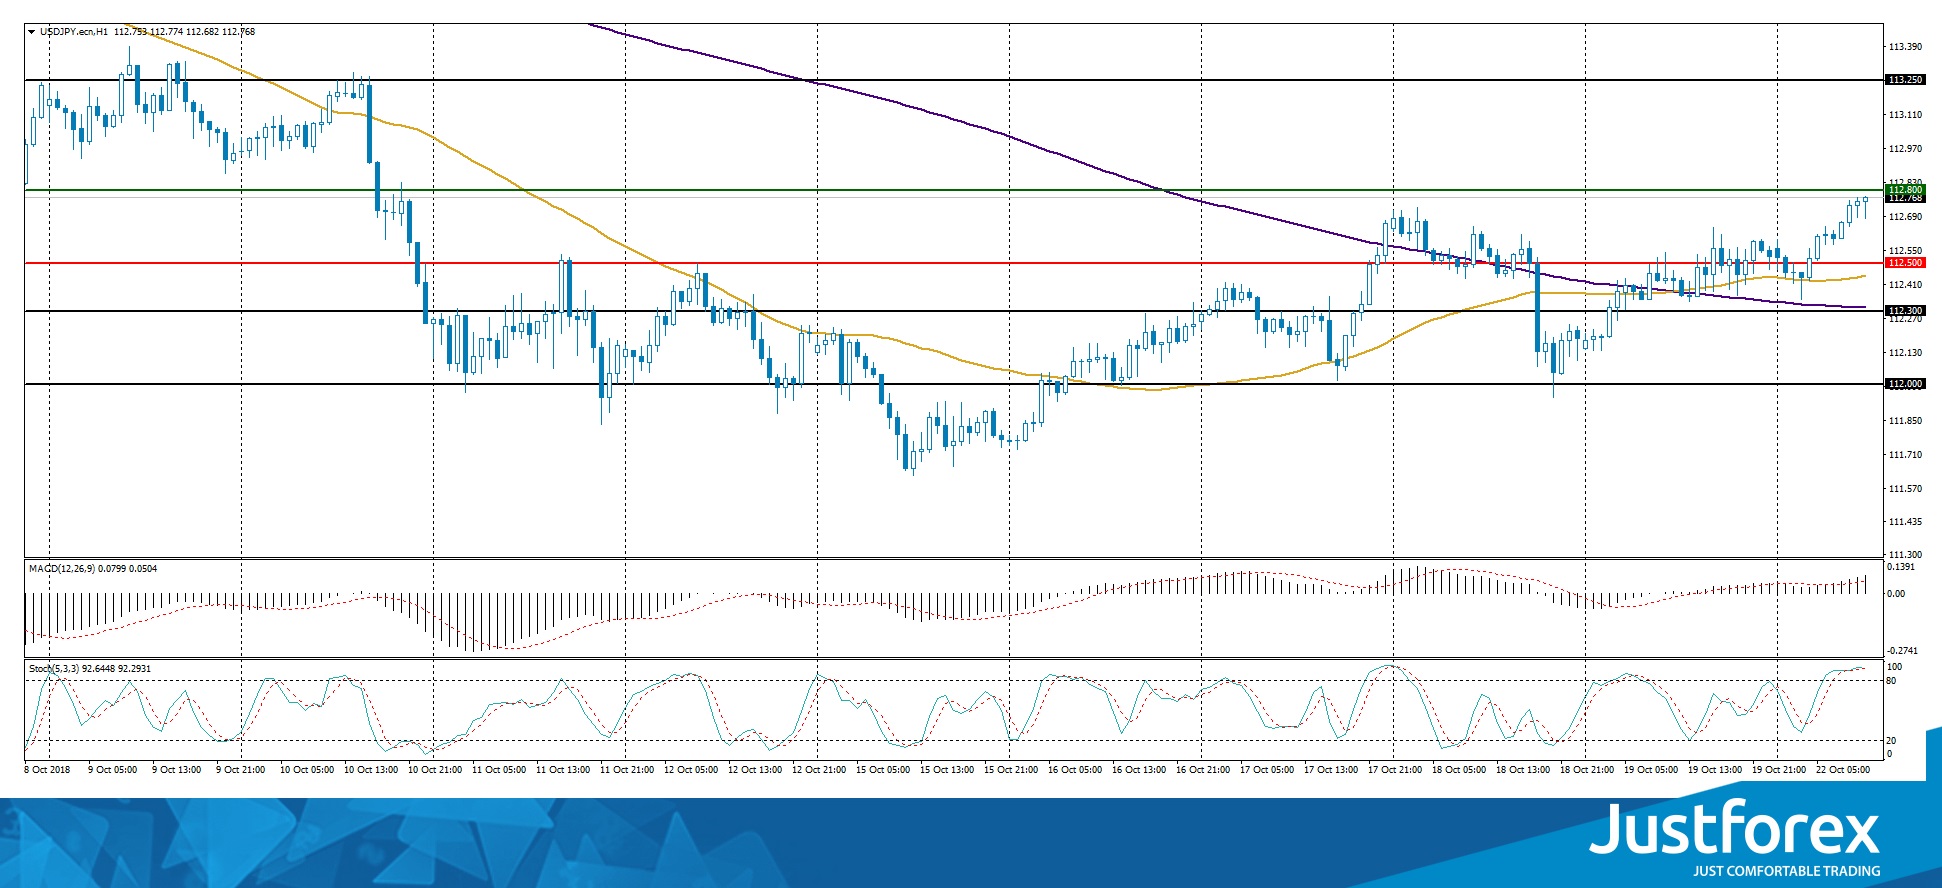
The indicators are showing the buyers' power: the price fixed above the 50 MA and 200 MA.
The MACD histogram is in the positive zone and higher than the signal line, which gives a strong signal towards the purchase of USD/JPY.
The Stochastic Oscillator is in the overbought zone, the %K line is over the %D line. There are no price signals.
Trading recommendations
Support levels: 112.500, 112.300, 112.000
Resistance levels: 112.800, 113.250
If the price fixes above the support level of 112.800, further growth of the USD/JPY quotes is expected. The movement is tending to 113.200-113.400.
Alternatively, if the price fixes below 112.500, we recommend looking for entry points to the market to open short positions. The movement is tending to 112.200-112.000.
European Investors Still Shy As Moddy’s Downgrades Italy
Italian equities rise despite Moody’s credit rating cut
On Monday morning, Italian equities surged across the board, with financials rising the most, while treasury yields fell to a 1-month low. Last Friday, Moody’s Investors Service cut the country credit rating to Baa3, one notch above junk, amid rising concerns over Italy’s eroding fiscal strength. However, the fact that the tone of the statement remained quite positive, together with constructive comments from EU’s Commissioner for Economic and Financial Affairs, Pierre Moscivici, helped to limit the sell-off. In addition, Luigi Di Maio said that his government was open to negotiations with the European Union. The 2-year BTP-Bund spread eased to 1.72%, down from 2.14% last Thursday.
In the FX market, the single currency reacted positively. EUR/USD rose 0.30% to 1.1550 before returning to 1.1530, which suggests that investors remain on their guard. Overall, the risk sentiment had improved somewhat but investors’ confidence remains fragile following two rough weeks, which have seen equity valuations melt like snow under the sun.
Chinese stocks make multi-year gains despite slowing economic growth
Despite a slowdown in economic growth, investors remain optimistic, pushing Chinese shares higher. The slowdown in 3Q GDP growth published last Friday at 6.50%, lowest since 2009 due to a decline in manufacturing activities, was followed by joint statements from Chinese regulators which are meant reassuring.
Indeed, while Shanghai CSI 300 had its largest intraday gain since January 2015 of 4.32%, the Hong Kong Hang Seng made a gain of +2.35%, marking its largest rise since mid-September 2018. The bounce is a welcome move on the marketplace, since Chinese shares have been declining harshly since the beginning of the year (year-to-date: CSI 300: -22.23%, Hang Seng: -12.50%) amid mounting trade tensions between China and the US and EM debt contagion risk.
However, although Chinese authorities remain worried about the economic outlook of China, announcements of supportive policies (incl. flexible credit granting) and tax cuts estimated at 1% of GDP starting next year have been confirmed. Therefore, according to recent announcement, it appears that Chinese authorities are expected to favor expansionary, growth-oriented policies rather than deleveraging.
For now, the main focus remains on Trump – Xi talks during G20 meeting, which was recently confirmed by both parties. Any positive (or negative) outcome could have a strong impact on the Renminbi. But at this time, it is expected that the PBoC maintains USD/CNY 7 mark as a key threshold. Today’s PBoC fixing remains at 6.9236.
Special Report: Gold Could Experience Mother Of All Short Covering
Anxieties around the trade war started to impact the sentiment and this triggered the profit warning by Wall Street analysts. On top of this, we also had the IMF coming out with a downward revision of the global economic growth
The precious metal, gold is back under the spotlight because of the renewed appetite amidst traders. This is primarily because of the rising geopolitical tensions and worries over the slowing global economic growth. The gold price has traded near a two-and-a-half month peak last week and the price is trading at $1,227 at the time of writing this report. Year to date, the price is down nearly 5.18%.
At the start of this year, the gold price was trading near the $1,350 and hit the highest point of $1,366 on January 25th, 2018. Not many on the street were expecting the Fed to be aggressive towards their monetary policy. However, the strength in the economic data and robust growth in the US economy made the Fed to fine-tune their monetary policy. The hawkish stance by the Fed towards their monetary policy pushed the dollar index higher and this triggered the sell-off in gold.
In other words, since January, the price of gold has been out of luck and we have seen one clear trend- a downward move. On August 16th, 2018, the yellow metal’s price made a low of $1,160 but since then we have seen some serious changes in the price action because of the change in the underlying fundamentals. Anxieties around the trade war started to impact the sentiment and this triggered the profit warning by Wall Street analysts. On top of this, we also had the IMF coming out with a downward revision of the global economic growth. The bearish sentiment since then has picked strength and more and more hedge fund analysts have started to believe that there are more chances for the markets to face serious correction than a bull run.
On top of this, heightened geopolitical tensions between Saudi Arabia and the West over the killing of journalist Jamal Khashoggi has put off traders to load up any major risk on bets in their portfolio. The situation is serious and this has brought the special relation between Donald Trump and Saudi Crown Prince Mohammed Bin Salman under the spotlight. These geopolitical tensions are further anchored when we look at the mess created by Theresa May over Brexit. Italian budget woes just add the cherry on top. Simply put, the geopolitical tensions have started to make investors seriously worried about their portfolios and if we factor in the growth concerns over in China in the same equation, it becomes clear why the speculators have started to scale back from their short positions.
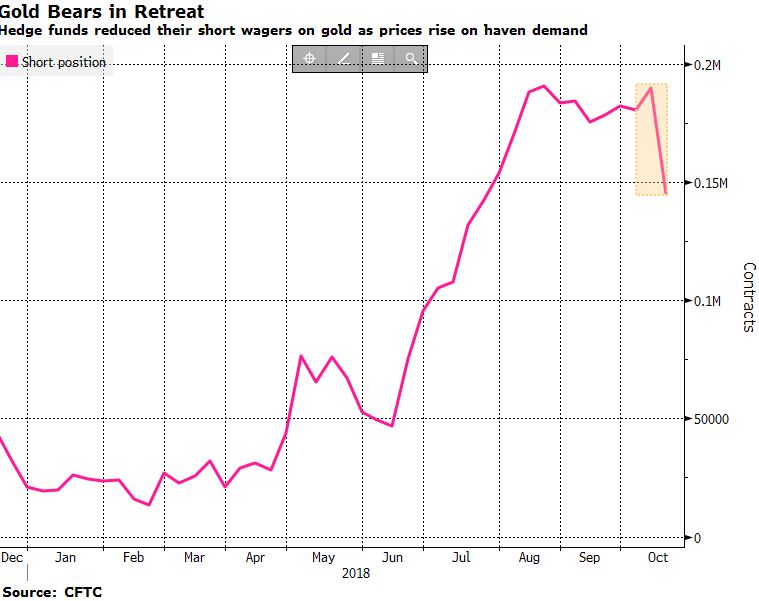
The recent CFTC data showed that hedge funds have decided that it is about time for them to start scaling back from their short position. This sends a strong bullish signal for the metal. This capitulation factor could actually intensify even further if the Fed has change of heart about their hawkish monetary policy. After all, Donald Trump has criticised the Fed several time about hiking the interest rate so many times this year. It is important to emphasize that back in 2015, when speculators had net long positions, it triggered a 30% move in the gold price. A similar move would help the price to move to $1,500.
Another interesting element which is equally important to mention here is that the gold price has been gaining traction while the dollar index maintained its strength. During the past few weeks, we have seen a positive correlation between the dollar index and the gold price. This shows that gold price has become immune to rise in the dollar index. This simply means if we see any kind of pullback in the dollar index, the odds are higher for a mammoth move in the gold price. 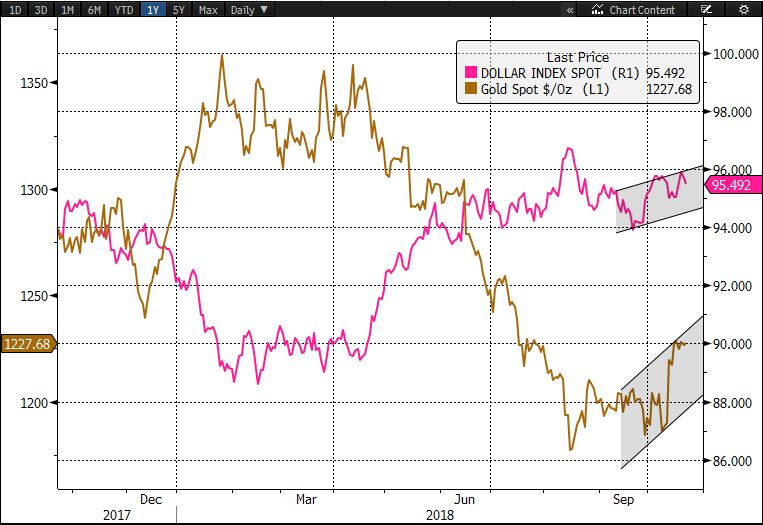
EURJPY Extends Recovery Pressure Towards 130.49 Zone
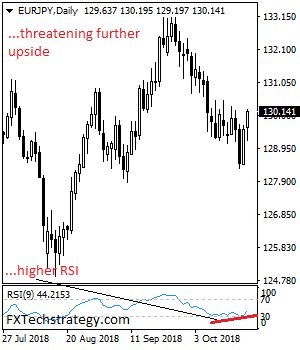
EURJPY extends recovery pressure with eyes on the 130.49 resistance zone. This is coming on the back its price reversal on Friday. Support comes in at the 129.50 level where a break if seen will aim at the 129.00 level. A cut through here will turn focus to the 128.50 level and lower towards the 128.00 level. On the upside, resistance resides at the 130.49 level. Further out, we envisage a possible move towards the 131.00 level. Further out, resistance resides at the 131.50 level with a turn above here aiming at the 132.00 level. On the whole, EURJPY continues to face further upside on further strength.
Gold In Neutral Bias After Challenging 3-Month High
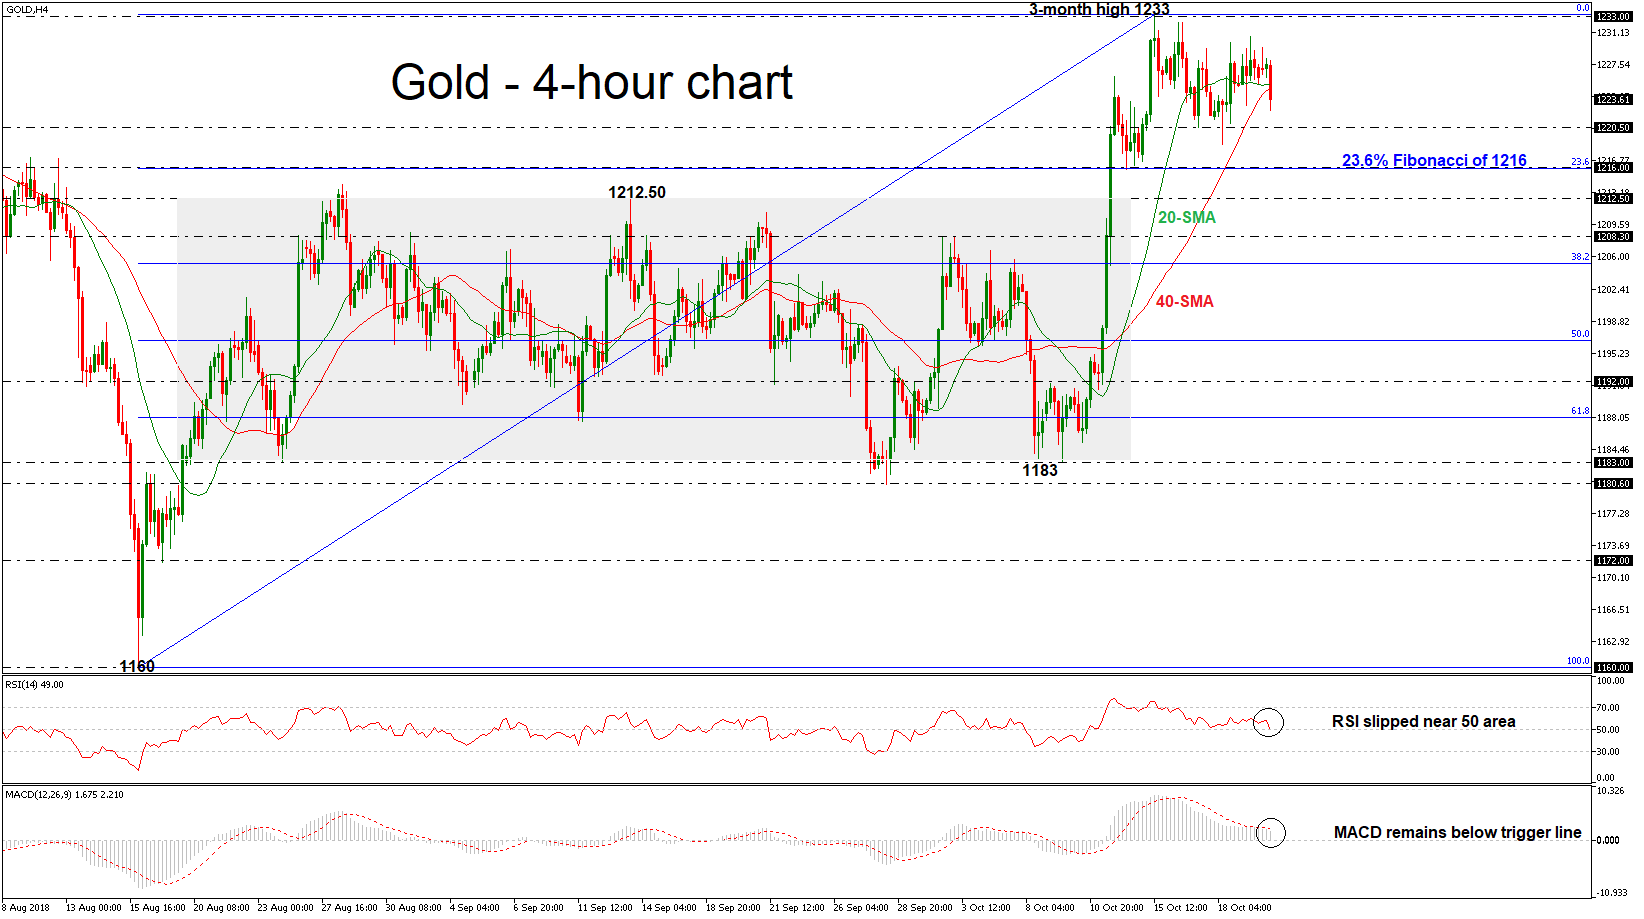
Gold prices posted significant losses on Monday, diving below the 20- and 40-simple moving averages (SMAs) in the 4-hour chart, which are ready to post a bearish crossover in the near future. The price holds in a neutral bias after the jump above of the sideways channel of 1180.60 – 1212.50, while the technical indicators are confirming the recent bearish movement. The RSI is pointing down near the threshold of 50 and the MACD oscillator remains below the trigger line but above the zero line.
In case of more downside pressures the market could meet support at around 1220.50, before moving down towards the 23.6% Fibonacci retracement level of the upleg from 1160 to 1233, near the 1216 support. More losses could see the price retesting the 1212.50 hurdle before it heads lower to the 20-SMA, currently at 1208.30.
An upside movement could drive the precious metal towards the 1233 resistance level, taken from the high on October 15. A significant leg above this barrier could send prices until the next immediate resistance of 1238, achieved on July 3. Moreover, a jump higher could challenge the 1265.60 resistance, where it topped on July 6.
Having a look at the very short-term timeframe, gold prices failed to post another impressive upside rally and are holding below the three-month high of 1233. A significant leg above this level could open the way for a bullish tendency.
The Major Currencies Are Consolidating
On Friday, the USD has moved away from the monthly highs. The USD index (#DX) closed in the negative zone (-0.21%). The American currency was under pressure after the publication of the report on existing home sales, which counted to 5.15M instead of the expected 5.30M. Overall, the demand for USD is at a fairly high level
The CAD weakened against the USD after the publication of the weak economic stats. Therefore, the core consumer price index has lowered to 1.5% year-on-year. The core retail sales index fell in September to -0.4%, while experts expected a growth of 0.2%.
The investors' attention is focused on the Brexit issue. Last week, Great Britain and the EU weren’t able to reach the agreement about the exit of the UK from the union. This weekend was marked by a mass protest in London, demanding a referendum regarding the final agreement on Brexit. There will be a meeting of the Bank of Canada and ECB this trading week. We also recommend you keep an eye on the reports by the FOMC representatives and the US GDP report for the 3 quarter.
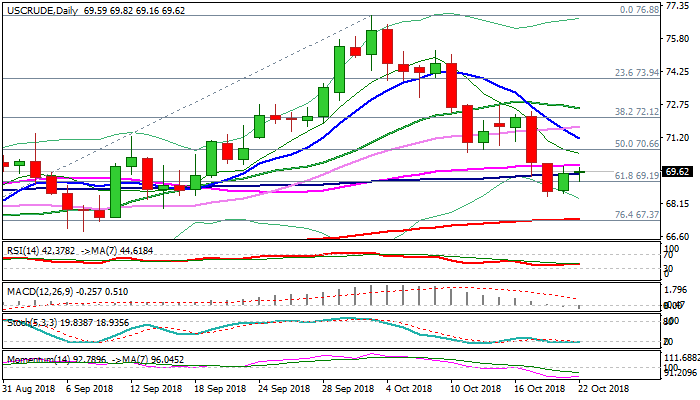
The oil quotes are rising. Currently, futures for the WTI crude oil are testing a mark of $69.80 per barrel.
Market Indicators
On Friday, the major US indices were showing a variety of trends: #SPY (-0,05%), #DIA (+0,25%), #QQQ (-0,09%).
Currently, the 10-year US government bonds yield is at the level of 3.19-3.20%.
The news feed on 22.10.2018:
Today the publication of important news is not expected.
BOC Preview – Rate Hike Fully Priced but Future Decision Still Data- Dependent
The market has fully priced in that BOC would raise its policy rate by +25 bps to 1.75% this week. With Canada-US trade uncertainty eased and the employment market staying strong, the focus is on whether policymakers would consider accelerating the pace of normalization. Notwithstanding a rosier picture, the members would at most be cautiously optimistic, retaining the stance of gradual and data-dependent tightening.
The October statement is accompanied by a press conference and updated economic projections. For the latter, GDP growth forecasts could be upgraded as the market’s expectations of third quarter growth almost a percentage point above the central bank’s+1.5% forecast.
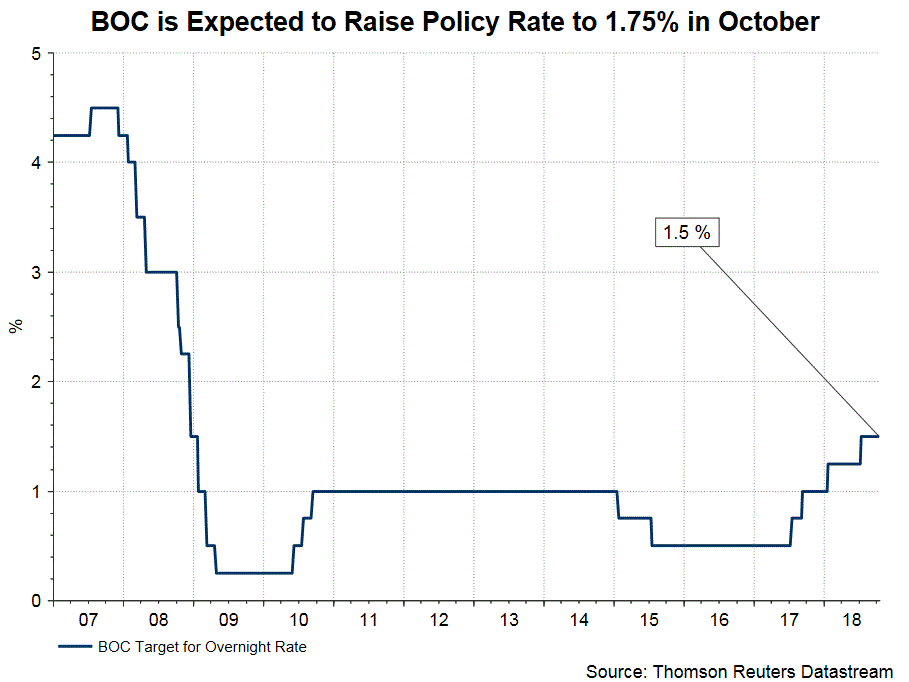
The NAFTA deadlock is considered resolved with Canada joining the US-Mexico trade deal with some amendments. Notwithstanding the criticism, the preliminary trilateral USMCA the market has been thrilled since its announcement earlier this month. Bets for a rate hike this month quickly surged while hopes for more hikes next year’s loomed. Undoubtedly, the biggest hurdle to rate hike has cleared for BOC.
Over the previous meetings, BOC had warned of the cloudy outlook of trade policy, noting that “uncertainty about trade policies continues to weigh on businesses” and “the Bank is also monitoring closely the course of NAFTA negotiations and other trade policy developments, and their impact on the inflation outlook”. We expect these references could be changed at the October meeting.
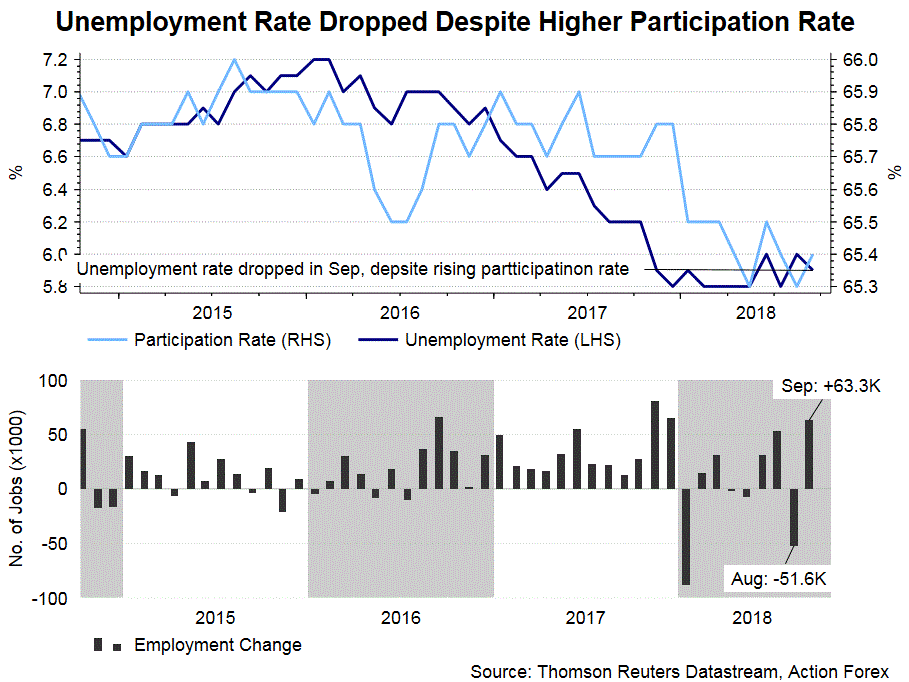
On the macroeconomic developments at home, the job market remains strong. The number of payrolls increased +63K in September, resulting in a lower unemployment rate of 5.9% (compared with 6% in August). The details of the employment report were mixed though. While it is encouraging that the unemployment rate slipped despite an increase in participation, all of the increase in payrolls came from part time job (+80K), while full time employment actually fell -16.9K.
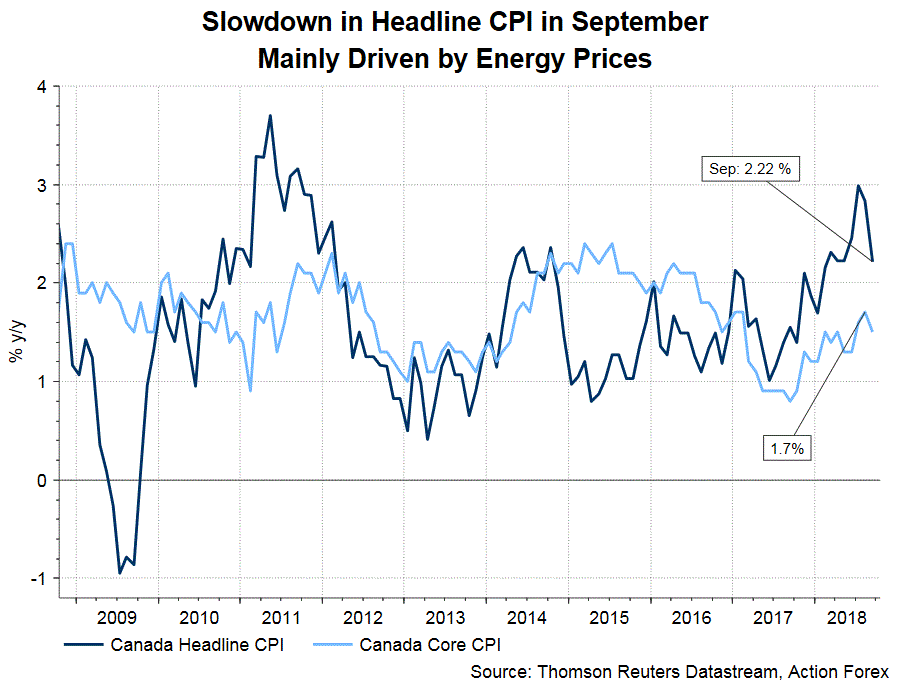
Headline CPI fell to +2.2% y/y in September from +2.8% a month ago, while core CPI also eased tom +1.5% from +1.7%. The slowdown in headline was more remarkable as the rally of gasoline price moderated. BOC’s preferred inflation measures (trimmed, median and common CPI) continued to stay around +2%.
Despite a mixed employment market and moderating inflation in September, clarity of the trade relationship with the US still warrants a rate hike in October. Indeed, if macroeconomic developments continue to evolve according to BOC’ projections, two more rate hike a probably justified in 1H19. Hawks have been suggesting a change in BOC’s forward guidance, which indicates “a gradual” monetary policy approach “guided by incoming data”. We expect the central bank would avoid being overtly optimistic and retain the language.
WTI Oil Outlook: Limited Recovery Keeps The Downside Vulnerable
WTI oil price stands at the front foot in early Monday's trading, following Friday's bounce from daily cloud base, where bears were repeatedly rejected, but recovery attempts struggle at daily cloud top ($69.61) and were so far unable to clearly break higher.
Strong fall in past two weeks ($76.88/$68.46) found footstep and may hold in consolidative / corrective action in coming sessions.
Bullish divergence on oversold slow stochastic supports scenario, with firm break above pivots at $69.61/91 (daily cloud top / 55SMA) needed to signal stronger recovery.
Comments over the weekend that Saudi Arabia would retaliate on recent strong criticism over the death of Saudi journalist and impose oil embargo on western consumers, kept oil price recovery attempts limited.
The downside would remain vulnerable while cloud top / 55SMA cap as overall picture on daily chart is bearish and sees risk of further weakness towards next strong support at $67.42 (200SMA), after Friday's close below $69.19 (Fibo 61.8% of $64.43/$76.88 ascend) generated bearish signal.
Res: 69.61, 69.91, 70.49, 71.14
Sup: 69.16, 68.61, 68.46, 67.93
USDJPY Outlook: Eventual Break Above Fibo Barrier At 112.74 To Signal Fresh Recovery
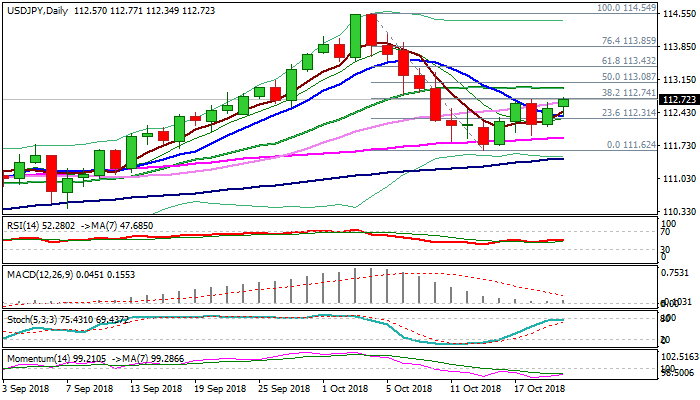
The pair starts week in positive mode and cracked pivotal barrier at 112.74 (Fibo 38.2% of 114.54/111.62 bear-leg) after last week's repeated failures here. Reduced safe-haven demand keeps yen at the back foot, with bullishly aligned studies on daily chart, being supportive. Sustained break above 112.74 is needed to signal and end of congestion (112.73/112) and open way for further recovery of the bear-leg from 114.54. Sideways-moving 20SMA marks next pivot at 112.96, followed by 113.08 (Fibo 50%) and 113.43 (Fibo 61.8%) break of which would confirm higher low at 111.62 (15 Oct low) and re-focus key resistance at 114.54 (03/04 Oct highs). Failure to clear 112.74 barrier would keep the pair within the range and would keep the downside vulnerable. Initial support lays at 112.36 (10SMA), while return below 55SMA (111.90) would bring bears fully in play.
Res: 112.96, 113.08, 113.43, 113.86
Sup: 113.36, 112.14, 111.90, 111.62
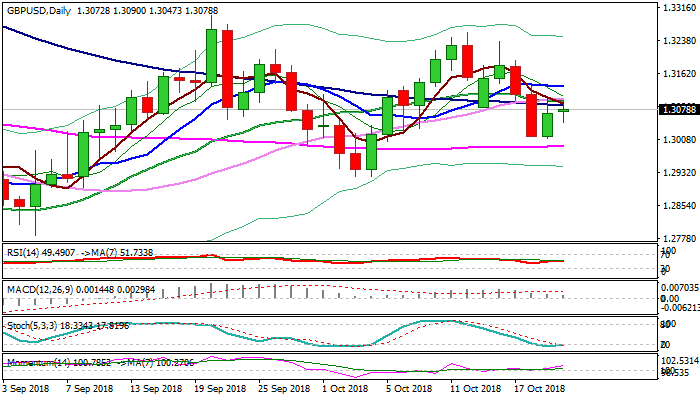
GBPUSD Outlook: Break Above 1.31 Zone To Signal Recovery Extension, Brexit Remains Key Event For Pound
Cable maintains positive tone at the beginning of the week, following last Thu/Fri strong downside rejection at daily cloud top (1.3012) and subsequent bounce.
Bulls attack again strong resistance zone between 1.3087 and 1.3103 (100/20/30SMA / Fibo 38.2% of 1.3257/1.3011), where Friday’s recovery rally stalled.
Sustained break here is needed to signal higher base and further recovery.
Momentum remains with bulls on daily chart and slow stochastic reversed and attempting to emerge from oversold territory, supporting the recovery.
Extension above 1.3103 could challenge 1.3132 (10SMA) and 1.3163 (Fibo 61.8% of 1.3257/1.3011).
Brexit talks remain pound’s key driver and pound could take a hit if PM May’s plan (which is mostly done, but the problem with Irish border remain on the table) faces challenge from the opposition.
Negative scenario sees risk of fall below 1.30 zone and test of higher base at 1.2921, loss of which would confirm reversal.
Res: 1.3103, 1.3132, 1.3163, 1.3200
Sup: 1.3047, 1.3012, 1.3000, 1.2944