Sample Category Title
WTI Oil Outlook: Oil Prices Fell Sharply after Stronger than Expected Crude Inventories Build
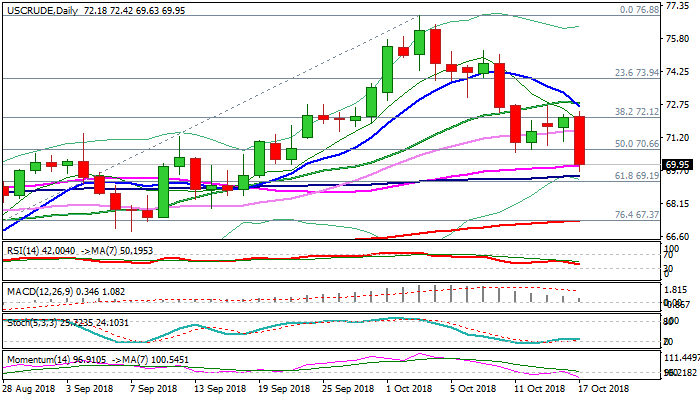
WTI oil fell over $1 and broke below psychological $70 support after EIA crude stocks report showed unexpected build of US crude inventories last week. Crude stocks rose 6.49 million barrels, compared to previous week's build of 5.89 million barrels and forecast for 1.6 million barrels build. Oil is down over 3% for the day and around 1.7% after report's release, with extension below $70 handle, penetrating daily cloud (spanned between $69.89 and $68.51), generating negative signal. Extension of bear-leg from $76.88 (03 Oct high) eyes targets at $69.44 (100SMA) and $69.19 (Fibo 61.8% of $64.43/$76.88) to confirm reversal. Daily close below broken $70 support would be bearish signal to support negative scenario.
Res: 70.00; 70.49; 71.51; 72.42
Sup: 69.44; 69.19; 68.51; 67.93
BoE Cunliffe: May still be underestimating labor market supply in UK
BoE Deputy Governor Jon Cunliffe told a parliament committee, "pay growth has established itself in the 2.5-3 percent range." However, "latest readings do not signal strongly that pay growth will make the next step to establish itself firmly in 3 percent territory in line with the May forecast". He added that BoE may "still be underestimating supply in the labour market.
And, Cunliffe also said the MPC's approach in monetary policy "does not incorporate a judgement on the outcome of Brexit". And, it would be "mistaken to set policy going forward in anticipation now of any particular Brexit outcome." The "best course" is "until there is clarity on Brexit is to react to the economy as it evolves, conditioning our forecasts on neutral assumptions about Brexit outcomes."
Cunliffe's questionnaire for Treasury Select Committee re-appointment hearing.
EU Oettinger: Italy budget not inline with EU obligations
German magazine Der Spiegel reported that a top EU official confirmed Italy's budget doesn't meet EU guidelines. Günther Oettinger, European Commissioner for Budget and Human Resources Günther Oettinger, was quoted saying that "it confirmed the suspicion that the Italian budget draft for 2019 is not in line with the obligations that exist in the EU." European Commissioner for Economic and Financial Affairs, Pierre Moscovici, is going to send a letter to Italy this week regarding the issue.
Separately, Italy's cabinet undersecretary for regional affairs, Stefano Buffagni, told Radio capital that if European Commission is to start an infraction process over the budget, Primer minister Giuseppe Conte is going to the EU to explain the "motivations" behind the plan. He also added that credit rating downgrade "can't be excluded and we must be ready" even though "Italy has very solid economic fundamentals.
S&P and Moody's are both going to review Italy's rating later this month.
EURJPY Hovers in Trading Range in Very Short-Term
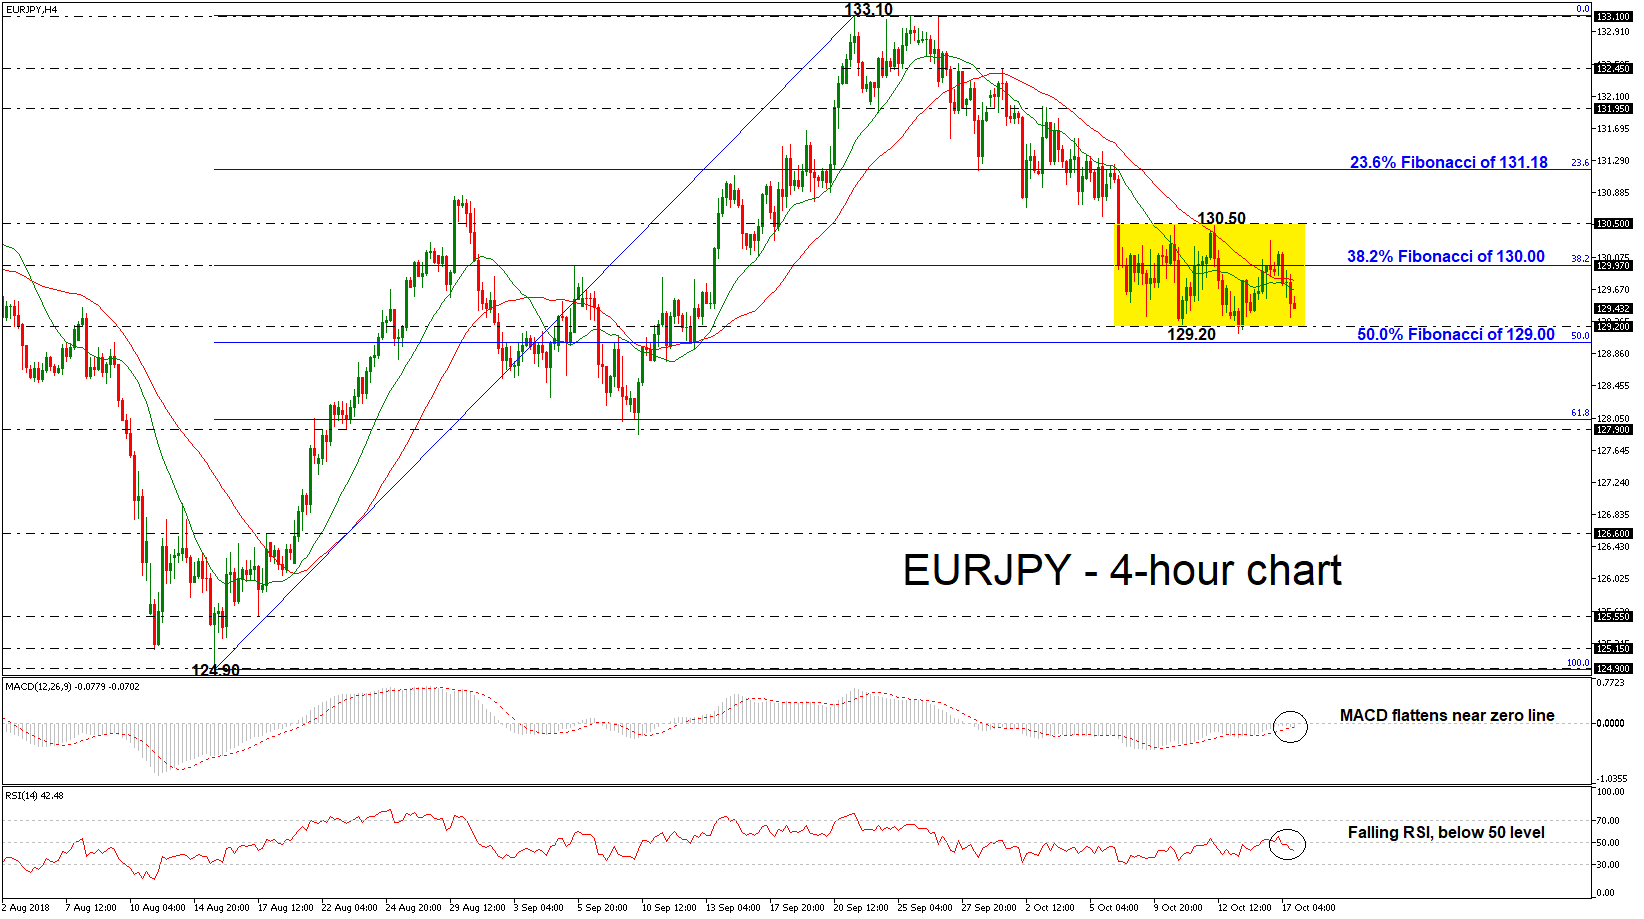
EURJPY has been trading within a consolidation area in the very near term with upper boundary the 130.50 resistance level and the lower boundary the 129.20 support hurdle since October 8. The price headed lower in the previous session and is supported by the technical indicators. The RSI is moving south in the negative zone, while the MACD oscillator hovers near the zero line.
If prices are able to continue to move lower the next support for traders to watch is the 129.20 barrier. Even lower, the pair could meet the 50.0% Fibonacci retracement level of the upleg from 124.90 to 133.10, around the 129.00 handle, while the next obstacle could come from the 61.8% Fibonacci of 128.00.
However, if the market manages to turn to the upside above the 38.2% Fibonacci of 130.00, the price could move towards the upper boundary of the range at 130.50. A break above this region could open the way towards the next resistance – the 23.6% Fibonacci of 131.18.
Looking at the near-term picture, at the 4-hour chart, EURJPY has been trading within a short-term downtrend over the last three weeks after the price bounced off the 133.10 resistance level.
Japanese Export Growth to Slow, Inflation to Edge Up in September
Japan will publish monthly trade numbers on Thursday (Wednesday, 23:50 GMT) and the latest inflation figures on Friday (Thursday, 23:30 GMT). Export growth likely eased in September but is expected to have remained positive for the 22nd straight month. Core inflation, meanwhile, is projected to have inched higher, in what would be good news for the Bank of Japan. But with neither data having the capacity to alter the near-term outlook for BoJ policy, the yen should remain risk-driven following the latest episode in global stock markets.
Disruptions due to natural disasters that hit Japan in September are expected to have slowed exports to just 1.9% year-on-year growth from 6.6% in the previous month. However, with little impact on Japanese exporters so far from the US-China trade war, shipments are anticipated to recover in the coming months. Looking at imports, they are also forecast to have moderated in September, from 15.3% to 13.7% y/y. The trade deficit is expected to have shrunk sharply, though, from a revised 438.4 billion yen to 50 billion.
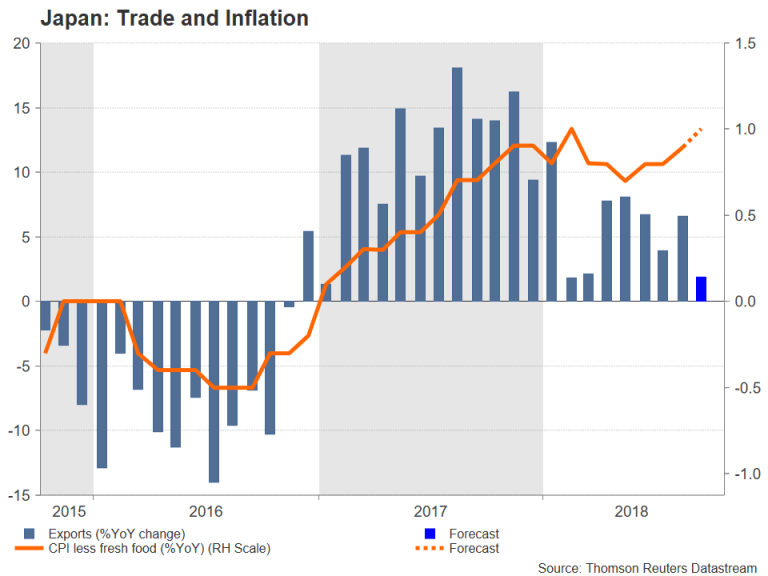
While growth in Japanese exports has come off from the double-digit levels enjoyed in 2017, it’s held up relatively well in the face of rising trade frictions and a weaker outlook for global growth. However, that resilience could soon be put to the test as Japan and the United States will soon commence bilateral trade talks, diverting focus away from China and onto Japan’s lucrative auto industry.
Japan won a temporary reprieve in September from higher tariffs by the Trump administration on its cars entering the United States after Prime Minister Shinzo Abe caved in to demands by President Trump to hold direct, bilateral trade negotiations. But in a possible sign of contentious talks to come, Japanese officials have dismissed the idea of adding foreign exchange policy to upcoming discussions, after the US Treasury Secretary, Steven Mnuchin, recently hinted that all future trade deals by Washington will contain a provision on currency manipulation, similar to the one included in the USMCA.
The Trump administration has in the past criticised the Bank of Japan’s ultra-loose monetary policy for keeping the yen artificially weak. However, the depreciation of the yen versus the US dollar since April, along with a rise in energy prices, may finally be translating to higher inflation. The core rate of CPI, which excludes fresh food prices, is expected to hit 1.0% y/y in September for the first time since February. After a steady upward progress since late 2016, core inflation topped out at 1% early in 2018, forcing the BoJ to abandon its timeframe for meeting its 2% inflation target.
With some way to go until core CPI reaches 2%, Friday’s inflation data is unlikely to excite yen traders much as investors will want to see a sustained rise above 1% before beginning to price in tighter monetary policy by the Bank of Japan. The trade numbers are not expected to see a big reaction on Thursday either. However, any surprises to this week’s figures could weigh on or support dollar/yen, which at the moment, is mostly being led by US treasury yields and wider market sentiment.
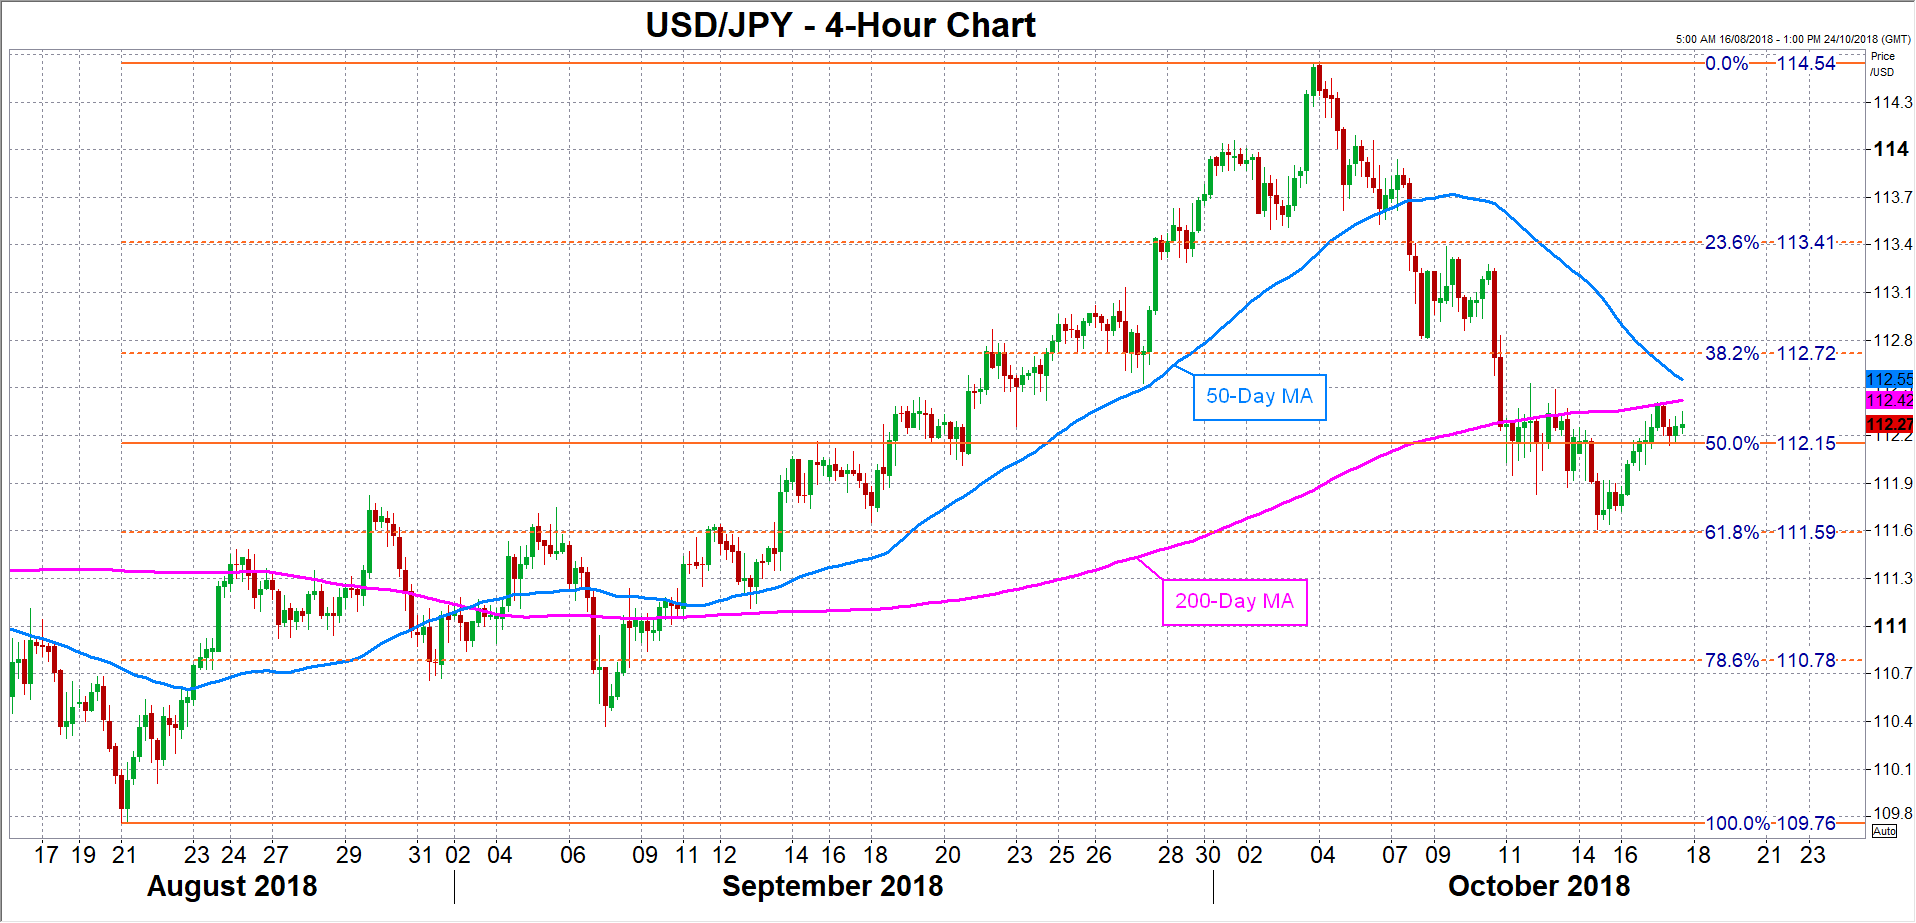
Dollar/yen is currently being capped by the 200-day moving average (MA) and the 50% Fibonacci retracement level of the upleg from 109.76 to 114.54, at 112.15. A break above the 200-day MA would clear the way towards the 38.2% Fibonacci at 112.72, while the 23.6% Fibonacci at 113.41 would provide the next support for the yen.
If the pair is unable to hold above the 50% Fibonacci, this would deepen the short-term bearish view and risk another test of the 61.8% Fibonacci level of 111.59, near October 15’s one-month low. Below this point, the 78.6% Fibonacci at 110.78 is a key resistance area for the yen before it attempts to challenge the August trough of 109.76.
Sunset Market Commentary
Markets
Global core bonds edged higher today with German Bunds outperforming US Treasuries. There was no clear trigger even if lower oil prices might be partly at play. OPEC secretary general Barkindo said that the oil market remains very well supplied going forward. European stock markets also failed to hang on to opening gains. The Bund’s outperformance occurred amid a dismal-received long Bund auction. The intraday upleg accelerated somewhat after the German 10-yr yield gave away minor support around 0.48%. German FM Scholz said that the country will continue to bring the debt ratio down towards 50% of GDP. Softer-than-expected US housing data went unnoticed with FOMC Minutes still on traders’ watch. Expectations of breathtaking news are rather low given that we’ve already had a policy statement, new projections and a press conference. US yields decline by up to 0.9 bps (10-yr) at the time of writing. The German yield curve shifts 1.4 bps (2-yr) to 2.7 bps (10-yr) lower. 10-yr yield spread changes vs Germany widen by 5 bps for Greece and 9 bps for Italy.
Global equity markets took a more cautious approach today after yesterday’s forceful rebound in the US. European equities and US futures showed moderate losses. There was no clear driver for USD trading over de previous days. The dollar returned to pole position on the currency markets today. Interest rate differentials re-widened in favour of the greenback as Bunds clearly outperformed US Treasuries. Are markets anticipating hawkish Fed minutes this evening? EUR/USD drifted further south off the 1.16/1.1620 resistance area which was rejected over the previous days. The pair trades currently in the 1.1535 area. USD/JPY holds up rather well given the loss of momentum at equity markets. The pair holds north of 112 (currently 112.30).
Sterling regained modest ground in technical trade yesterday. Strong wage data triggered a further reduction of GBP shorts. The glass was half empty today for the UK currency. Comments from EU officials suggested that any further progress on Brexit would be difficult at this evening’s EU summit. In addition, UK September CPI inflation came out softer than expected at 2.4% Y/Y for the headline measure (2.6% was expected) and 1.9% Y/Y for the core measure (2.0% expected). The report probably didn’t change the BoE’s rate hike intentions in any profound way. Further gradual BoE rate hikes are de facto conditional on the UK leaving the EU in an orderly way. This condition isn’t met yet. The report suggested that the BoE shouldn’t feel pressured to take action anyway, contrary to yesterday’s higher than expected wage data. EUR/GBP jumped temporary a few ticks above the 0.88 level after the CPI release, but trades currently again in the 0.8795 area, awaiting the developments in Brussels this evening. Soft CPI data and some overall USD gains pushed cable back south. The pair trades currently in the 1.3115 area.
News Headlines
Members of the 46-nation Government Procurement Agreement failed to reach an agreement for the UK to stay in the pact. Britain’s bid to (re)-join the agreement will again be considered next month. A failure to reach an agreement could prevent UK companies from applying for government contracts in the member countries.
EU car sales for the month of September as reported by the ACEA industry body nosedived 23.5% Y/Y. On September 01, new emission and fuel-consumption testing procedures were introduced. Sales in July and August jumped higher as automakers at that time gave substantial discounts to reduce inventories.
US September housing data printed slightly softer than expected. Housing starts dropped 5.3% M/M to a 1.201m annualized rate. The decline might have been affected by hurricane Florence. Permits declined 0.6% M/M. A 2.0% rebound was expected. Bot series show some loss of momentum, but remain at fairly lofty levels.
US: Housing Starts Fall Slightly More than Expected in September
After a solid rebound in the month prior, U.S. housing starts fell 5.3% (or -67k) to 1.20 million in September. The headline print came in a touch lower than expected (-5.6%). An upward revision to July (+10k) and downward revision to August (-14k) subtracted a net 4k from activity.
The decline was led by the volatile multi-family segment, which fell 15.2% to 330k units in September after rising by some 20% in the month prior. Single-family starts fell 0.9% to 871k, giving back about half of last month's gain.
Building permits also edged lower in September, falling 0.6% (or -8k) to 1.24 million. The multifamily segment (-32k) was entirely responsible for the decline, as single-family permits edged higher (+24k).
Starts were dragged down by steep 14% declines in the South (-90k) and Midwest (-26k). Increases in the West and Northeast helped cushion the blow. Starts rose 6.6% in the West and rebounded by nearly 30% in the Northeast after declining for three straight months.
Key Implications
With Hurricane Florence disturbing homebuilding activity in September, it wasn't really a question of "will starts fall", but rather "by how much". Today's report, which features a steep decline in the South, suggests that activity cooled much as expected. Rebuilding efforts in the aftermath of the recent hurricanes should provide a temporary boost to residential construction toward the end of the year.
Further out, homebuilding should trek higher, in line with an economy that is operating near full employment and a shortage of homes on the market. However, headwinds to both demand (rising prices and higher interest rates) and supply (rising material costs and shortage of workers and buildable lots) will limit the upside, making for a mild upward trajectory in starts through 2020.
Canadian Manufacturing Sales Fall in August, Driven by Autos
Canadian manufacturing sales retreated in August, falling 0.4% following last month's upwardly revised 1.2% (previously reported as 0.9%). The release comes slightly better than expectations for a decline of 0.6%. After accounting for price changes, volumes were also down a modest 0.3%.
Durable goods led the pullback, falling 1.2%. This was mostly driven by a slump in motor vehicle sales (-8.3%) and railroad rolling stock (-10.9%). Aeropsace product sales provided some offset, increasing 13.5% and resulting in a less-severe 2.4% contraction in the overall transportation equipment sector. Primary metals also fell for the third consecutive month, down 2.9%. In contrast, machinery sales went up 2%.
Non-durable goods fared better, increasing 0.5% on the back of higher chemicals (1.1%) and plastics and rubber products (3.8%) sales.
Regionally, declines were mostly driven by Ontario (-2%), as expected given the sharp pullback in auto sales. Alberta (-0.8%) and Nova Scotia (-2.3%) also saw declines, whereas the remaining seven provinces saw manufacturing sales rise on the month.
Inventories increased 1.1%, continuing their upward trend once again, whereas the inventory-to-sales ratio also moved up to 1.43. Forward looking indicators were generally positive, with new orders up 1.1% and unfilled orders up 0.8%.
Key Implications
The release came in as expected, with autos driving most of the headline decline. After the second quarter's impressive performance and an unexpectedly strong July print, this shouldn't be a cause for concern. On the flip side, excluding autos, today's report paints a healthy picture of manufacturing growth, with 14 of 21 industries advancing and with the ex-auto sales print moving up 0.5%. Moreover, Statistics Canada cited "atypical" shutdowns as being a factor in the autos slump – suggesting that some of the decline is transitory.
We continue to expect moderate growth going forward, but this week's Business Outlook release adds some optimism to Canada's manufacturing (and general business) outlook, with signs of increasing investment on the back of rising domestic and U.S. demand and growing capacity constraints.
Looking ahead, strong growth indicators in the second quarter have provided sufficient conviction thus far for a Bank of Canada rate hike next Wednesday. Following the USMCA agreement at the end of last month, a major cloud of uncertainty has been lifted for the data-driven Bank of Canada, which adds the potential for a follow up rate hike in the beginning of 2019.
Canadian Manufacturing Sees Auto-Driven Slowdown in August
Highlights:
- Manufacturing sales fell 0.4% in August, close to market expectations for a 0.6% decline.
- The slowdown was narrowly-based with 7 of 21 industries seeing declines in August.
- The auto industry usually sees temporary shutdowns for retooling in July, but StatCan noted “atypical” shutdowns were behind lower motor vehicle production in August.
- Sales volumes were down 0.3% in August. We expect a similar decline when translated into monthly GDP. That will do little to retrace a cumulative 2% increase over the prior two months, and should leave manufacturing as a positive contributor to Q3 GDP growth (our forecast at 2.3%).
Our Take:
Manufacturing sales volumes fell as expected in August. The decline largely reflected unusual shutdowns in the motor vehicle sector (already flagged in export data) that should prove transitory. Some offset came from a jump in the volatile aerospace component. Excluding transportation, sales volumes recorded a modest increase with a majority of industries seeing gains. Manufacturing data has been volatile but the underlying trend is one of improvement. The sector saw a nice pickup in activity last year (after a slow 2015-16) and has remained a solid contributor to GDP growth in 2018. That has coincided with a strengthening US manufacturing sector: yesterday’s industrial production data showed manufacturing sales growing at their best year-over-year pace since 2012.
Ongoing strength in the US economy and a stable Canadian dollar should continue to support manufacturers. A significant reduction in trade uncertainty—at least within North America—will also help. But capacity constraints could represent a growing headwind. Capacity utilization in manufacturing is close to cycle highs but still below pre-recession norms. Job vacancies are elevated, and business surveys indicate skilled labour is hard to find. Reduced trade uncertainty, and perhaps some measures to encourage investment in the next federal budget, might spur capacity additions, but labour shortages will likely remain an issue. That could mean the manufacturing sector’s fastest growth is behind us for this cycle.
AUDUSD Showing First Signs of Bearish Continuation – Elliott Wave Analysis
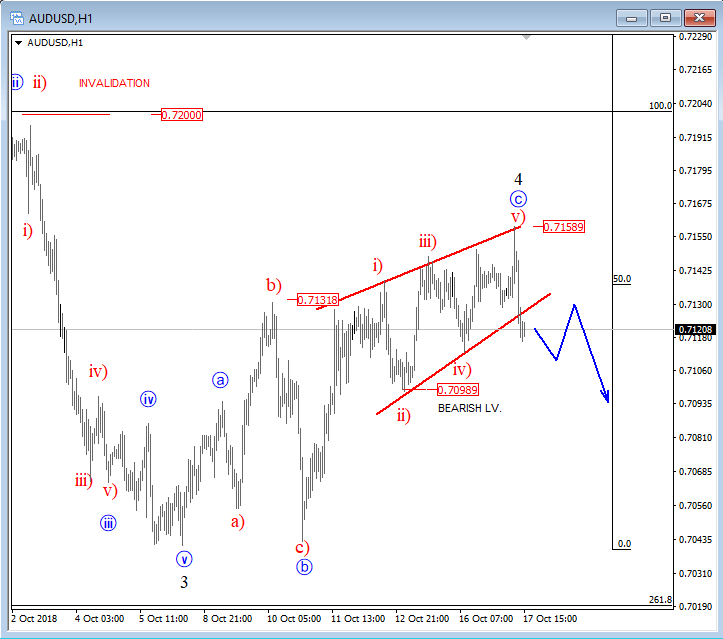
AUDUSD is dropping like a rock at the start of the US session, suggesting that a higher degree wave 4 correction had ended with an ending diagonal in its final wave c. In such case, we now expect to see a drop in three-waves, where a break below the 0.7099 level would confirm even more weakness for the pair. Also a drop out of an ending diagonal can indicate price to reach the starting point of the pattern, which is in our case at the 0.704 region.
AUDUSD, 1h