Sample Category Title
GBPUSD Intraday Analysis
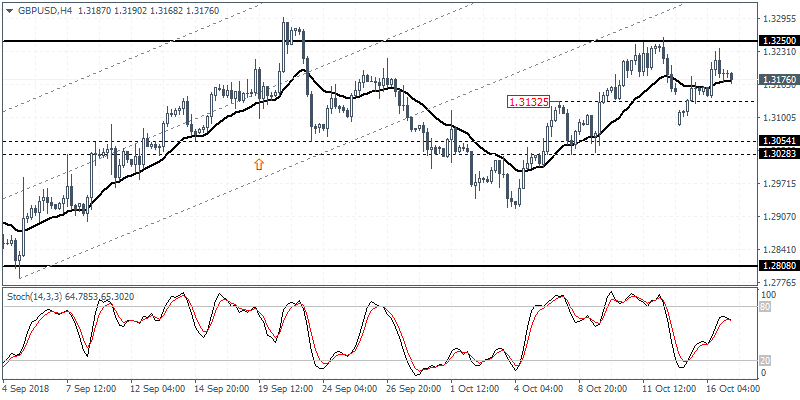
GBPUSD (1.3176): The GBPUSD currency pair posted a rebound and managed to rise only to form a lower high. The decline off this lower high suggests that the British pound could be on its way to test the lower support at 1.3054 - 1.3028. Price action is currently supported by the 20-period EMA on the 4-hour chart time frame. Watch for the minor support at 1.3132 to hold the declines initially. To the upside, GBPUSD will need to break past the 1.3250 level to confirm the upside
EURUSD Intraday Analysis
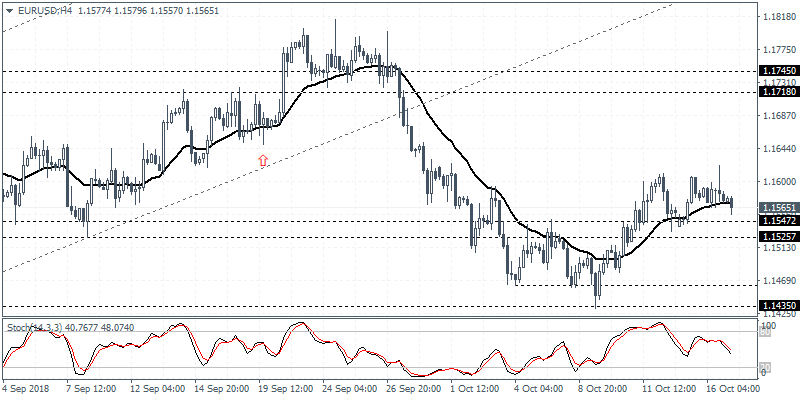
EURUSD (1.1565): The EURUSD currency has formed a double top pattern on the 4-hour chart. Price action spiked through this level yesterday before giving up the gains. We expect a retest of the support area near 1.1547 - 1.1525 level. If this support gives way, the common currency could be seen pushing lower. We anticipate that the EURUSD would test 1.1500 level to establish support ahead of potential further gains in store.
China’s Headline Inflation Rose 2.5%
China's headline inflation rose 2.5% on the year ending September. This was a modest increase from August inflation rate which touched 2.3%. However, producer prices index data rose at a slower pace for the third consecutive week. PPI was seen rising just 3.6% on the year missing estimates of a 3.7% increase. In August, China's PPI was at 4.1%.
Data from the UK showed that wage growth picked up sharply. Excluding bonuses, wages in the UK advanced 2.7% in the three months ending August. This was higher than the median estimates of 2.6%. The UK's unemployment rate held steady at 4.0% for the third consecutive month.
Data from the Eurozone showed that the German economic sentiment index weakened to -24.7 unexpectedly. The decline was seen coming due to the uncertainty on global trade policies.
The UK's Office for National Statistics will be releasing the inflation report today. Consumer prices in the UK are forecast to rise 2.6% on the year ending September 2018. The forecasts mark a modest slowdown in the pace of inflation increase. Core inflation rate is also expected to rise at a slower pace of 2.0% from 2.1% in August.
Following this, the Eurozone's final inflation figures will be coming out. Headline CPI is expected to be confirmed at 2.1% while core inflation rate is expected to rise at a much slower pace of 0.9%.
The NY trading sessions start off with Canada's manufacturing sales report. This is followed by the building permits and housing starts data. Building permits are expected to rise by 1.28 million while housing starts are expected to rise at a slower pace of 1.21 million.
Later in the evening, the Fed will be releasing its meeting minutes from September. The minutes mark the monetary policy decision where officials hiked interest rates by 25 basis points.
USD/JPY Bullish Retracement Bounces At Fibonacci Resistance
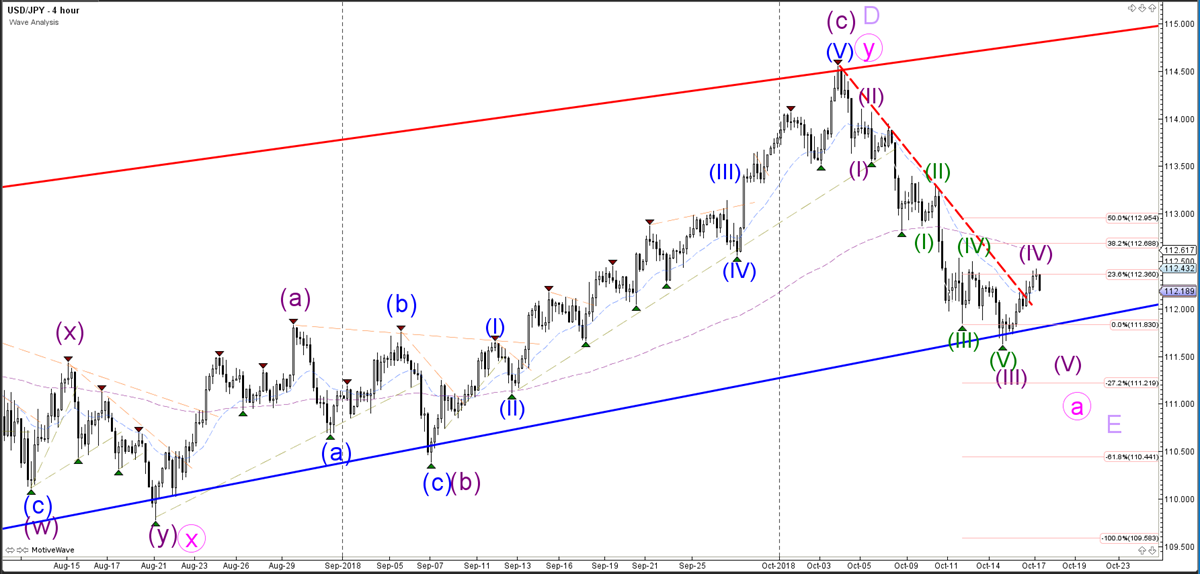
The USD/JPY currency pair seems to be building a bullish retracement within the downtrend. As long as the price stays below the 382-50% Fibonacci resistance zone, the price will probably be in a wave 4 (purple) correction. The bearish breakout is probably part of an ABC zigzag pattern (pink) within wave E (purple).
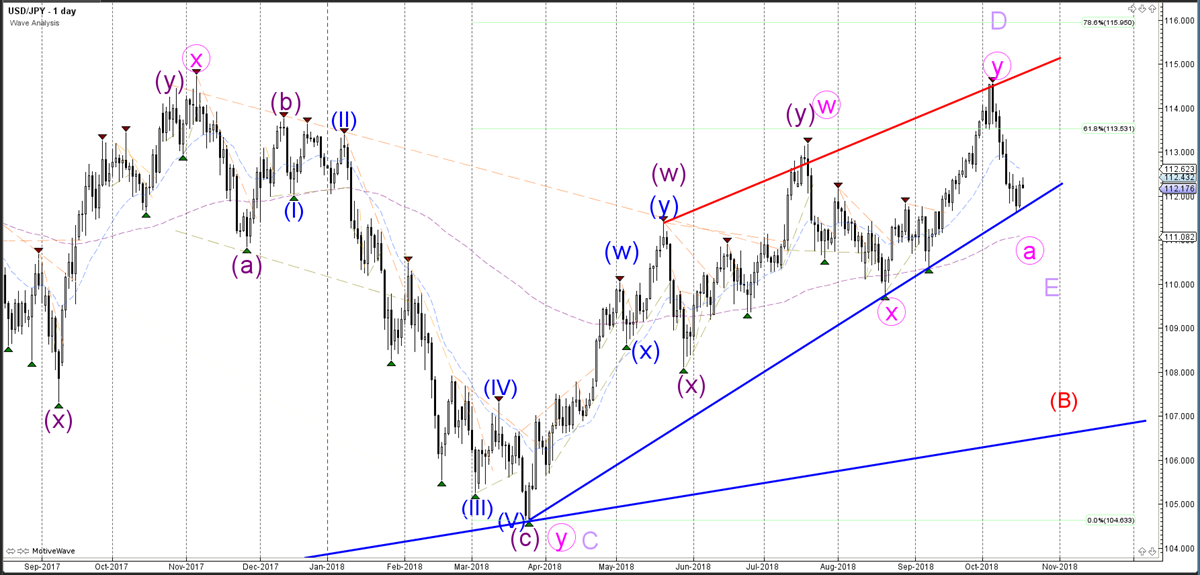
The USD/JPY currency pair needs to break below the support trend line (blue) with a clear bearish candlestick pattern, otherwise the wave 4 could go sideways.
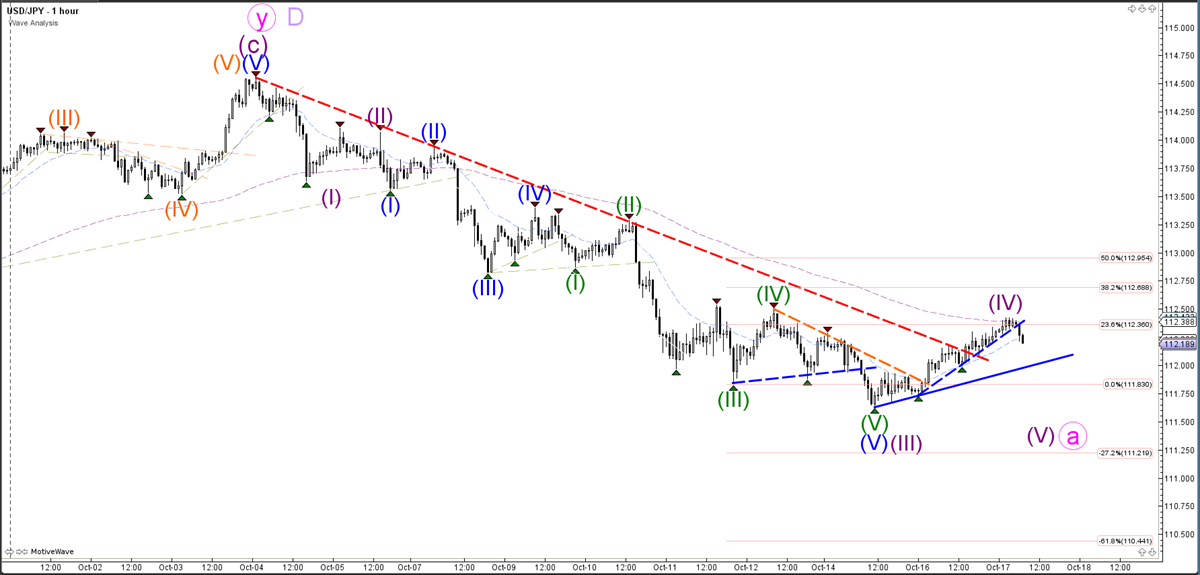
The USD/JPY currency pair is testing a support trend line (blue) which offers a potential breakout or bounce.
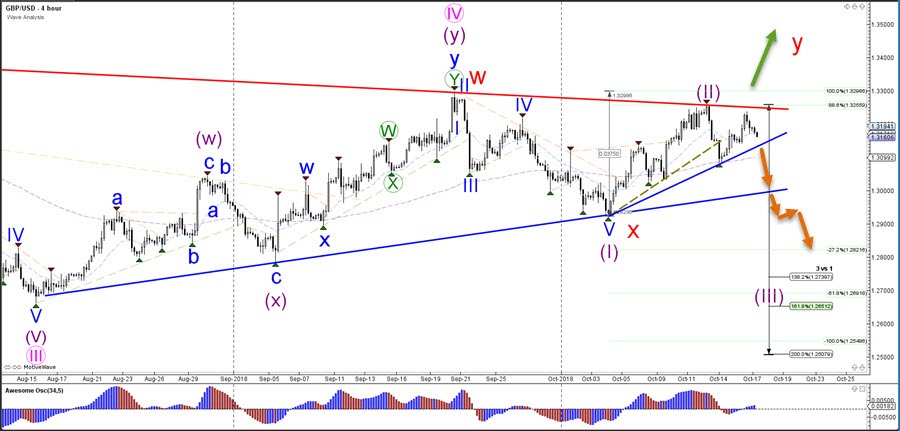
GBP/USD Must Break Pattern Lines For New Trend
The GBP/USD bounced again at the resistance trend line and is now approaching a key support trend line, which is a new bounce or break spot.
The GBP/USD needs to break above the resistance (red) or below the support (blue) of the triangle pattern and sideways price action before a new trend becomes clear.
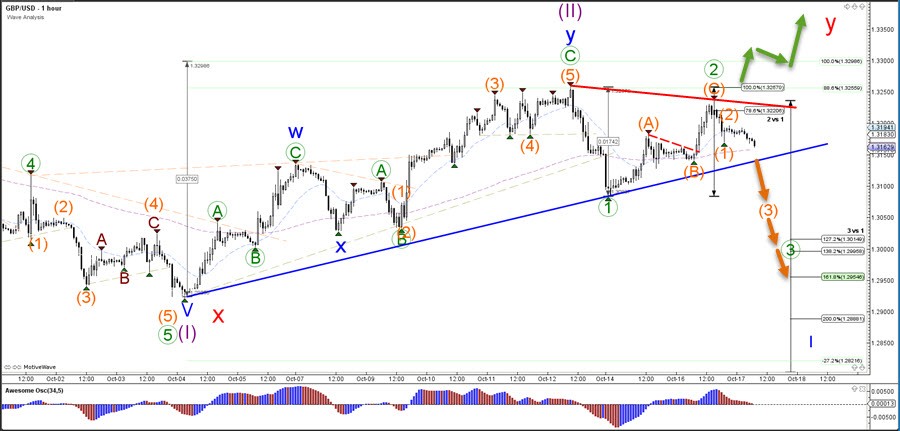
 The GBP/USD bounced at the 78.6%Fibonacci retracement level of wave 2 vs 1 (green) but price needs to break below the support trend line (blue) to confirm a wave 3 (orange).A break above the 100% Fib level invalidates this wave pattern.
USDJPY Testing Neckline Resistance
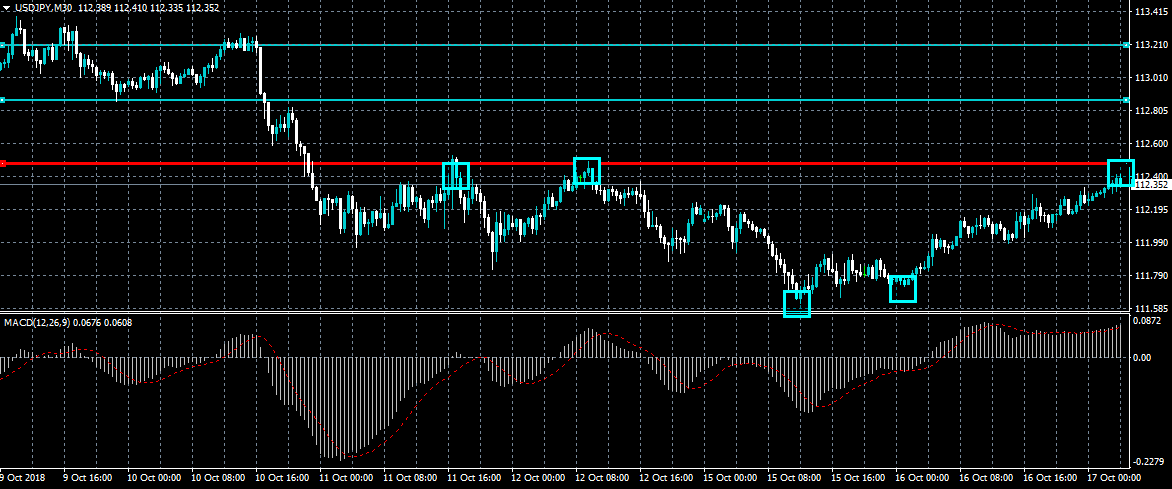
The US dollar is once again correcting higher against the Japanese yen currency, as market sentiment continues to improve on Wednesday. The USDJPY is testing towards the neckline of a bullish inverted head and shoulders pattern, which could potentially take the pair above the 113.00 level. The release of the FOMC Meeting Minutes later today is likely to be the key intraday driver for the US dollar.
The USDJPY pair is intraday bullish while trading above the 112.55 level, key resistance is now found at the 112.90 and 113.20 levels.
If the USDJPY pair trades below the 112.00 level, sellers may test towards 111.60 and 111.10 support levels.
GBPUSD Bullish Pattern Still Valid
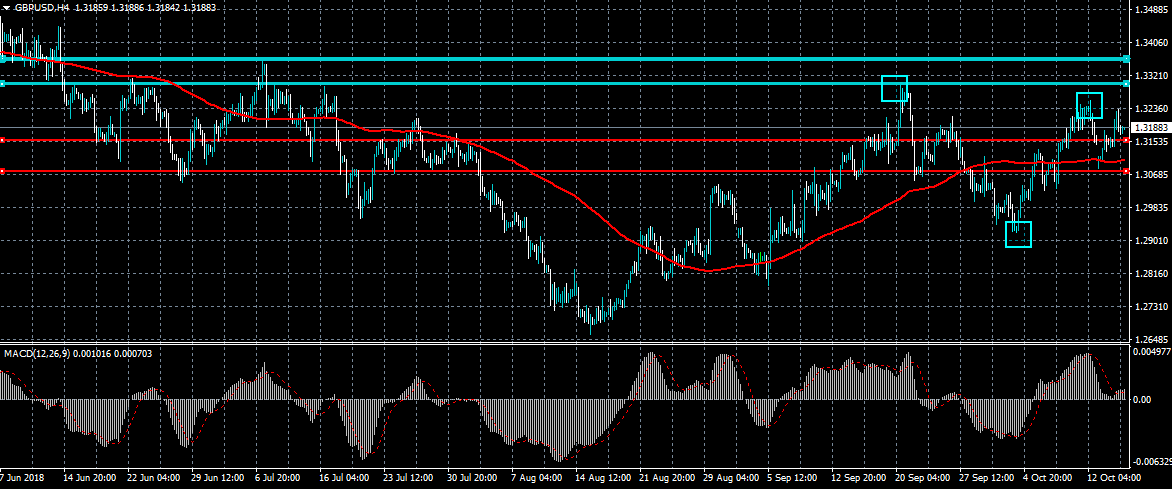
The British pound is trading back under the 1.3200 level against the US dollar after buyers lost upside momentum around the 1.3236 level on Tuesday. Overall, a bullish cup and handle pattern could be forming on the GBPUSD pair, with a sizeable upside projection. Traders now await the release of the key CPI and PPI inflation data from the United Kingdom economy this morning.
The GBPUSD pair is only intraday bearish while trading below the 1.3200 level, key resistance is found at the 1.3260 and 1.3297 levels.
If the GBPUSD pair moves below the 1.3155 level, key technical support is found at the 1.3100 and 1.3070 levels.
Bitcoin Moves Sideways As Blackrock Fails To Provide Update
Yesterday, BlackRock released its much-anticipated third-quarter earnings. Traders were hoping that the global asset manager would provide an update regarding its previous interest in digital assets, however, the company failed to address the issue at a conference call. Analysts also failed to ask questions about the venture but the assumption is that BlackRock has given up on the digital asset industry. If it had set up a team for crypto, it is likely that it would have been mentioned yesterday.
On a positive note, Fidelity announced that it was setting up a platform to make it easier for institutional investors to invest in cryptocurrencies. In an announcement, the firm said that Fidelity Digital Assets Services will facilitate crypto transactions. A statement from the CEO said:
Our goal is to make digitally native assets, such as Bitcoin, more accessible to investors. We expect to continue investing and experimenting, over the long-term, with ways to make this emerging asset class easier for our clients to understand and use.
The company will mostly offer custodial services. Already, companies like Coinbase and Gemini offer such services. At the same time, other large firms like Goldman Sachs, Northern Trust, and Nomura have announced that they are exploring the industry. The entry of Fidelity is important because it administers more than $7.2 trillion of assets.
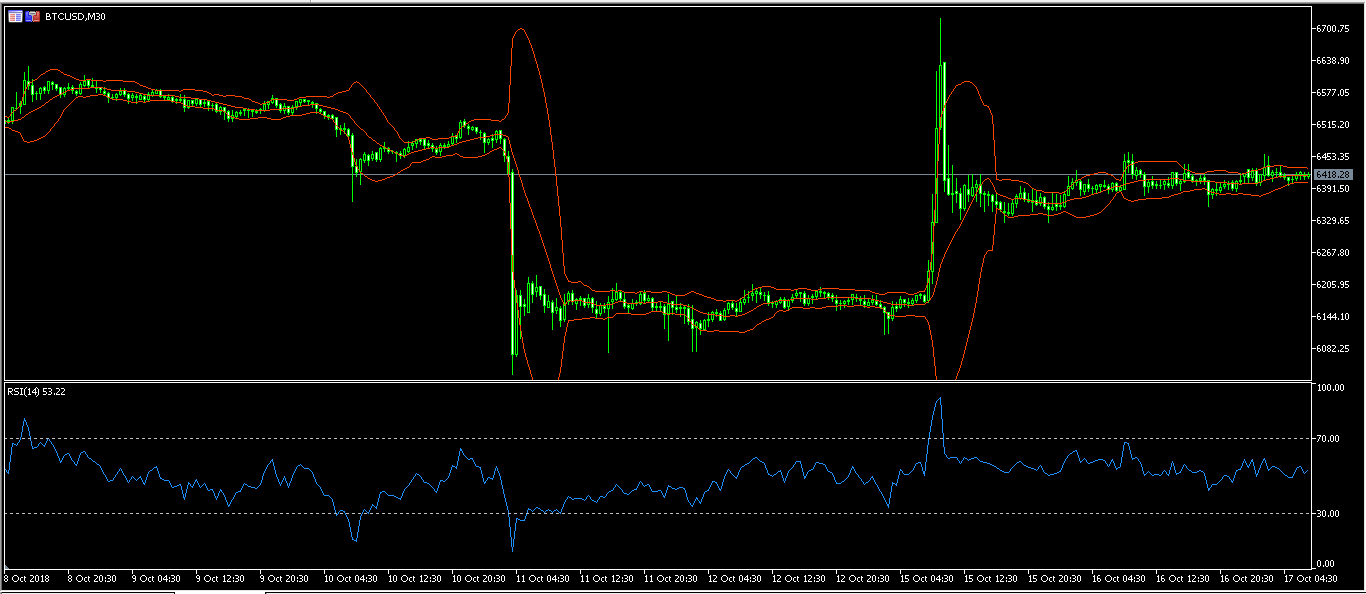
The lack of any news from Blackrock yesterday made the BTC/USD pair trade within a narrow range as shown in the chart below. This was also the case with other cryptocurrencies like Ethereum, Ripple, and Litecoin. As the pair moves in a sideways direction, it is recommended to have a neutral stance on it. This is because a breakout could happen in either direction.
Sterling Wipes Gains As Focus Returns To Brexi Stalemate
Wall Street gained yesterday after earnings data overshadowed recent news about a slowing economy and interest rates. The Dow, Nasdaq, and S&P gained by 547, 214, and 60 points respectively. These results were helped by Goldman Sachs, Morgan Stanley, BlackRock and Johnson & Johnson. In the aftermarket, results from Netflix showed that revenues and earnings had beaten analysts’ forecasts leading to a sharp increase in the stock price. Today, the Asian markets followed Wall Street with the Nikkei, Hang Seng, and China A50 gaining by 331, 17, and 43 points respectively. In Asia-Pacific, the Australian ASX gained by 63 points.
Yesterday, sterling rose sharply after the UK released better-than-expected wage numbers. As a result, traders ignored the stalled Brexit negotiations and focused on the UK economy instead. In the Asian session, the sterling dropped as traders started to refocus on Brexit. Today, focus will turn to inflation numbers which will be released during the European session. Traders expect the numbers to show that consume prices in September rose by 2.6%. This will be lower than the 2.7% for August. On a MoM basis, the CPI is expected to drop from 0.7% to 0.2%. The core PPI is expected to be at 2.0%, which will be lower than August’s 2.1%.
This week, the euro has been little moved against the USD. This is most due to a lack of major economic and political news from the US and the EU but all could change today as traders receive important numbers from the US and EU. In the European session, Eurostat will release the CPI numbers for the region. Traders expect the data to show that the CPI rose by 2.1% in September. This will be in line with the growth in August. On a MoM basis, the CPI will rise to 0.5%. The core CPI will remain unchanged on an annual and monthly basis. Later in the day, the US will release important housing numbers. The housing starts are expected to fall from 1.282 million in August to 1.220M in September. September’s building permits are expected to increase by 2.1% on an annual basis.
EUR/USD
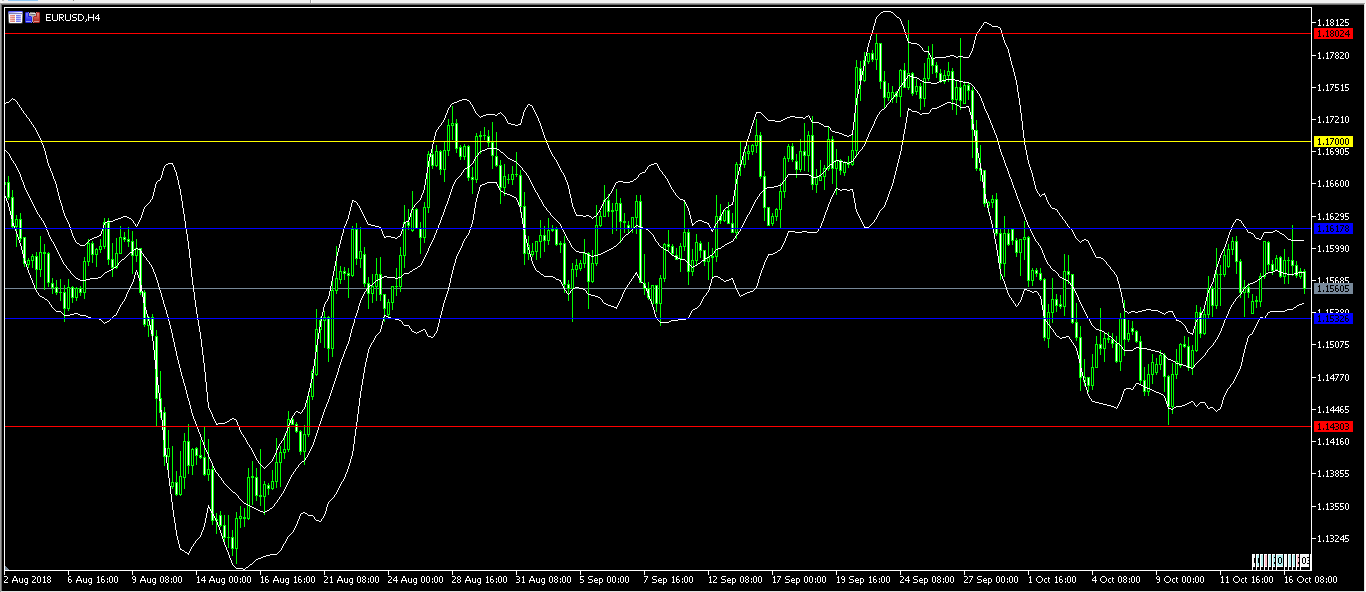
The EUR/USD pair has traded within a range this week as evidenced by the narrow range of the Bollinger Bands. This was after a rally that started on Tuesday last week when the pair moved from 1.1430. Since the pair is trading within a range, there is a possibility that a breakout will happen in either direction. An upward breakout will push the pair to the 1.1700 level while a downward breakout will see it reach the previous low of 1.1430.
GBP/USD
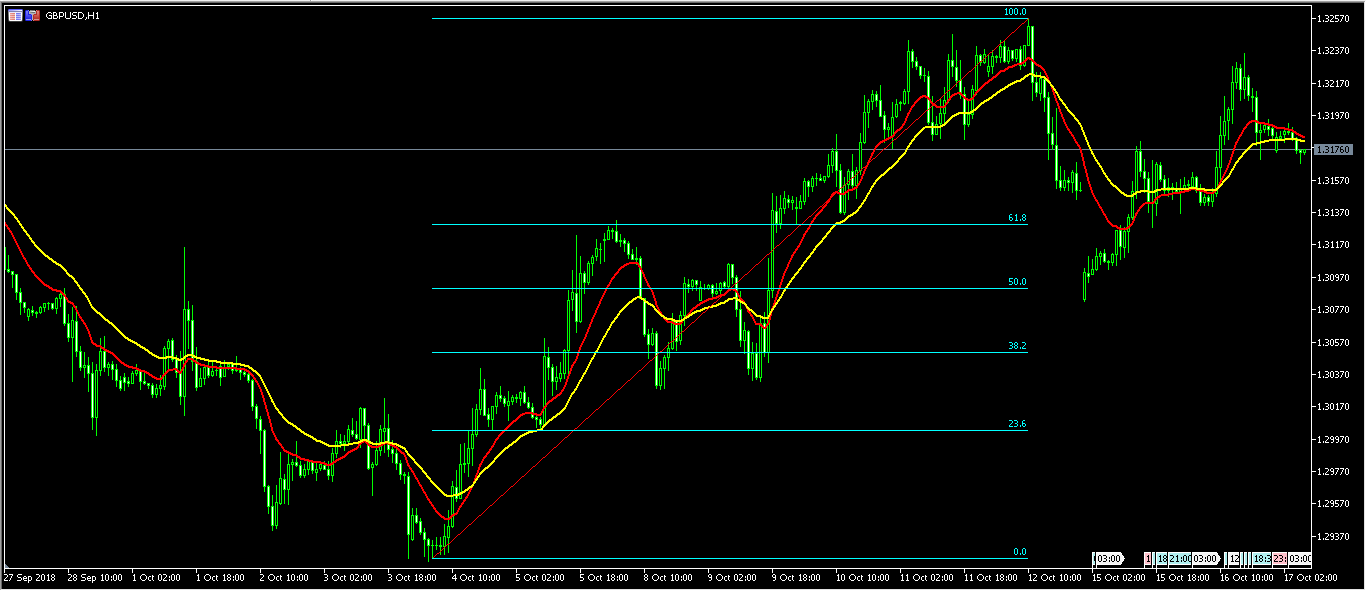
The GBP/USD pair declined to an intraday low of 1.3167 in the Asian session. This was as traders shifted their focus from employment numbers to Brexit negotiations. The pair is now trading at the 1.3174 level, which is slightly lower than the 14 and 28-day EMA. The two EMAs are starting a bearish crossover, which is an indication that the pair could continue the downward trend. If it does, it will likely move to the 1.3090 level, which is along the 50% Fibonacci Retracement level. However, traders should focus on the UK CPI numbers as they will play an important role on the pair.
XAU/USD
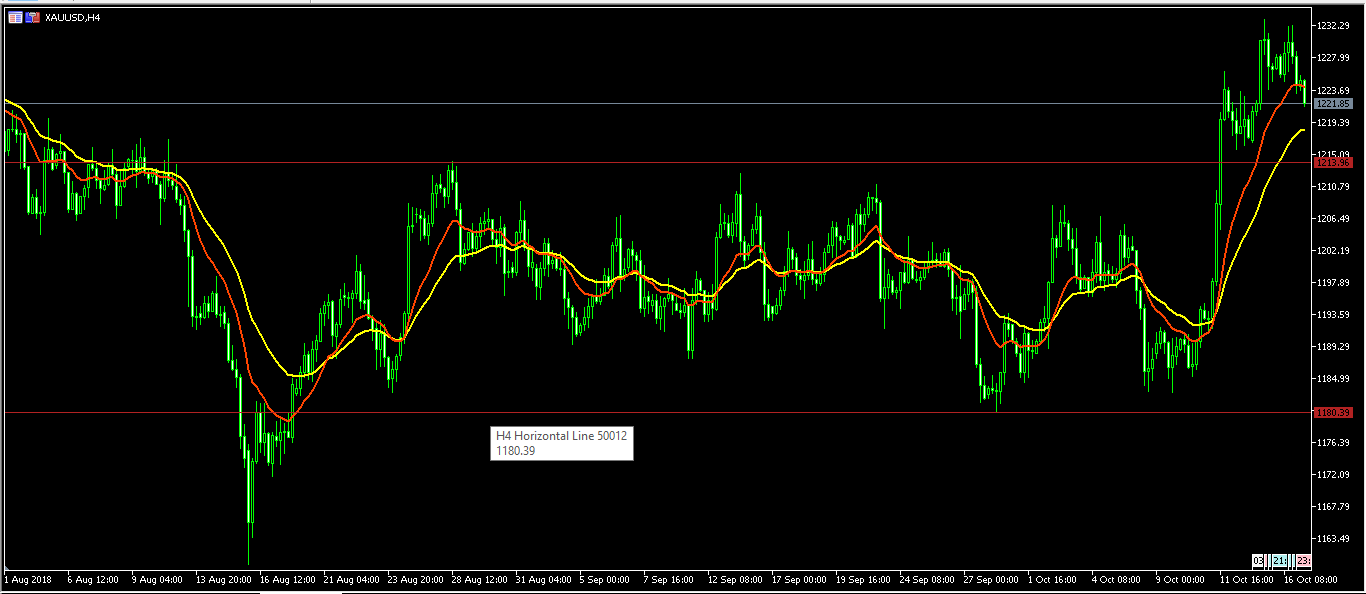
Last week, the XAU/USD pair jumped sharply to 1230, which was the highest level since July. This was as traders moved to safe havens following the worries of a slowed economic growth and high interest rates. This week, the pair has remained closer to these levels as the focus on global growth cools down. It is now trading at 1220, which is lower than the neckline of the head and shoulder pattern. This is an indication that the pair will likely continue to move lower. This is confirmed by the slow change of direction of the 14 and 28-day EMAs.
GBP/JPY Daily Outlook
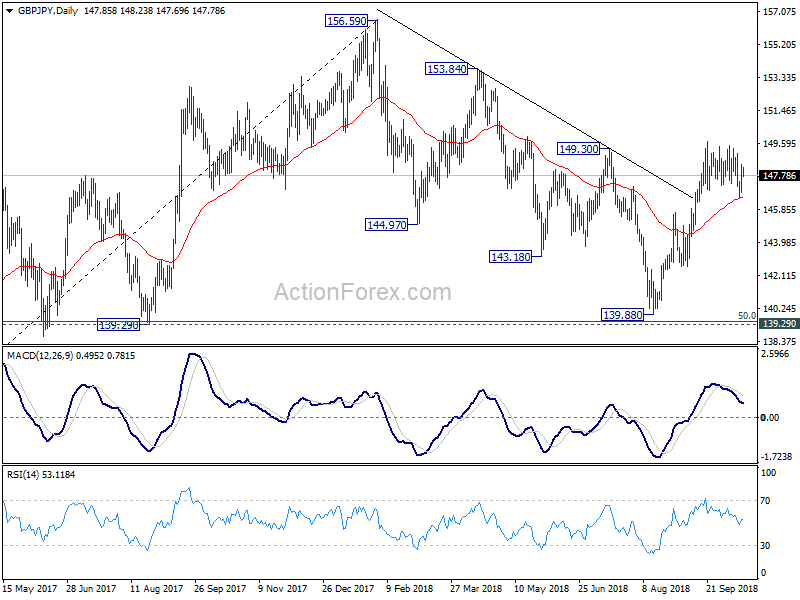
Daily Pivots: (S1) 147.12; (P) 147.76; (R1) 148.65; More...
GBP/JPY is staying in consolidation from 149.70 and intraday bias remains neutral. In case of another fall, outlook will remain cautiously bullish as long as 145.67 resistance turned support holds. On the upside, above 149.70 will target 153.84/156.69 resistance zone next. However, break of 145.67 will suggest that the rebound from 139.88 has completed and turn near term outlook bearish again.
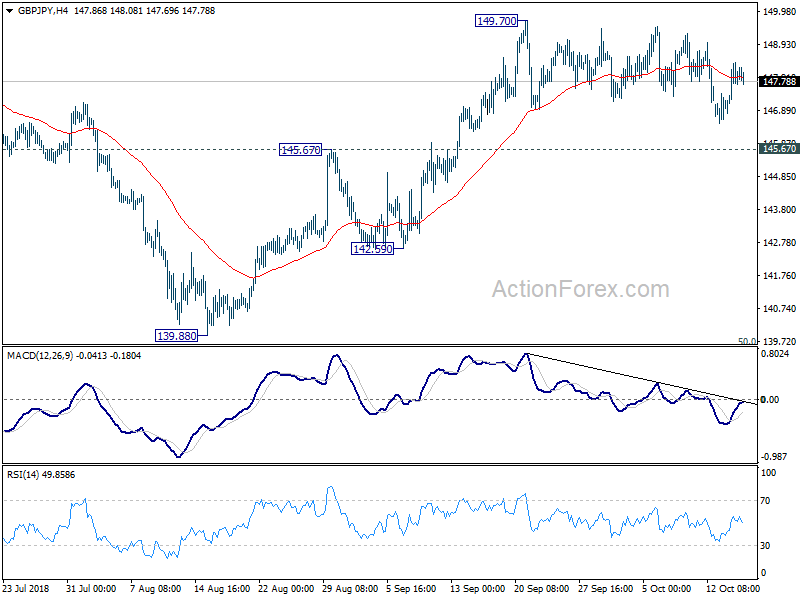
In the bigger picture, current development suggests that GBP/JPY has successfully defended 139.29 cluster support (50% retracement of 122.36 to 156.59 at 139.47). And, the rally from 122.36 (2016 low) is still intact. Such medium to long term rise would extend through 156.96 high. This will now be the preferred case as long as 145.67 near term support holds. However, break of 145.67 will turn focus back to 139.29/47 key support zone.