

Sample Category Title
Loonie Reverses Gains In The Morning Session
For the 24 hours to 23:00 GMT, the USD declined 0.39% against the CAD and closed at 1.2935.
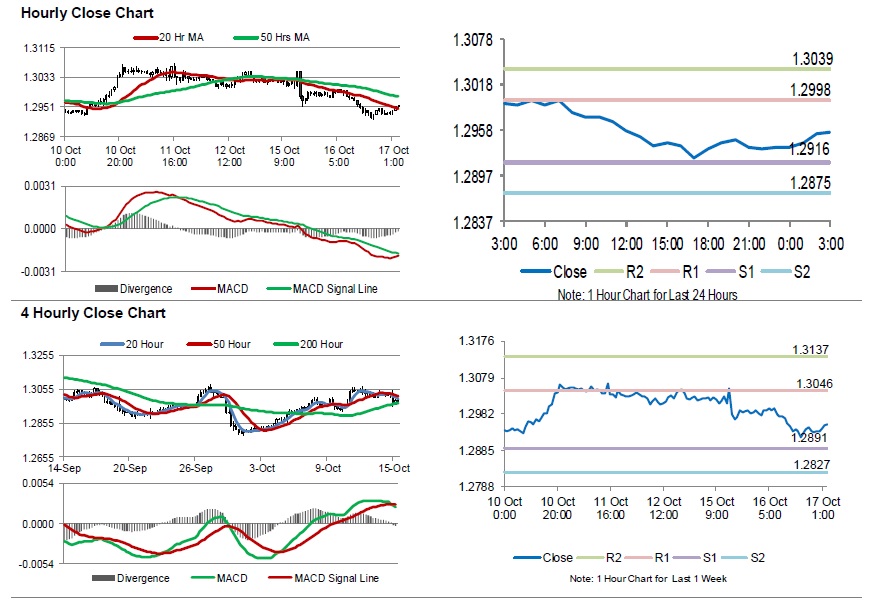
In the Asian session, at GMT0300, the pair is trading at 1.2956, with the USD trading 0.16% higher against the CAD from yesterday’s close.
The pair is expected to find support at 1.2916, and a fall through could take it to the next support level of 1.2875. The pair is expected to find its first resistance at 1.2998, and a rise through could take it to the next resistance level of 1.3039.
Trading trend in Canada today is expected to be determined by the release of Canada’s manufacturing sales for August, due later in the day.
The currency pair is showing convergence with its 20 Hr moving average and trading below its 50 Hr moving average.
Australia’s Westpac Leading Index Retreated In September
For the 24 hours to 23:00 GMT, the AUD rose 0.07% against the USD and closed at 0.7142.
LME Copper prices declined 1.5% or $94.0/MT to $6202.0/MT. Aluminium prices declined 0.3% or $6.0/MT to $2022.0/MT.
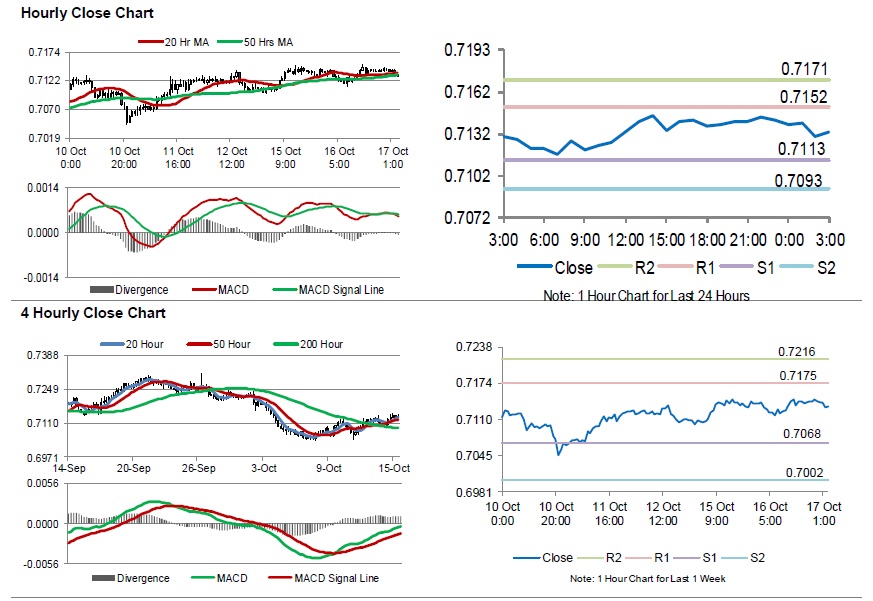
In the Asian session, at GMT0300, the pair is trading at 0.7133, with the AUD trading 0.13% lower against the USD from yesterday's close.
Overnight data showed that Australia's Westpac leading index slid 0.06% on a monthly basis in September. In the previous month, the index had recorded a revised rise of 0.03%.
The pair is expected to find support at 0.7113, and a fall through could take it to the next support level of 0.7093. The pair is expected to find its first resistance at 0.7152, and a rise through could take it to the next resistance level of 0.7171.
Moving forward, investors would await Australia's unemployment rate for September followed by 3Q NAB business confidence, set to release overnight.
The currency pair is showing convergence with its 20 Hr and 50 Hr moving averages.
Gold: Yellow Metal Trading On A Weaker Footing In The Morning Session
For the 24 hours to 23:00 GMT, Gold declined 0.19% against the USD and closed at USD1228.30 per ounce, amid broad strength in greenback dented demand of safe haven asset.
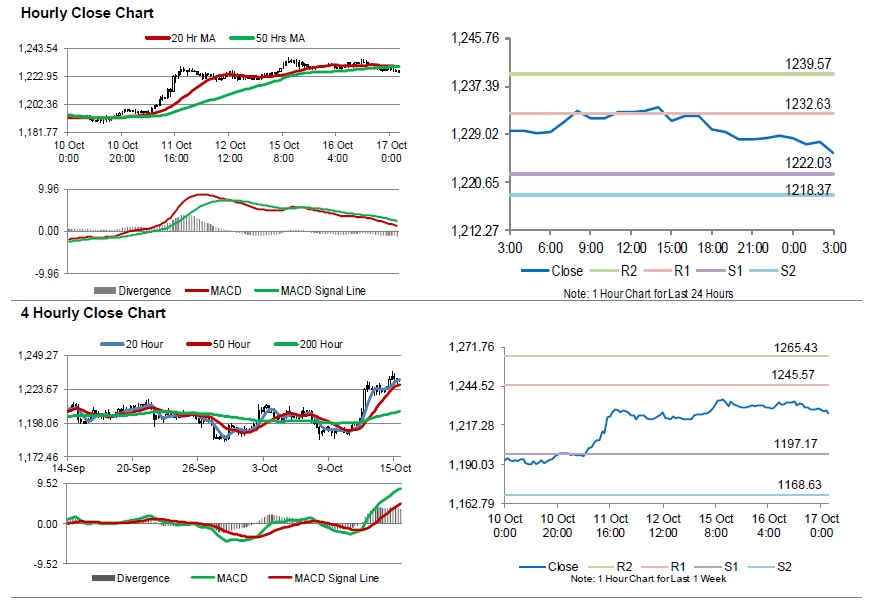
In the Asian session, at GMT0300, the pair is trading at 1225.70, with gold trading 0.21% lower against the USD from yesterday’s close.
The pair is expected to find support at 1222.03, and a fall through could take it to the next support level of 1218.37. The pair is expected to find its first resistance at 1232.63, and a rise through could take it to the next resistance level of 1239.57.
The yellow metal is trading below its 20 Hr and 50 Hr moving averages.
Silver: White Metal Trading Lower This Morning
For the 24 hours to 23:00 GMT, Silver declined 0.27% against the USD and closed at USD14.70 per ounce, tracking losses in gold prices.
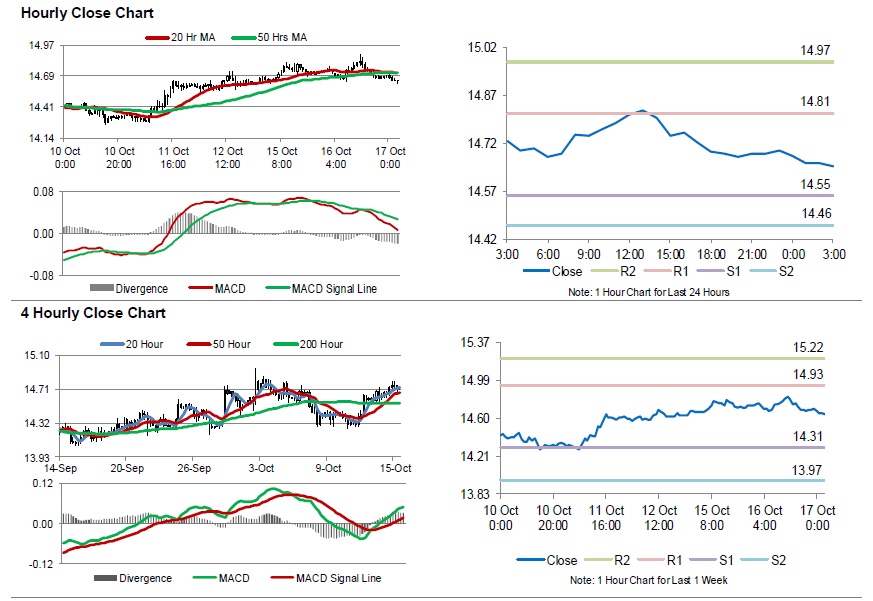
In the Asian session, at GMT0300, the pair is trading at 14.65, with silver trading 0.34% lower against the USD from yesterday’s close.
The pair is expected to find support at 14.55, and a fall through could take it to the next support level of 14.46. The pair is expected to find its first resistance at 14.81, and a rise through could take it to the next resistance level of 14.97.
The white metal is trading below its 20 Hr and 50 Hr moving averages.
Crude Oil: Oil Trading Lower, Ahead Of EIA’s Weekly Crude Oil Stockpiles Data
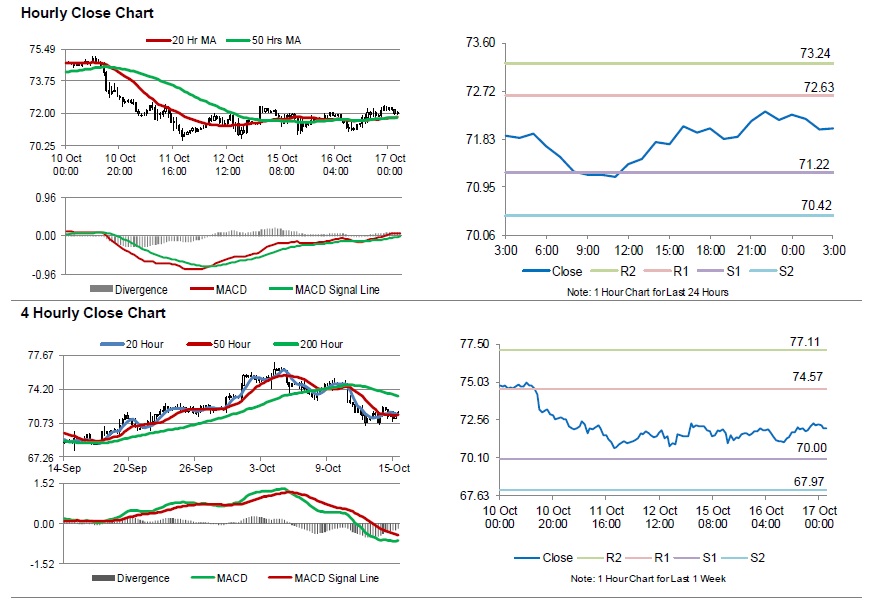
For the 24 hours to 23:00 GMT, Crude Oil rose 0.73% against the USD and closed at USD72.18 per barrel, amid supply concerns after the American Petroleum Institute reported that US crude oil inventories dropped by 2.1 million barrels to 415.1 million barrels in the week ended 12 October.
In the Asian session, at GMT0300, the pair is trading at 72.03, with oil trading 0.21% lower against the USD from yesterday's close.
The pair is expected to find support at 71.22, and a fall through could take it to the next support level of 70.42. The pair is expected to find its first resistance at 72.63, and a rise through could take it to the next resistance level of 73.24.
Going ahead, investors will keep a close watch on the weekly crude inventories data from the Energy Information Administration (EIA), due later in the day.
Crude oil is trading above its 20 Hr and 50 Hr moving averages.
RBA Debelle: Unemployment rate might drop further before material rise in wages groth
RBA Deputy Governor Guy Debelle welcomed the developments in the Australian labor market in a speech. He noted that "employment has grown strongly, the participation rate is close to its highest level on record and the unemployment rate has declined to be at a six-year low." And, that is "consistent with the above-trend GDP growth in the economy."
However, he also noted again there was "little" change in long term unemployment rate and "wages growth remains low". Above averaged demand for labor and growth in economy should "gradually reduce the spare capacity in the labour market." And that will lead to "gradual increase in wages growth and, in turn, inflation." But the extend and timing are uncertain. Unemployment rate could drop further than historical experience before material increases in wages growth.
Debelle also noted that the drag on the economy from lower house prices is still unclear and RBA is paying close attention.
Fed Daly favors gradual pace of monetary policy normalization
New San Francisco Fed President Mary Daly expressed her support to continued gradual rate hikes in her first remarks as monetary policy maker. She said the labor market is "booming" and inflation at the at 2% target. And, she explained that Fed might not want to go too slowly on rates and risking falling behind the curve. Her approach is consistent with Fed's and she favors "a gradual pace of normalization."
Daly also used the analogy that "you put a toe in the water and see how much of a ripple it makes". And, "the FOMC just raised rates in September, and we're now in the watching phase -- what's going on in the economy, how does it react."
She also tried to talk down last week's stock market crash. She said "a correction in the stock market where it comes down a little bit is not necessarily a worrisome thing."
Trump called Fed his biggest threat but added he’s not blaming anybody
Trump escalated his attack on Fed yesterday by falling it his "biggest threat", "because the Fed is raising rates too fast". Though, he repeated that Fed is "independent" and he "don't speak to " Fed chair Jerome Powell. But he also expressed that "I'm not happy with what he's doing because it's going too fast. Because – you look at the last inflation numbers, they're very low."
Trump also added "Can I be honest? I'm not blaming anybody, I put him there", referring to Powell. "And maybe it's right, maybe it's wrong. But I put him there."
Markets had little reaction to Trump's words so far.
USD/CAD At Risk Of More Declines Below 1.2920
Key Highlights
- The US Dollar failed to break the 1.3070 resistance and declined against the Canadian Dollar.
- USD/CAD broke a major bullish trend line with support at 1.3010 on the 4-hours chart.
- The US Industrial Production in Sep 2018 increased 0.3%, similar to the forecast.
- Today, the Euro Zone CPI for Sep 2018 will be released, which is forecasted to increase 2.1% (YoY).
USDCAD Technical Analysis
The US Dollar remained in a decent uptrend above 1.3000 until it faced a strong resistance near 1.3070 against the Canadian Dollar. As a result, the USD/CAD pair started a downside move and declined below 1.3000.
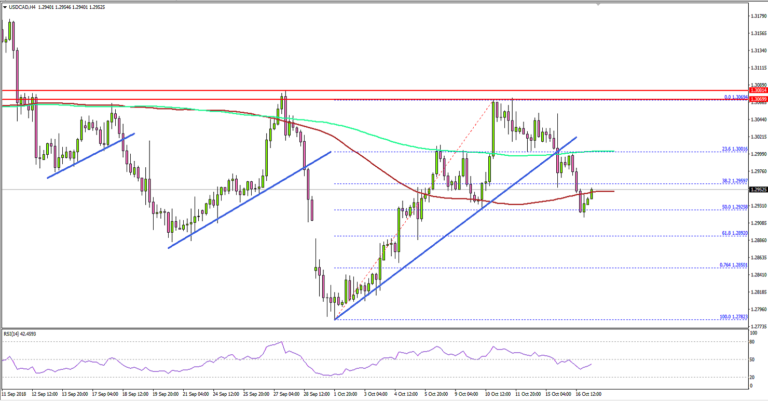
Looking at the 4-hours chart, the pair clearly failed on a few occasions to break the 1.3070-1.3080 resistance. It declined and broke the 23.6% Fib retracement level of the last wave from the 1.2782 low to 1.3069 high.
More importantly, the pair broke a major bullish trend line with support at 1.3010 on the 4-hours chart. Additionally, there was a close below the 1.3000 support and the 200 simple moving average (green, 4-hours).
On the downside, the next important support is at 1.2920 and the 50% Fib retracement level of the last wave from the 1.2782 low to 1.3069 high. If there is a break below 1.2920, the pair could move into a bearish zone and it might decline towards 1.2850.
On the other hand, if there is an upward move, the pair needs to clear the 1.3000 resistance and the 200 SMA to revisit the 1.3070 resistance zone.
Fundamentally, the US Industrial production report for Sep 2018 was released by the Board of Governors of the Federal Reserve. The market was looking for a rise of around 0.3% in the production compared with the previous month.
The actual result was similar to the forecast, but it was less than the last increase of 0.4%. Looking at the total industrial production at an annual rate, there was a rise of 3.3% in September 2018.
The report added that:
Output growth in September was held down slightly by Hurricane Florence, with an estimated effect of less than 0.1 percentage point.
Overall, the US Dollar may continue to move down and pairs like EUR/USD and GBP/USD could benefit in the short term.
Economic Releases to Watch Today
- UK Consumer Price Index Sep 2018 (YoY) – Forecast +2.8%, versus +2.7% previous.
- UK Core Consumer Price Index Sep 2018 (YoY) – Forecast +1.8%, versus +2.1% previous.
- Euro Zone CPI for Sep 2018 (YoY) – Forecast +2.1%, versus +2.1% previous.
- Euro Zone CPI for Sep 2018 (MoM) – Forecast +0.2%, versus +0.2% previous.
- US Housing Starts Sep 2018 (MoM) – Forecast 1.237M, versus 1.282M previous.
- US Building Permits Sep 2018 (MoM) – Forecast 1.280M, versus 1.229M previous.
Market Morning Briefing: Euro Again Came Off After Testing A High Near 1.1622 Yesterday
STOCKS
The stock indices have all risen sharply from support levels and look bullish for the near term.
Dow (25798.42, +2.17%) rose sharply yesterday to our expected levels. Near term looks bullish with the current rise to possibly continue towards 26000-26500 in the coming sessions.
Dax (11776.55, +1.40%) has also risen sharply yesterday. The bulls seem to be taking control gradually and the upside momentum if continues could take the index higher towards 12000 by next week.
Nikkei (22907.73, +1.59%) saw a gap up opening today, bouncing sharply from support levels near 22200. While the rise continues, we could see a test of 23400-23600 again in the near term.
Shanghai (2560.72, +0.57%) is above 2530 and has not seen a bounce yet.While the other major indices have risen and look bullish for the near term, Shanghai could eventually pick up in the coming weeks. Some range trade in the 2500-2650 region is possible followed by a rise back to 2700.
Nifty (10584.75, +0.69%) continued to move up yesterday. A test of 10800 is likely in the near term. A small corrective dip could be seen from 10800-10900 region.
COMMODITIES
Watch support on the Crude prices. Near term could be ranged above the support levels. Gold could dip slightly while below 1240.
Brent (81.50) has interim support at 80 which is holding for now keeping the price ranged below 82. While above 80, Brent could possible trade in the 80-82 region this week. But thereafter, if the crude price comes off below 80 or rises towards 84 would be important to keep an eye on. For now, there are equal possibilities of moving on either side of the 80-82 range.
WTI (72.04) too is holding above the 71 support and could move up gradually towards 73-74. Although there is scope on the downside to test 68 on the weekly charts, it would be crucial to see if the support at 71 breaks in the near term.
Gold (1225.40) is testing immediate resistance near 1240 on the daily candle chart. Also there is 21-Week MA on the weekly line chart which could keep the prices low in the near term. While the resistance at 1240 holds, we could see a short dip towards 1210 before again attempting to rise higher.
Copper (2.7690) continues to remain stable and could trade within the 2.75-2.85 region this week too. No major movement is expected just now.
FOREX
Dollar Rupee could fall more towards 73.20-00. Watch supports near 1.1535 and 1.30 on Euro and Pound respectively.
Euro (1.1561) : Euro again came off after testing a high near 1.1622 yesterday. While it stays above 1.1540-1.1535, it could still rise beyond 1.162 towards resistance near 1.17 by next week. A break below 1.1535 could make it bearish towards 1.145.
Dollar Index (95.20) - While below 95.35, there are chances of testing support near 94.75 in the next 2-3 sessions. Alternatively, if it breaks above 95.35, we can again start looking at the upside.
Dollar Yen (112.38) has broken above the 112.20 resistance level we mentioned yesterday and it could now rise towards 113 by next week (seen as interim resistance on daily line chart).
Euro-Yen (129.97) could stay below 130.5 in the next couple of sessions. While Euro stays above 1.154 and Dollar Yen above 112, Euro Yen would find it difficult to break below 129.13 (necessary for bearishness towards 127).
Pound's (1.3178) almost tested resistance near 1.324 on daily candles yesterday and could now come off towards 1.31. A break below 1.31 could open up chances of a test of support near 1.30 in the near term. A break below 1.30 (if it happens) would be bearish.
Aussie (0.7133) has some resistance near the 8 weeks MA (0.7158). If it crosses above that, it should test higher resistance near 0.7175-0.7200 by next week. A break above 0.72 and then above 0.7321 (21 weeks MA) would be required to negate the possibility of a downside below 0.705 in the next 1-2 months.
Dollar Rupee (73.455): Should now fall towards 73.20-00 in the near term. A break above 1.162 on Euro or below 80 on Brent could be Rupee positive.
INTEREST RATES
India 10 year yield (7.8727%) has broken below the support at 7.90%. It could now fall further towards lower support near 7.80%-7.70% in the near term.
The US 10 Year (3.17%) : The US 10 year yield is currently staying above immediate support near 3.15%. Below 3.15%, even 3.10% could provide some support. While above 3.10%, there are chances of a rise towards the previous high of 3.25%-3.26%.
US Industrial production increased 0.3% in Sep, in line with expectations (this is the 4th straight month of increase). However, the 3rd quarter growth in Industrial production of 3.3% (annualized) is much lesser than the 5.3% growth in the 2nd quarter.
Moreover, Capacity Utilization stayed unchanged at 78.1% slightly below the expected 78.2%.
Earlier on Monday, US Retail Sales data had showed that the growth in Sep (0.1%) was much lower than the expected 0.6%.
These 3 data points could have had some bearish impact on yields but two other factors seem to be keeping yields elevated
increased supply of US treasury bonds
US jobs report released yesterday showing job openings at a record high, indicating further tightening in the job market
We need to watch out for further more data releases on the US economy in the next couple of weeks and also developments on the trade war front. Any disappointment in economic growth indicators or a rise in trade war rhetoric could pull yields lower, increasing chances of a break below 3.15% on the US 10 year.
10 Year German-US spread (-2.68%) – As mentioned yesterday, there is immediate resistance near -2.60% to -2.65% and support near -2.725%. It could move towards -2.725% by next week. Medium term preference remains for a break below -2.725% towards lower long term support near -2.80%. A break above -2.60% would however negate the medium term bearishness.
2 Year German-US spread (-3.44%) is also at support on short term chart. A break below this level could be bearish.