Sample Category Title
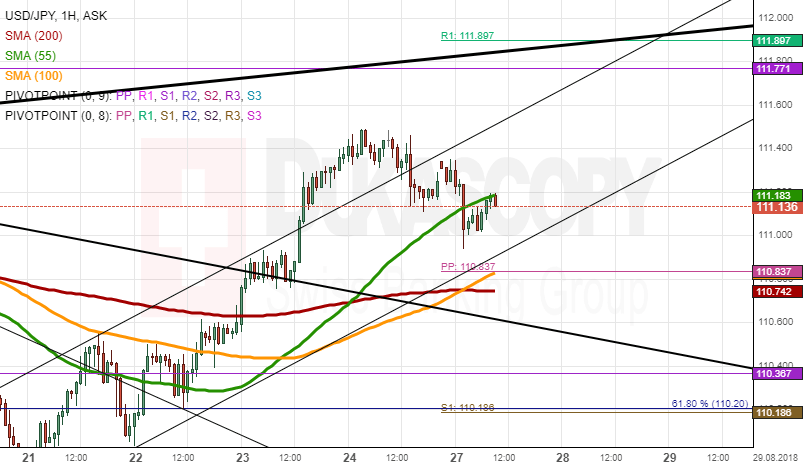
USDJPY Analysis: Returns Back To Trend Line
On Monday morning, the US Dollar appreciated against the Japanese Yen fitting back into the existing trend line. The currency pair passed the weekly PP (110.83) during the Friday's trading session. USD/JPY is fluctuating in the range between the 110.90 and 111.50, waiting for the conformation.
The 100-hour and 200-hour SMAs have crossed during today's trading session early in the morning, flashing strong bullish signals for traders. The 55-hour SMA is taking a role of the resistance level at 111.17, giving a pull-back to touch the bottom boundary of the trend line.
XAUUSD Analysis: Bounces Off Medium Resistance
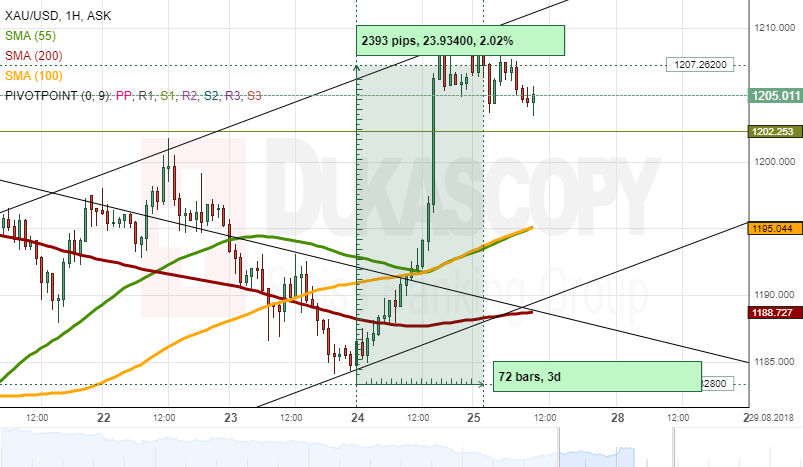
Gold weakened against the US Dollars on Monday morning, but the yellow metal has appreciated 2.02% against the US Dollar during the Friday's trading session showing strong uptrend movements during the day. During Monday's morning hours, Gold was at 1,204.69, just above the monthly S1 (1,202.25) as support level to recover itself.
The 55-hour and 100-hour SMAs have crossed at midnight hours and keep moving together. Such movements may flash strong bullish signals for traders. The nearest support level is the monthly S1 at 1,202.25, while the nearest resistance level is the monthly PP at 1,234.16.
AUD/CAD 4H Chart: Short-Term Surge Still Expected
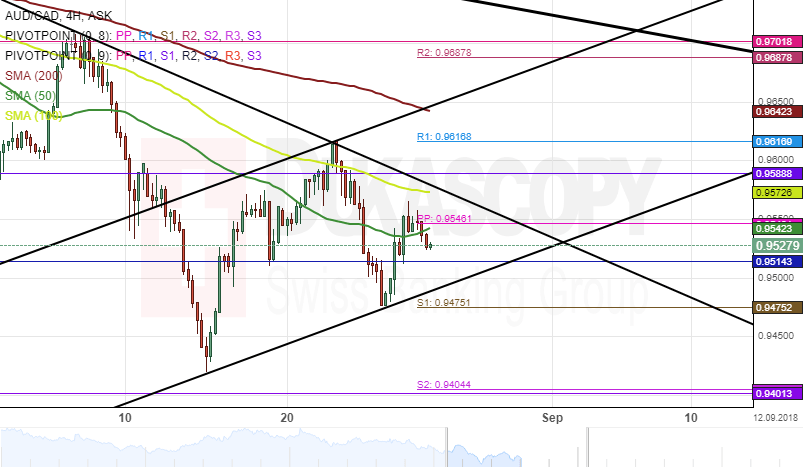
The AUD/CAD currency pair has been trading in a downtrend line since mid-June. The Aussie reversed from the upper boundary of a dominant descending channel on June 22 and had since reached a two-year low level.
However, the exchange rate has formed a new junior ascending channel, which is currently guiding the pair higher. The price tested the 55-hour simple moving average during the morning hours on Monday.
Everything being equal, it is likely that the currency exchange rate continues to move in the newly formed junior ascending channel until it reaches the 200-hour SMA during the following trading sessions
AUD/JPY 4H Chart: Meets Support Cluster
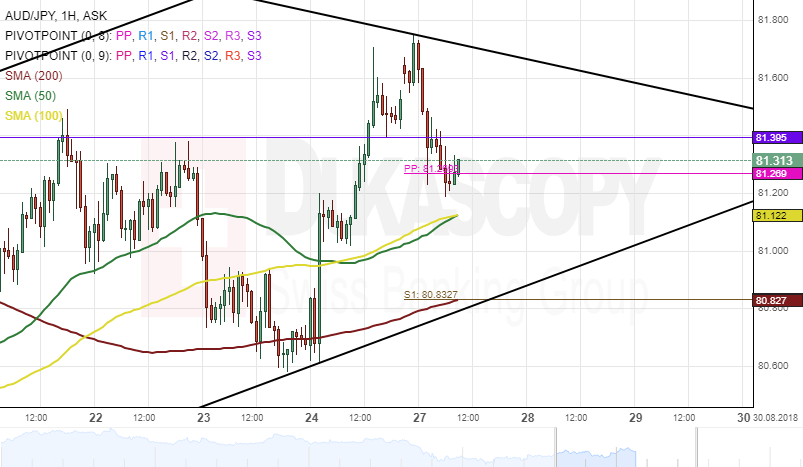
Australian Dollar began appreciating against the Japanese Yen mid-August when it reversed from the lower boundary of a junior ascending channel at 79.70. The rate reached a three-week high on Friday.
The Aussie is currency testing the weekly and the monthly pivot points near 81.26. If this support cluster remains intact during the following trading sessions, it is likely that the pair continues appreciating towards the upper boundary of a downtrend line.
Given that the 55-, 100-, and 200-hour simple moving averages are below the price, it is likely that the bullish momentum continues during the following hours.
USD Stabilises Lower Amid Disappointing Jackson Hole Meeting
US concerns are trade and housing
Two concerns pose downside risk to the optimistic outlook of the US Federal Reserve Bank. First is trade tension. America imposed tariffs on $16 billion of Chinese imports and China quickly retaliated. Yet a breakthrough in NAFTA negotiation between Mexico and the US seems likely. Second, US consumers are experiencing lower affordability of key assets like housing and cars. Both are highly sensitive to changes in interest rates.
Markets expect 0.2% monthly for July’s core PCE inflation report, pushing the annual rate to 2.0% from 1.9% previously. Personal income and spending for July should remain steady indicating that economic momentum is slowing. US yield curves remains flat (US 10-year at 2.80%). USD is range bound, but EUR/USD will need a clear driver to break through 1.1650. Good news or a hawkish European Central Bank would be catalysts; an Italian veto of the EU immigration budget would push the other way.
The Fed’s annual economic symposium in Jackson Hole, Wyoming, is fading in relevance. Despite hype of Fed Chairman Jerome Powell providing an off the reservation speech and rebuttal of Trump interventionism polices, he stayed on script. He defended the gradual path for tighter money: 0.25% hikes in September and December.
Indian rupee eases
At record highs, USD/INR is trading sideways since its rise above 70 in mid-August, easing back to 69.91 last Friday as US Federal Reserve Chairman Jerome Powell confirmed a “slow and gradual” pace of rate hikes, thus softening the USD. Additionally, trade talks between China and the US contributed to a risk-on sentiment.
To publish on Friday, Indian Q2 GDP is expected to remain solid and above the 7% range (prior: 7.70%) off a weak base from last year. The Reserve Bank of India (RBI) will most certainly maintain its hiking path, raising interest rates to 6.75% by the end of the year after two rises of 0.25% in 2018. As industry remains solid due to strong domestic demand, inflation continues to accelerate, which points to further tightening by the end of the year. We expect the rupee to benefit. Key risks for INR remain its sensitivity to increasing energy prices as well as global risk-off sentiment. USD/INR is expected to trade sideways along 70 in the short-term.
The Analytical Overview Of The Main Currency Pairs
The EUR/USD currency pair
Technical indicators of the currency pair:
Prev Open: 1.15367
Open: 1.16160
% chg. over the last day: +0.73
Day's range: 1.15963 – 1.16111
52 wk range: 1.0571 – 1.2557
On Friday, the bullish sentiment was observed on the EUR/USD currency pair. The growth of quotes was almost 100 points. Investors assess the comments by the Federal Reserve chairman at a symposium in Jackson Hole. The trade conflict between the US and China is still in the focus of attention. At the moment, local support and resistance levels are 1.15850 and 1.16300, respectively. We recommend opening positions from these marks. In the near future, technical correction is not ruled out.
The news feed on 2018.08.27:
IFO business climate index in Germany at 11:00 (GMT+3:00).
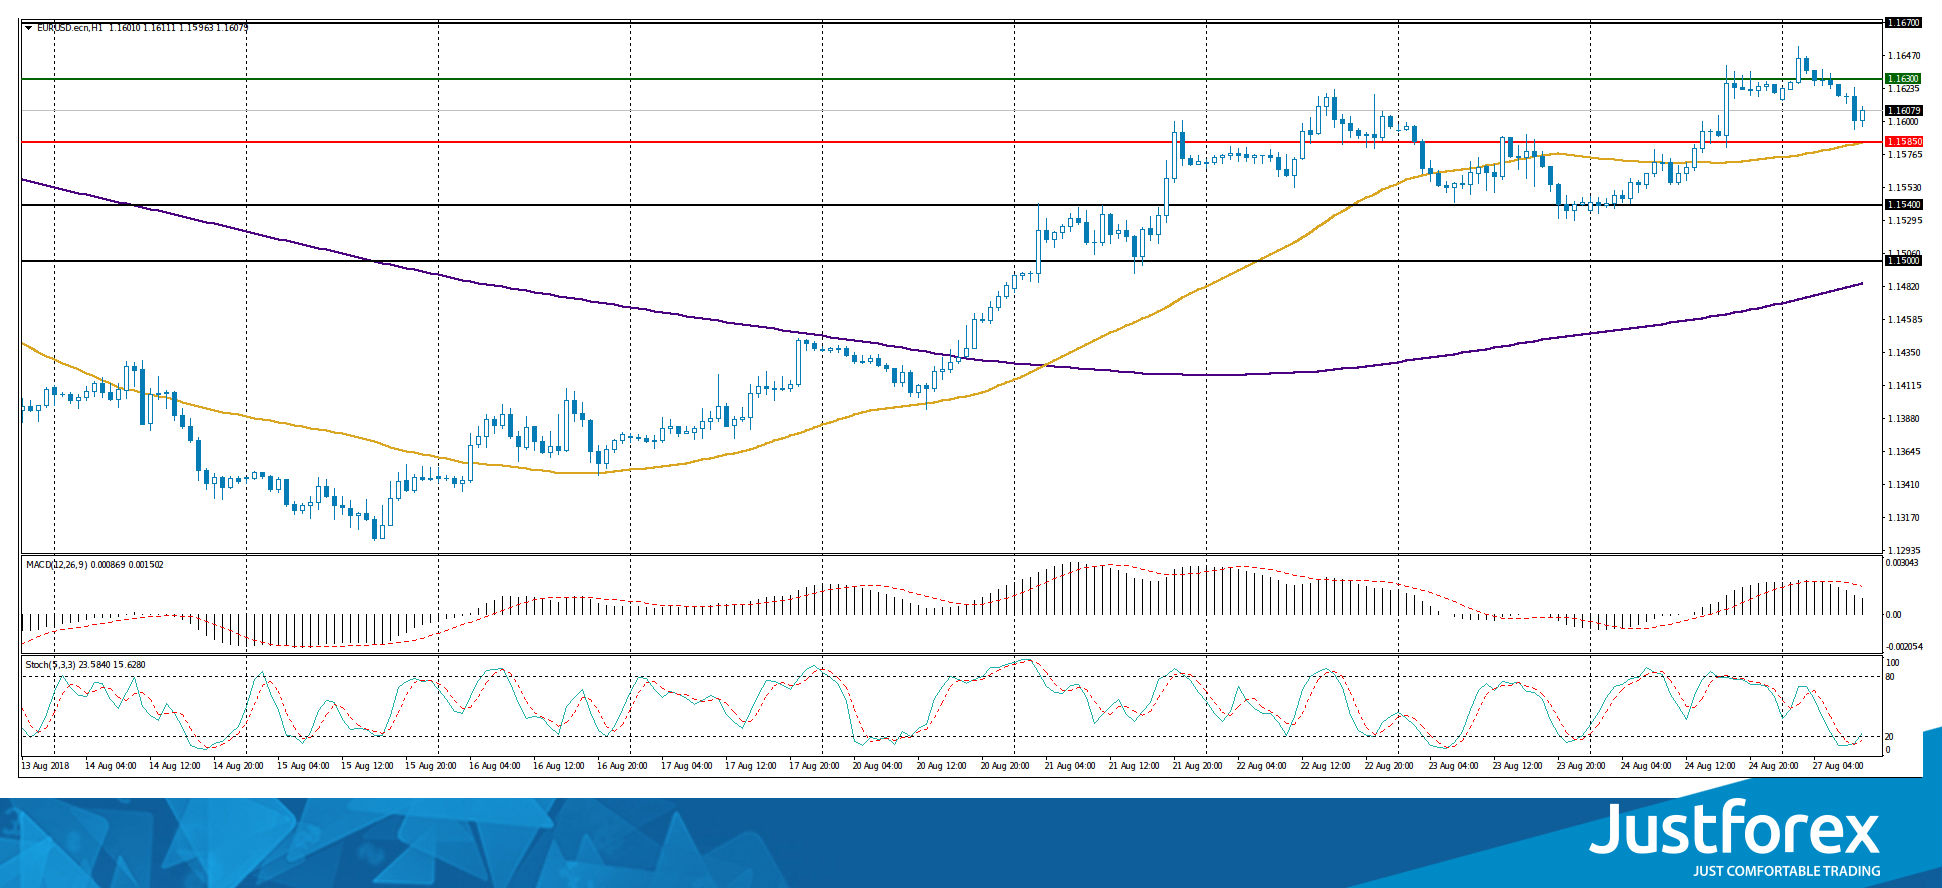
Indicators point to the power of buyers: the price has fixed above 50 MA and 200 MA.
The MACD histogram is located in the positive zone, but below the signal line, which gives a weak signal to buy EUR/USD.
Stochastic Oscillator is in the oversold zone, the %K line is crossing the %D line. There are no accurate signals.
Trading recommendations
Support levels: 1.15850, 1.15400, 1.15000
Resistance levels: 1.16300, 1.16700
If the price fixes above the resistance level of 1.16300, further growth of the EUR/USD currency pair is expected. The movement is tending to 1.16700-1.17000.
Alternative option. If the price fixes below the support level of 1.15850, we recommend considering sales of EUR/USD. The movement is tending to 1.15400-1.15000.
The GBP/USD currency pair
Technical indicators of the currency pair:
Prev Open: 1.28097
Open: 1.28370
% chg. over the last day: +0.36
Day's range: 1.28345 – 1.28517
52 wk range: 1.2361 – 1.4345
On Friday, the GBP/USD quotes slightly strengthened. At the moment, the technical pattern is ambiguous. Investors expect additional drivers. Local support and resistance levels are 1.28200 and 1.28600, respectively. The positions should be opened from these marks. A trading instrument is tending to grow.
The financial markets of the UK are closed due to the holiday.
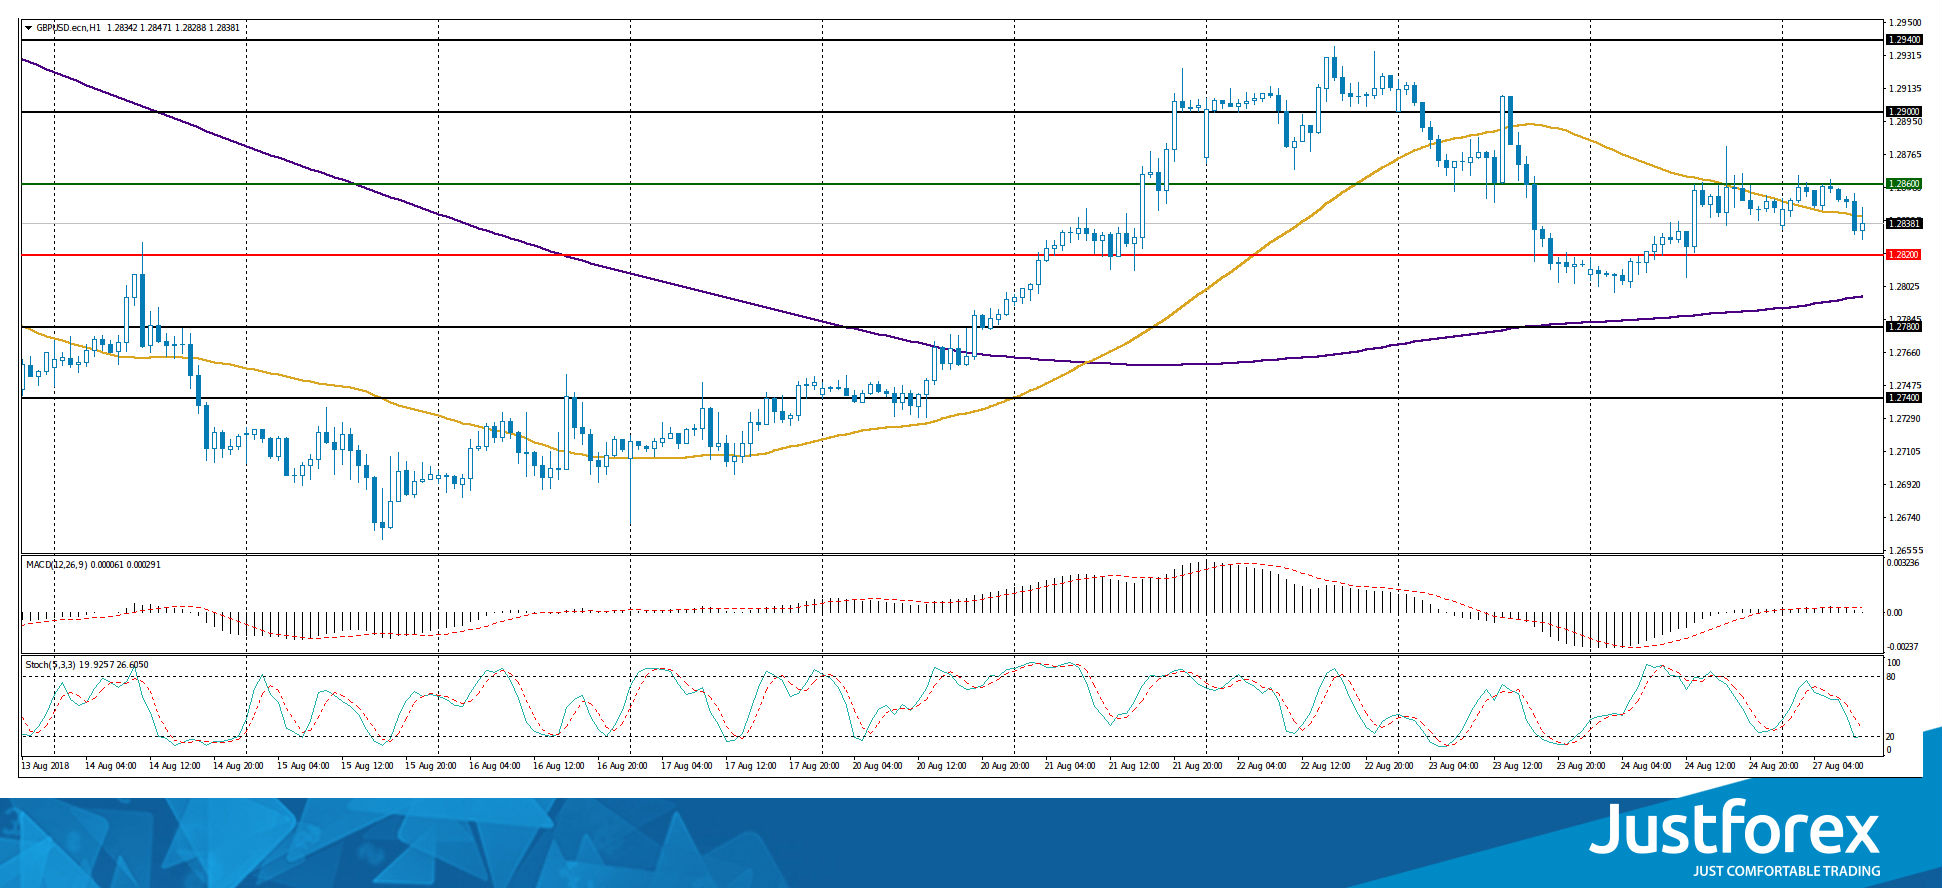
Indicators do not send accurate signals: the price has crossed 50 MA.
The MACD histogram is near the 0 mark.
Stochastic Oscillator is located near the oversold zone, the %K line is below the %D line, which gives a weak signal to sell GBP/USD.
Trading recommendations
Support levels: 1.28200, 1.27800, 1.27400
Resistance levels: 1.28600, 1.29000, 1.29400
If the price fixes above 1.28600, the GBP/USD currency pair is expected to grow. The target movement level is 1.29000-1.29400.
Alternative option. If the price fixes below 1.28200, we recommend considering sales of GBP/USD. The target movement level is 1.27800-1.27400.
The USD/CAD currency pair
Technical indicators of the currency pair:
Prev Open: 1.30788
Open: 1.30135
% chg. over the last day: -0.41
Day's range: 1.30122 – 1.30245
52 wk range: 1.2059 – 1.3795
On Friday, aggressive sales of USD/CAD were observed. The decrease in quotes was almost 100 points. At the moment, the trading instrument is recovering. Local support and resistance levels are 1.30100 and 1.30400, respectively. We recommend opening positions from these marks. The trading instrument has the potential for further fall.
The news feed on the economy of Canada is calm.
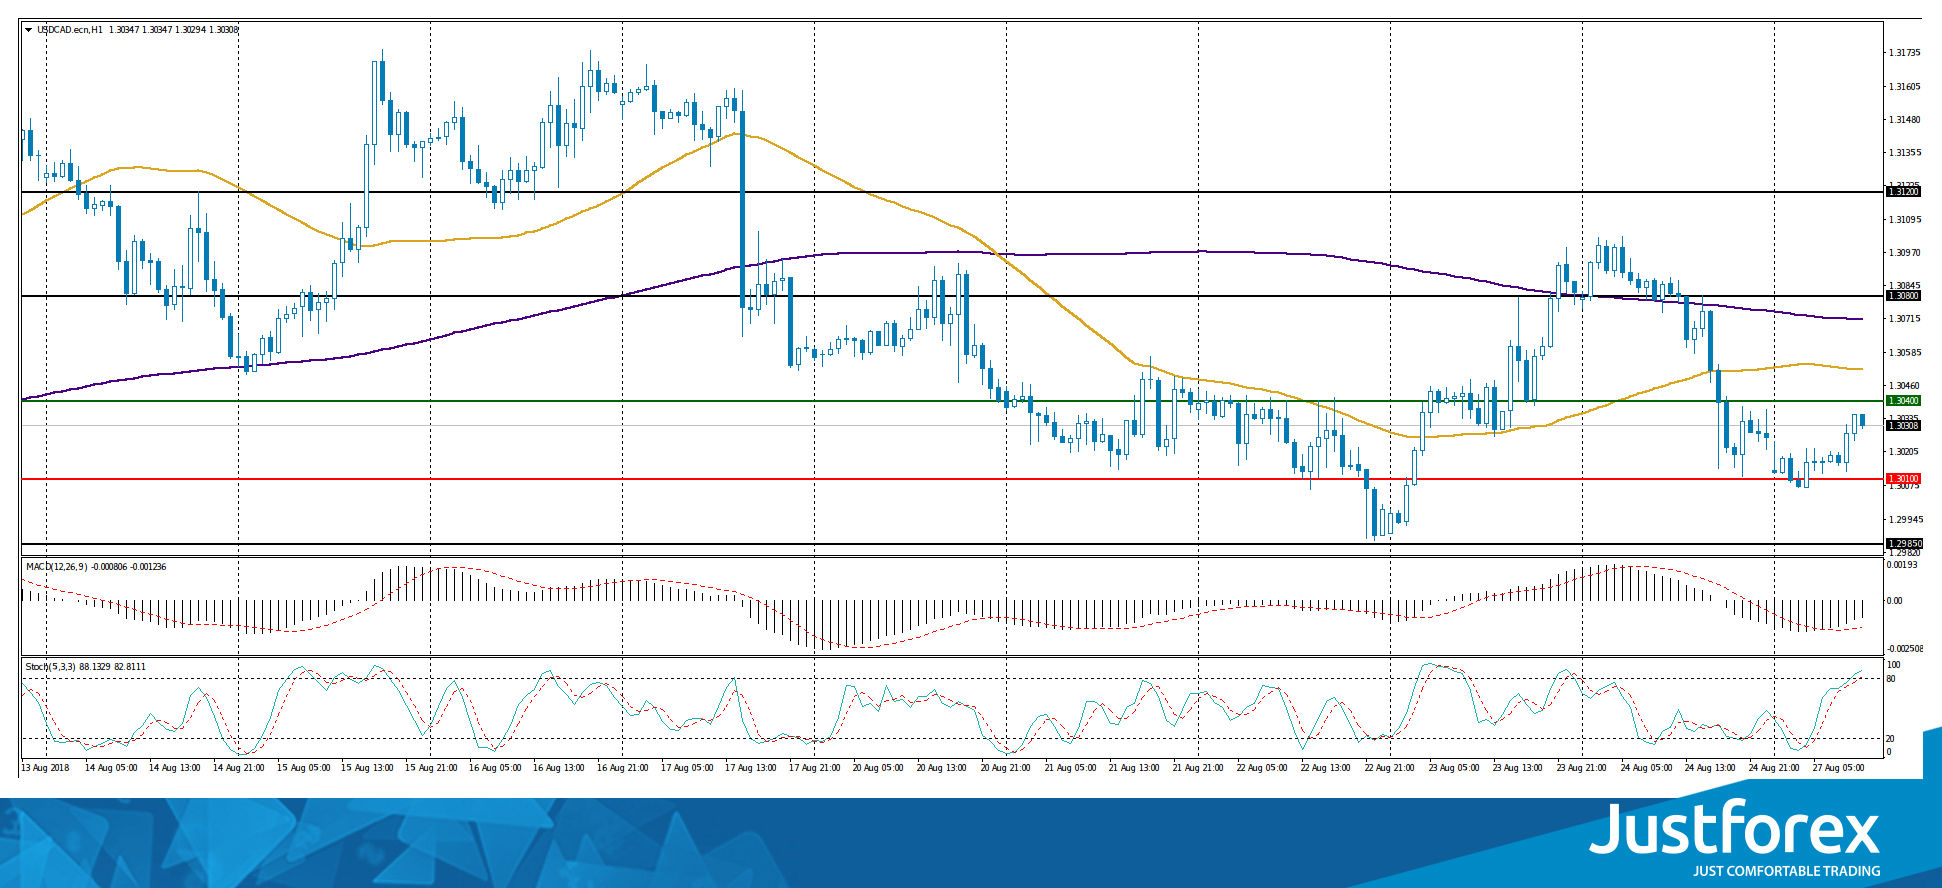
The price has fixed below 50 MA and 200 MA, which indicates the power of sellers.
The MACD histogram is in the negative zone, but above the signal line, which gives a weak signal to sell USD/CAD.
Stochastic Oscillator reached the overbought zone, the %K line is above the %D line, which gives a weak signal to buy USD/CAD.
Trading recommendations
Support levels: 1.30100, 1.29850
Resistance levels: 1.30400, 1.30800, 1.31200
If the price fixes below 1.30100, further decrease of the USD/CAD quotes is expected. The movement is tending to 1.29850-1.29500.
Alternative option. If the price fixes above the resistance of 1.30400, it is necessary to consider purchases of USD/CAD. The movement is tending to 1.30700-1.30900.
The USD/JPY currency pair:
Technical indicators of the currency pair:
Prev Open: 111.229
Open: 111.314
% chg. over the last day: -0.06
Day's range: 111.117 – 111.156
52 wk range: 104.56 – 114.74
On Friday, a variety of trends was observed on the USD/JPY currency pair. At the moment, the technical pattern is ambiguous. Investors expect additional drivers. The key support and resistance levels are 111.000 and 111.250, respectively. The positions should be opened from these marks. In the near future, a technical correction is not ruled out.
The news feed on the economy of Japan is calm.
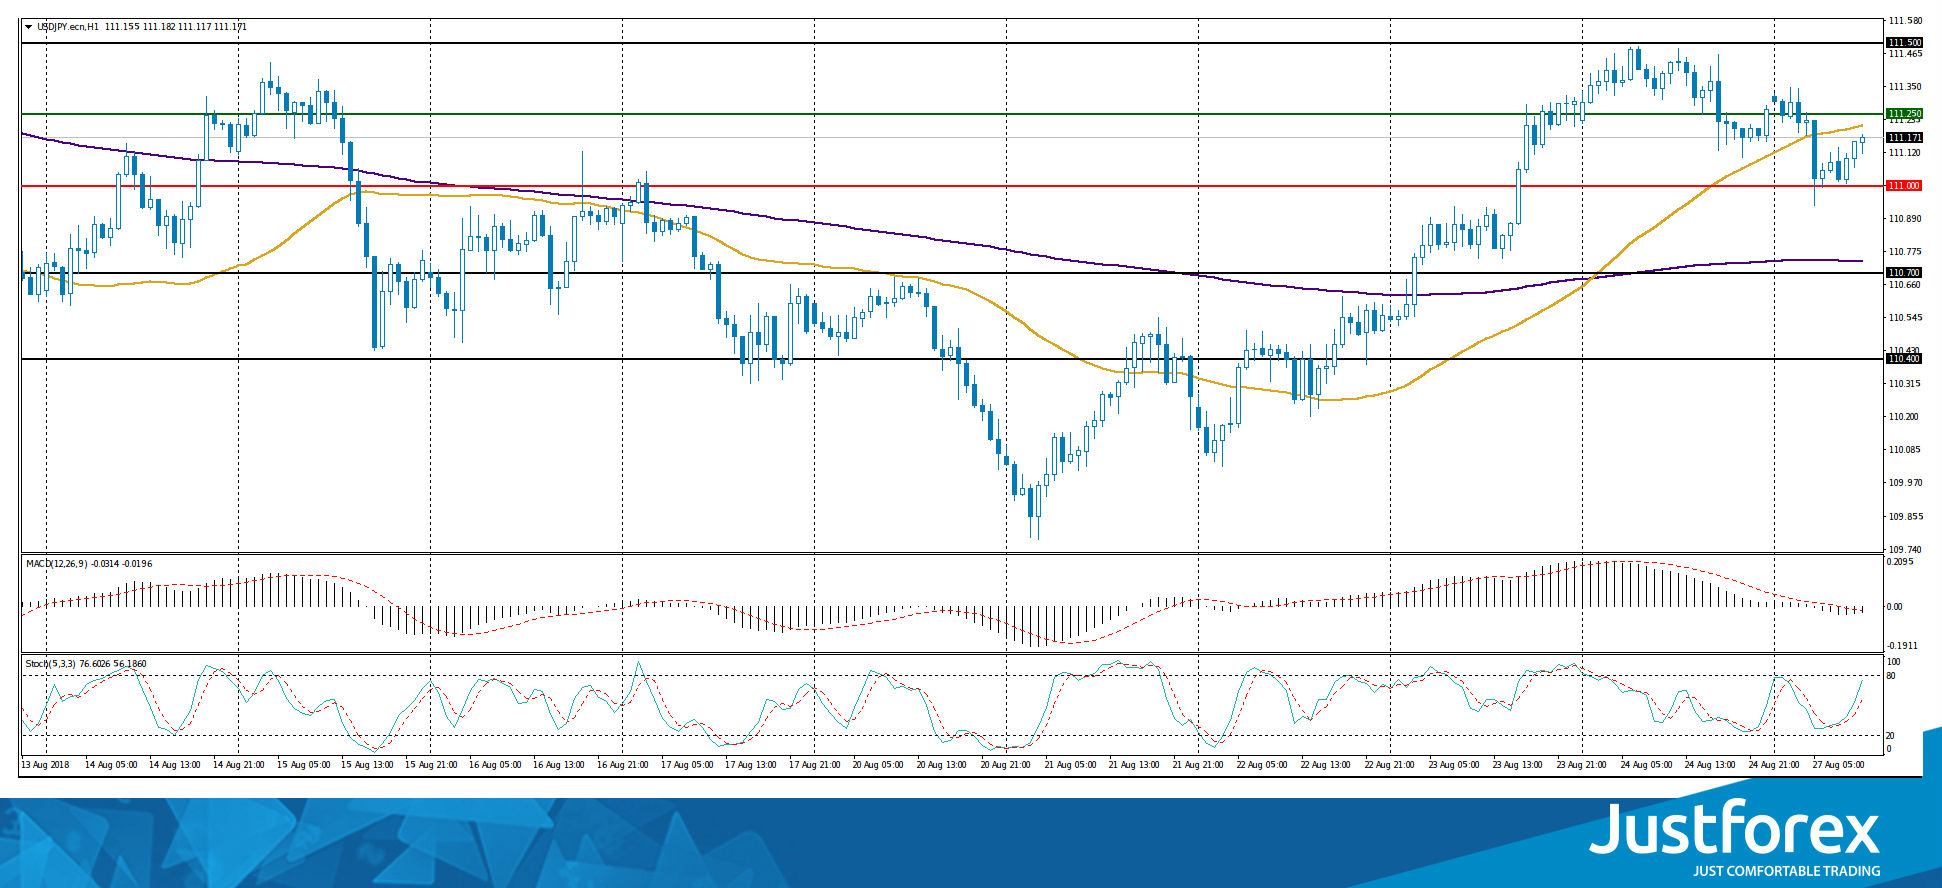
Indicators do not send accurate signals: the price is between 50 MA and 200 MA.
The MACD histogram has moved into the negative zone, which signals the power of sellers.
Stochastic Oscillator is located in the neutral zone, the %K line is above the %D line, which indicates the growth of quotes.
Trading recommendations
Support levels: 111.000, 110.700, 110.400
Resistance levels: 111.250, 111.500
If the price fixes above the resistance level of 111.250, it is necessary to consider purchases of USD/JPY. The movement is tending to 111.500-111.700.
Alternative option. If the price fixes below 111.000, the correction of the USD/JPY currency pair is expected. The movement is tending to 110.700-110.500.
The Dollar Index Is Declining
On Friday, the US dollar weakened against the basket of major currencies. After two-day talks, the US and China did not come to any agreement. Moreover, the countries exchanged additional duties. Also, the US currency was under pressure due to the speech by the Federal Reserve chairman, Powell, in Jackson-Hole. The official supported a further gradual increase in the interest rates. At the same time, the Federal Reserve chairman is concerned about the lack of accelerating inflation and the state of the real estate market. The US dollar index (#DX) closed in the negative zone (-0.54%).
This week, investors' attention will be focused on trade negotiations on the NAFTA contract renewal. We also recommend paying attention to the following reports from the US and the Eurozone. On Wednesday, August 29, the revised value of US GDP for the second quarter will be published. On Thursday, August 30, the US Department of Commerce will publish the core personal consumption expenditure price index in the US. On Friday, August 31, there will be data on inflation in the Eurozone.
The "black gold" prices are consolidating. At the moment, futures for the WTI crude oil are testing a mark of $68.50 per barrel.
Market Indicators
On Friday, the bullish sentiment was observed in the US stock market: #SPY (+0.60%), #DIA (+0.53%), #QQQ (+0.93%).
At the moment, the 10-year US government bonds yield is at the level of 2.81%-2.82%.
The news feed on 2018.08.27:
IFO business climate index in Germany at 11:00 (GMT+3:00).
The markets of Great Britain are closed due to the holiday.
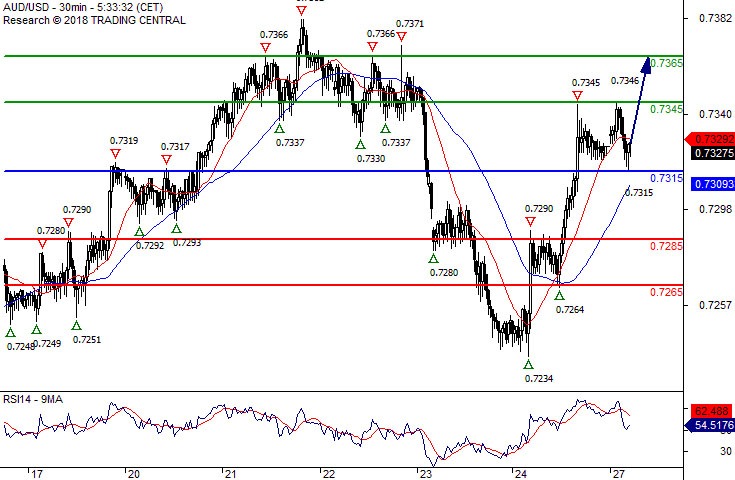
AUD/USD Caution
Pivot (invalidation): 0.7315
Our preference Long positions above 0.7315 with targets at 0.7345 & 0.7365 in extension.
Alternative scenario Below 0.7315 look for further downside with 0.7285 & 0.7265 as targets.
Comment Technically the RSI is above its neutrality area at 50.
USD/CAD The Downside Prevails
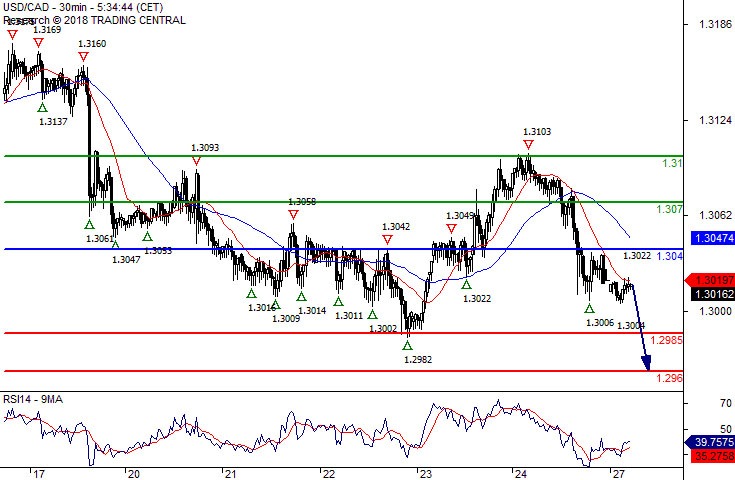
Pivot (invalidation): 1.3040
Our preference Short positions below 1.3040 with targets at 1.2985 & 1.2960 in extension.
Alternative scenario Above 1.3040 look for further upside with 1.3070 & 1.3100 as targets.
Comment The RSI calls for a drop.
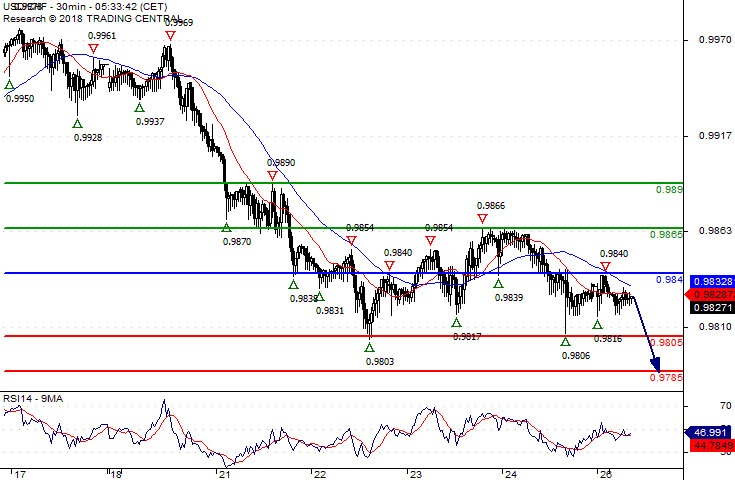
USD/CHF The Downside Prevails
Pivot (invalidation): 0.9840
Our preference Short positions below 0.9840 with targets at 0.9805 & 0.9785 in extension.
Alternative scenario Above 0.9840 look for further upside with 0.9865 & 0.9890 as targets.
Comment The RSI is mixed to bearish.