Sample Category Title
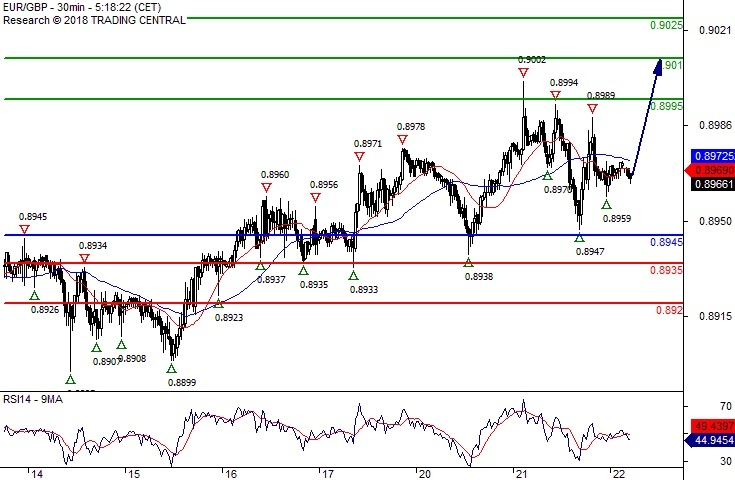
EUR/GBP Bullish Bias Above 0.8945
Pivot (invalidation): 0.8945
Our preference Long positions above 0.8945 with targets at 0.8995 & 0.9010 in extension.
Alternative scenario Below 0.8945 look for further downside with 0.8935 & 0.8920 as targets.
Comment The RSI lacks downward momentum.
Bitcoin/Dollar Further Advance
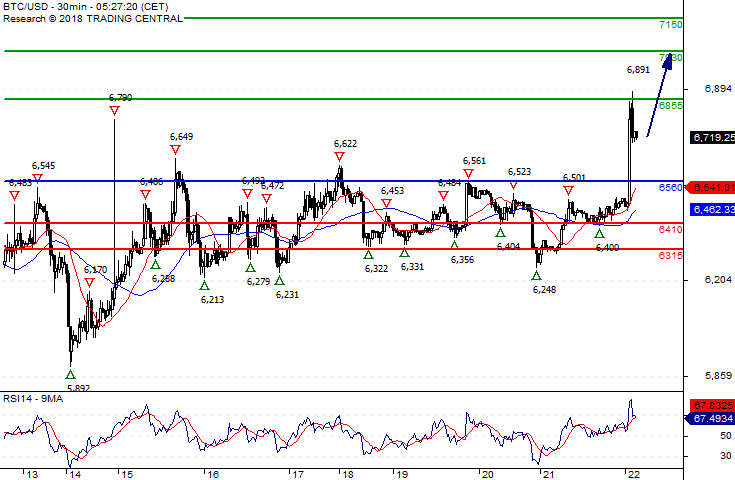
Pivot (invalidation): 6560
Our preference Long positions above 6560 with targets at 6855 & 7030 in extension.
Alternative scenario Below 6560 look for further downside with 6410 & 6315 as targets.
Comment The RSI is mixed to bullish.
AUDUSD To Hold Bullish Momentum In Short-Term
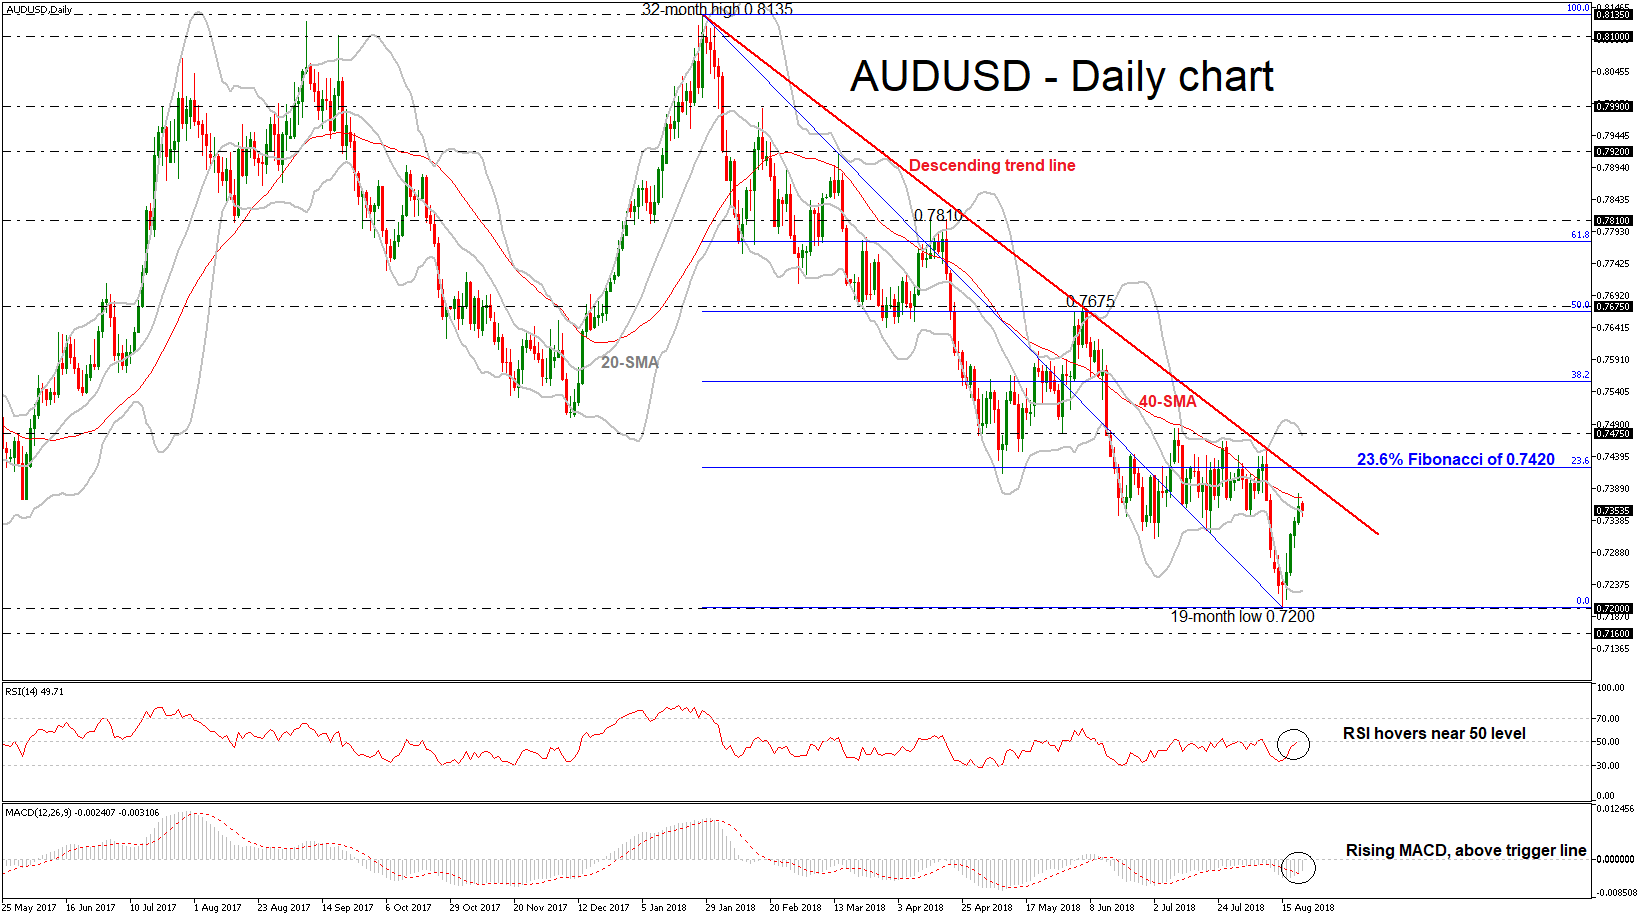
AUDUSD turned positive after its downfall to the new 19-month low of 0.7200 in the previous week. The pair posted four straight bullish days and trades within the 40-day simple moving average (SMA) and the mid-level of the Bollinger Band (20-day SMA). In the short-term, the upward rally is likely to be continued as the RSI strengthens to the upside to break the 50 level and the MACD deviates further above its red signal line towards the zero line.
In case the pair extends gains, the price could meet resistance at the 23.6% Fibonacci retracement level of the dowleg from 0.8135 to 0.7200, around 0.7420. A break above this obstacle, would violate the medium-term descending trendline and hence ease downside pressures, confirming the start of an uptrend. Above from here, the next level for investors to have in mind is the 0.7475 resistance, which overlaps with the upper Bollinger Band.
Should the market head lower, support could be met between the lower Bollinger band at 0.7225 and the 19-month low (0.7200). A daily close below this zone could send the price towards the 0.7160 support, identified by the bottom on December 2016. Then, if the market fails to hold above this level as well, the next stop could come at the strong psychological level of 0.7000, taken from the lows on February 2016.
In the medium term, the bearish outlook remains intact, with all moving averages pointing to the downside. However, should prices jump above the downtrend line, which has been standing since January 26, this would shift the picture to a more positive one.
AUD/USD Shooting Star Might End The Consolidation
The AUD/USD broke below the consolidation pattern that started a retracement. The Shooting start that was formed at the W H4 could end the retracement spurring another short sell. The rejection from the POC zone ( 0.7340-60) targets 0.7300, 0.7260 and will eventually reach 0.7196.
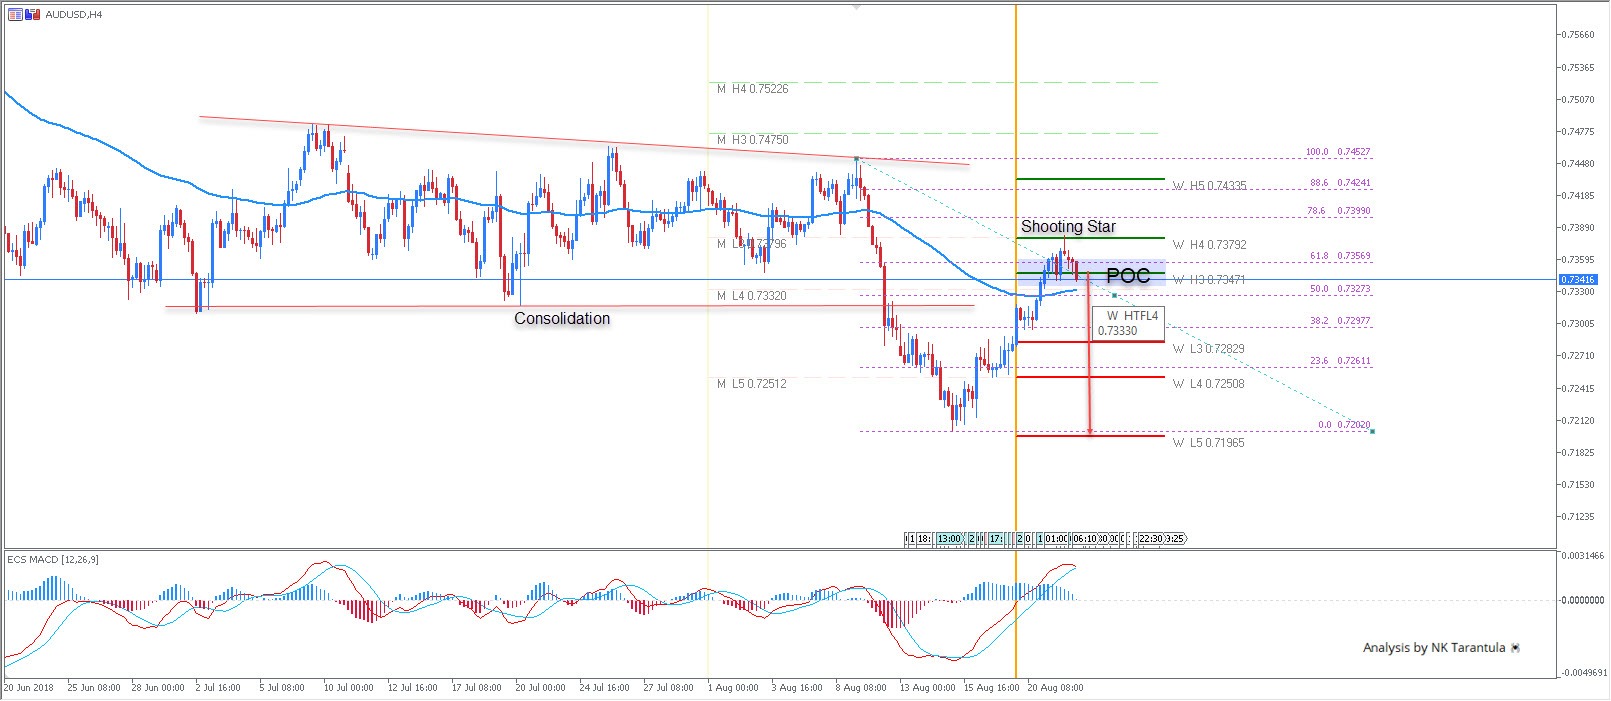
W L3 - Weekly Camarilla Pivot (Weekly Interim Support)
W H3 - Weekly Camarilla Pivot (Weekly Interim Resistance)
W H4 - Weekly Camarilla Pivot (Strong Weekly Resistance)
M H4 - Monthly Camarilla Pivot (Very Strong Monthly Resistance)
M L3 – Monthly Camarilla Pivot (Monthly Support)
M L4 – Monthly H4 Camarilla (Very Strong Monthly Support)
POC - Point Of Confluence (The zone where we expect the price to react - aka the entry zone)
EURUSD Expects Bullish Bounce At 1.15 And 50% Fib
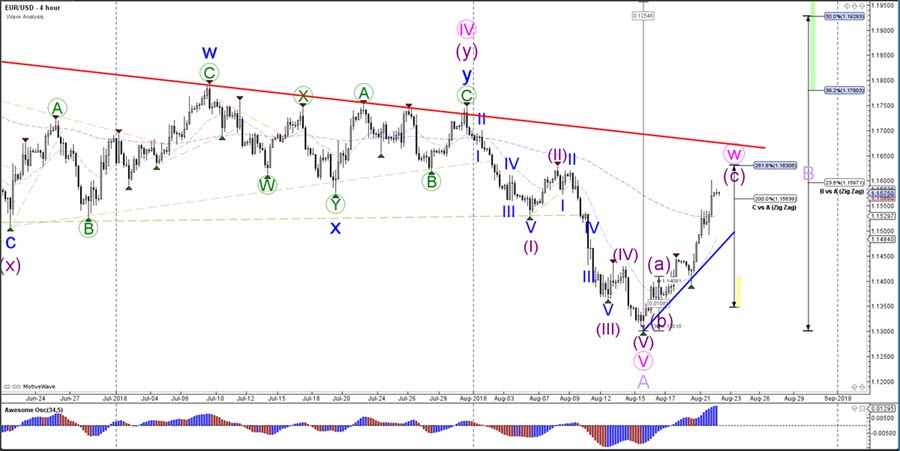
The EUR/USD continued yesterday with the strong bullish momentum. There is some small space left until price hits a larger resistance trend line (red), which is a key decision zone for bounce or breakout.
The EUR/USD is probably building a bullish ABC zigzag pattern (purple) within a larger wave W (pink) correction.
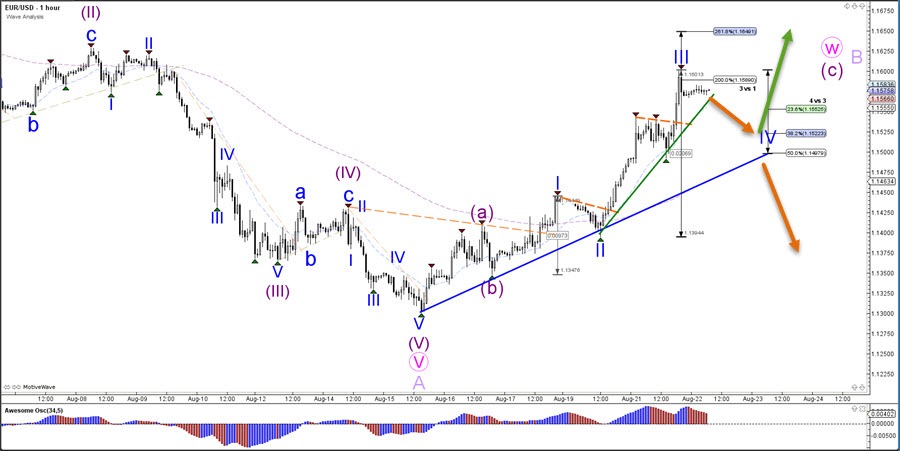
The EUR/USD bullish momentum seems to have completed a wave 3 (blue). A shallow and choppy pullback would confirm the potential wave 4 (blue) correction and price could bounce at the Fibonacci levels around 1.15-1.1550 to build a new high within wave 5. A break below the 50% Fib makes a wave 4 less likely.
USD/JPY Starts Bullish ABC Zigzag Pattern
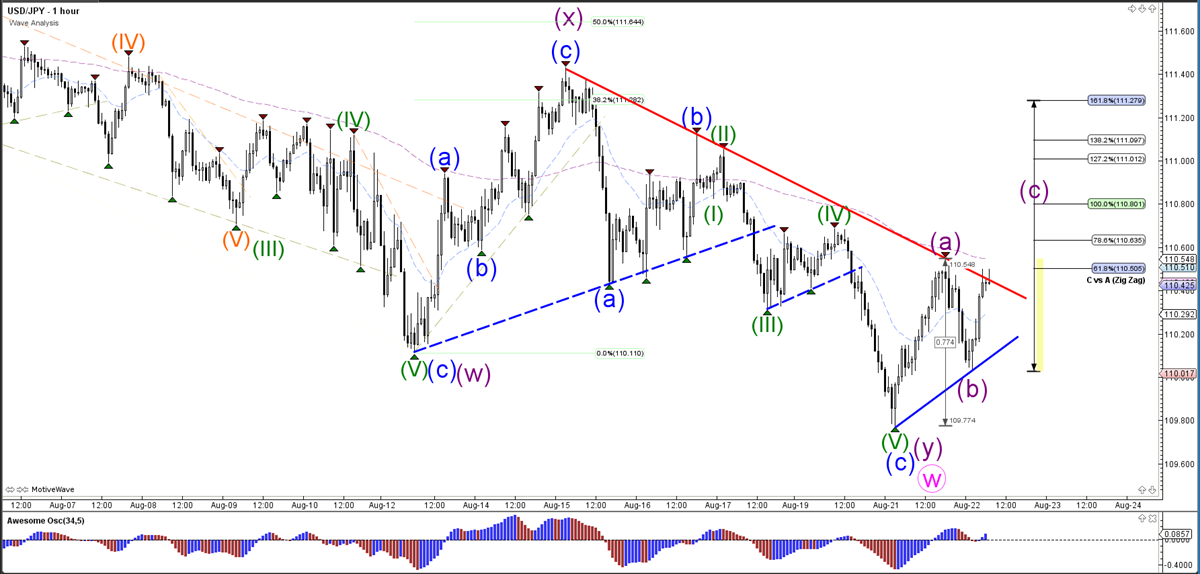
The USD/JPY has probably completed the bearish swing if it manages to break above the resistance trend line. A bullish breakout could indicate the end of the wave Y (purple) of wave W (pink) at the most recent low. The wave E (light purple) however is rather short in comparison to wave D and the other legs of the triangle pattern, and therefore an expanded WXY (pink) correction seems most likely.
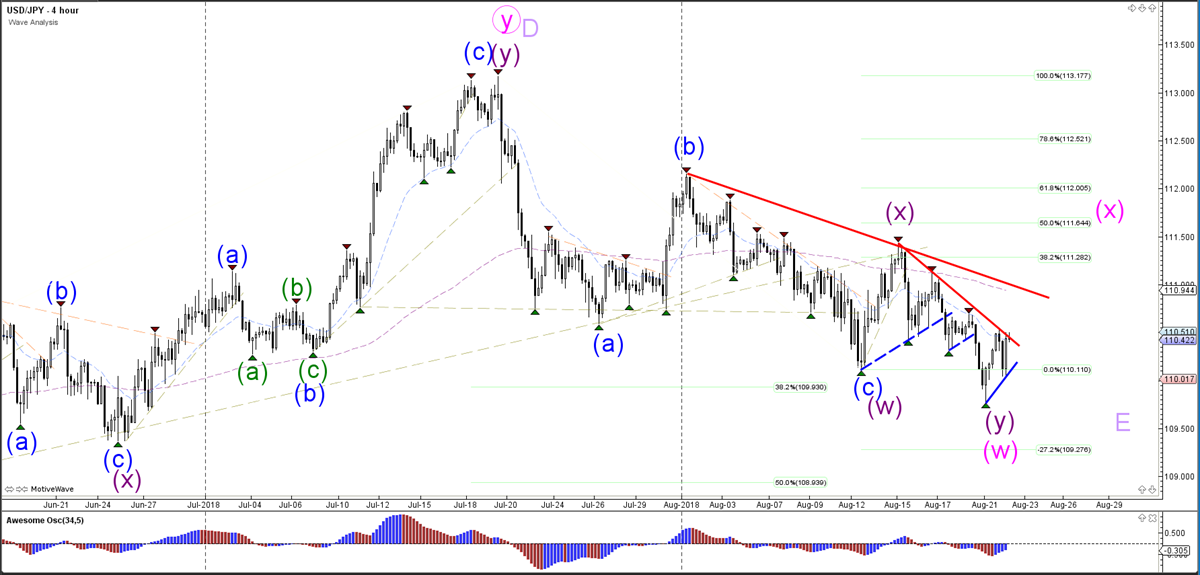
The USD/JPY is probably building a bullish ABC zigzag pattern (purple) after completing a 5th wave (green) of wave C (blue). The trend lines however remain a key factor as a breakout above resistance or below support indicates the next potential direction.
GBPUSD Faces Strong Resistance From 1.2958 Level
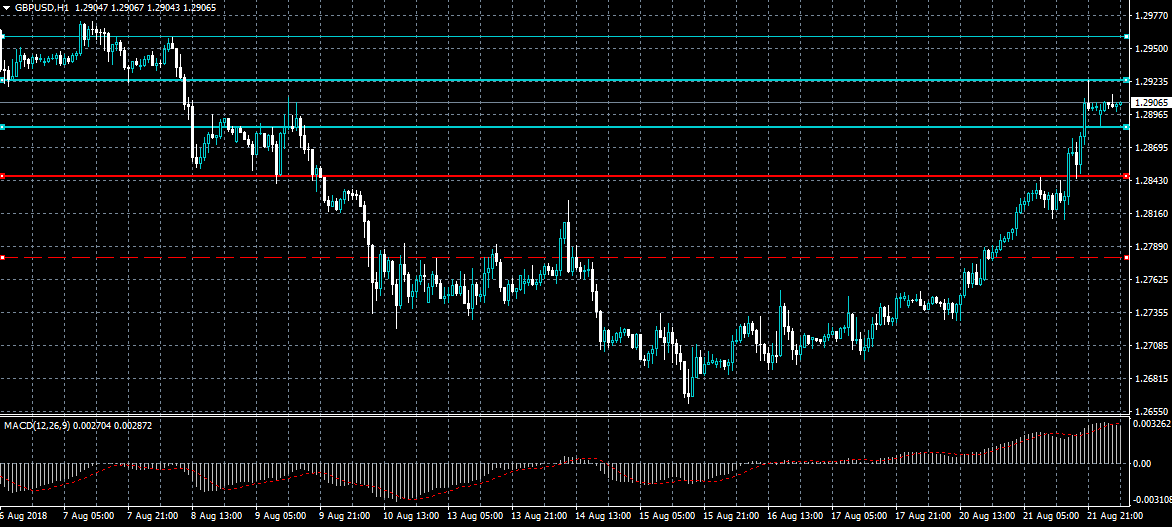
The British pound has advanced to its best trading level in over two weeks against the greenback, over broad-based weakness in the US dollar index. The GBPUSD pair now looks set to challenge the key 1.2958 resistance level, if buyers can maintain the bullish momentum above the 1.2887 level. Key extended intraday support is currently found at the 1.2844 level.
The GBPUSD pair is strong bullish while trading above the 1.2887 level, key resistance is now found at the 1.2958 and 1.3000 levels.
If the GBPUSD pair trades below the 1.2887 level, key intraday support is found at the 1.2844 and 1.2775 levels.
EURUSD Buyers Reach 1.1600 Level
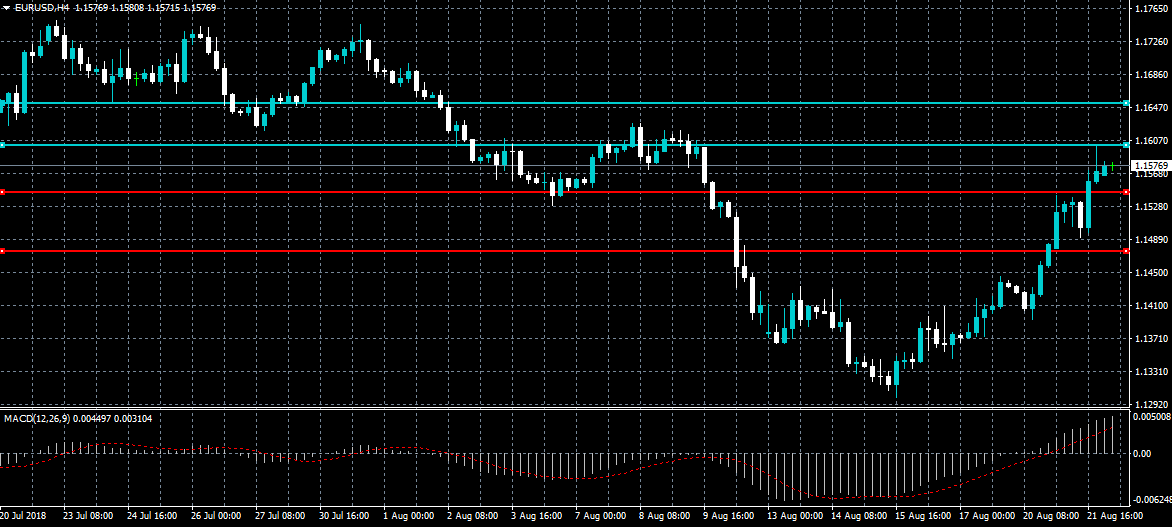
The euro continues to soar higher against the greenback in early Wednesday trade, as downside pressure on the US dollar accelerates. The EURUSD pair reached the 1.1600 level, after performing another major technical breakout on Tuesday, with buyers pushing through the 1.1553 resistance level. The MACD indicator across the four-hour time frame now appears overstretched, the price may correct back towards the key 1.1553 level.
The EURUSD pair is strongly bullish while trading above the 1.1553 level, key resistance is now found at the 1.1600 and 1.1650 levels.
If the EURUSD pair moves below the 1.1553 level, sellers may test towards 1.1507 and 1.1480 support levels.
Concerns Of Manipulation As Bitcoin Price Spikes
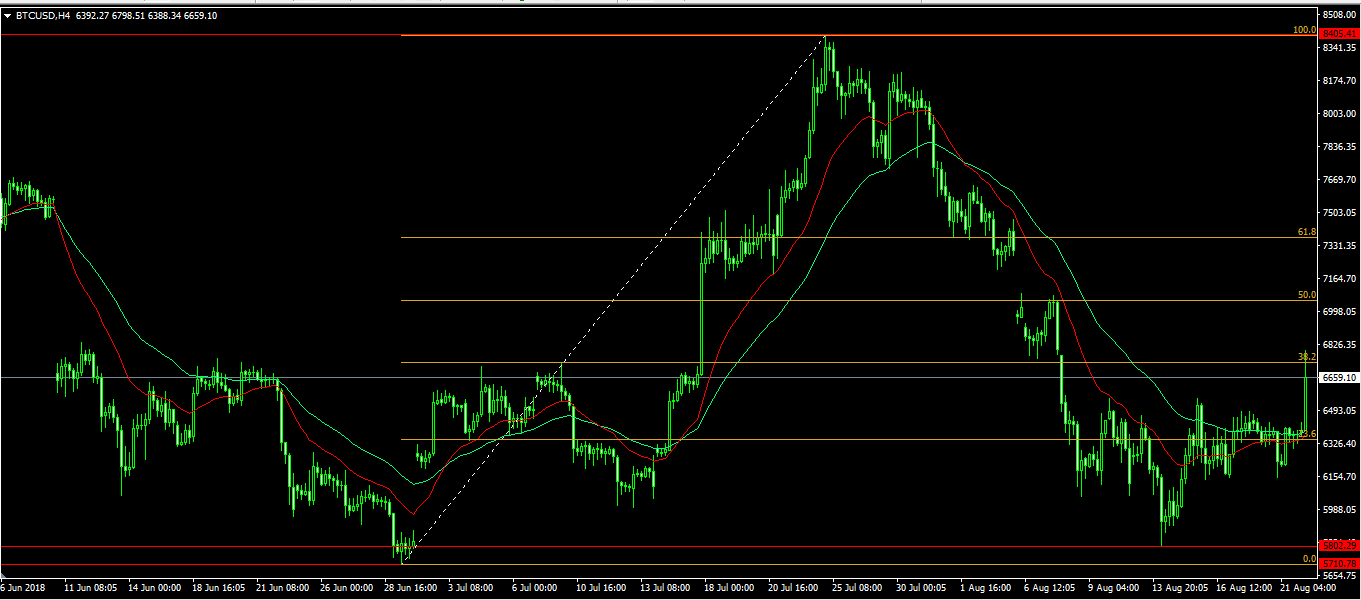
The price of Bitcoin jumped today by more than $400 to reach an intraday high of $6,800. This was the highest level in two weeks. It happened at a period when the price of Bitcoin was moving sideways. It is unclear what caused the spike. Some experts attributed the spike to BitMEX going offline for scheduled maintenance. BitMEX is a large leveraged cryptocurrencies firm that handles millions of transactions every day.
Today's price action reminded traders of price manipulations which occur in the crypto sector. In recent months, exchanges have been accused of manipulating the prices of major cryptocurrencies in ways that would be illegal in other markets like stocks. The opaque nature of cryptocurrencies makes it difficult for this type of manipulation to be avoided.
In recent days, regulation has become a major topic in the crypto market. Two days ago, the famous Winklevoss twins announced that they were forming a crypto supergroup that will act as a regulator. The group's members are some of the biggest crypto exchanges in the world such as BitStamp, bitFlyer, and Bittrex. It is unclear whether other members will join the group.
These developments have come at a time when many cryptocurrency investors are disappointed with the industry. Earlier in the year, the value of cryptocurrencies increased to almost $800 billion. This value has been wiped out and is now at below $200 billion. On Monday, the New York Times published stories about people who bought Bitcoin at $18,000 and who have seen their value wiped out.
The BTC/USD pair is now trading at $6655, which is slightly lower than the intraday high of $6800. This price is above the 42 and 21-period exponential moving average, and higher than the weekly low of $5,800. This price is closer to the 38.2% Fibonacci Retracement level. If the pair breaks the resistance, it will likely test the 50% level at $7,000.
FOMC Minutes, North American Data In The Spotlight On Wednesday
Economic data is back in the spotlight Wednesday with North America taking centre stage. After a slow start to the week, the economic calendar will see a broad pick up in the coming days, which should give currency traders more opportunity to enter the market.
After an uneventful European session, the North American calendar will begin with a report on US mortgage applications courtesy of the Mortgage Bankers Association (MBA). Last week’s report showed a 2% drop in applications for the period ended 10 August.
At 12:30 GMT, attention shifts north of the border with Canada set to report on retail sales. Receipts at retail stores, which are a key proxy for inflation, are expected to rise 0.1% in June after surging 2% the previous month. Excluding automobiles, sales are likely to fall 0.1% following a 1.4% uptick in May.
The National Association of Realtors (NAR) will report on existing home sales at 14:00 GMT. The July report is expected to show month-on-month growth of 0.6% in July following a 0.6% drop the previous month. US home sales have taken a big hit this year, raising warning signs about the health of the domestic economy in light of multiple rate hikes by the Federal Reserve.
Energy traders will be keeping close tabs of weekly crude inventory data at 14:30 GMT. The US Energy Information Administration (EIA) is expected to show a weekly drawdown of 1.533 million barrels for the week ended 17 August. Inventories surged 6.805 million barrels during the previous week.
At 18:00 GMT, the Federal Reserve will release the minutes of its most recent policy meeting, where officials voted to keep the federal funds rate unchanged. The Federal Open Market Committee (FOMC) is widely expected to raise rates at its forthcoming meeting in September.
EUR/USD
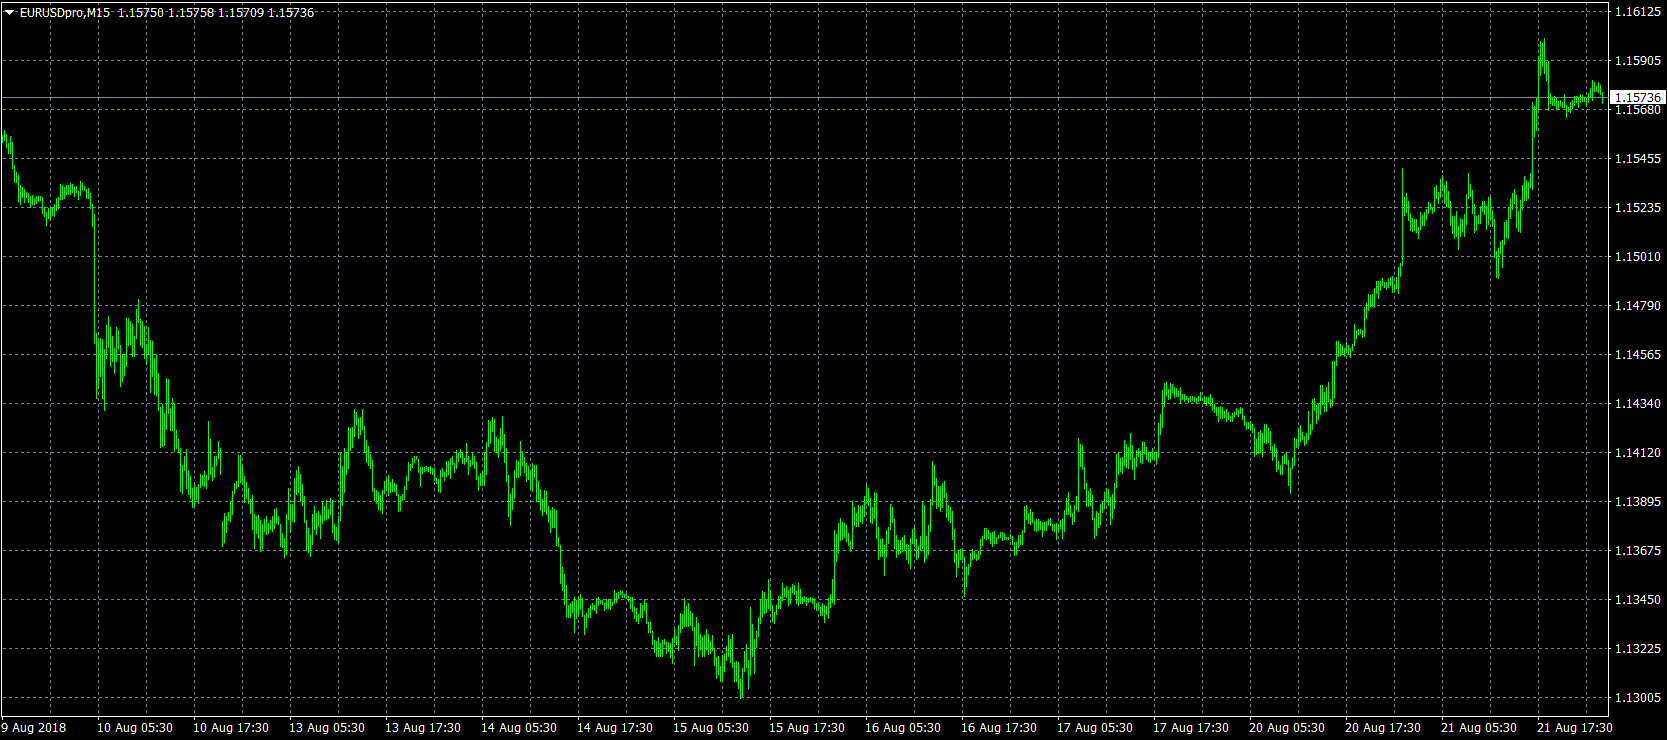
Europe’s common currency continued higher on Tuesday, hitting fresh 12-day highs against the dollar. The EUR/USD exchange rate now sits at 1.1574, where it was little changed compared with the previous close. The bulls are now eyeing the 1.1600 level as the next target.
USD/CAD
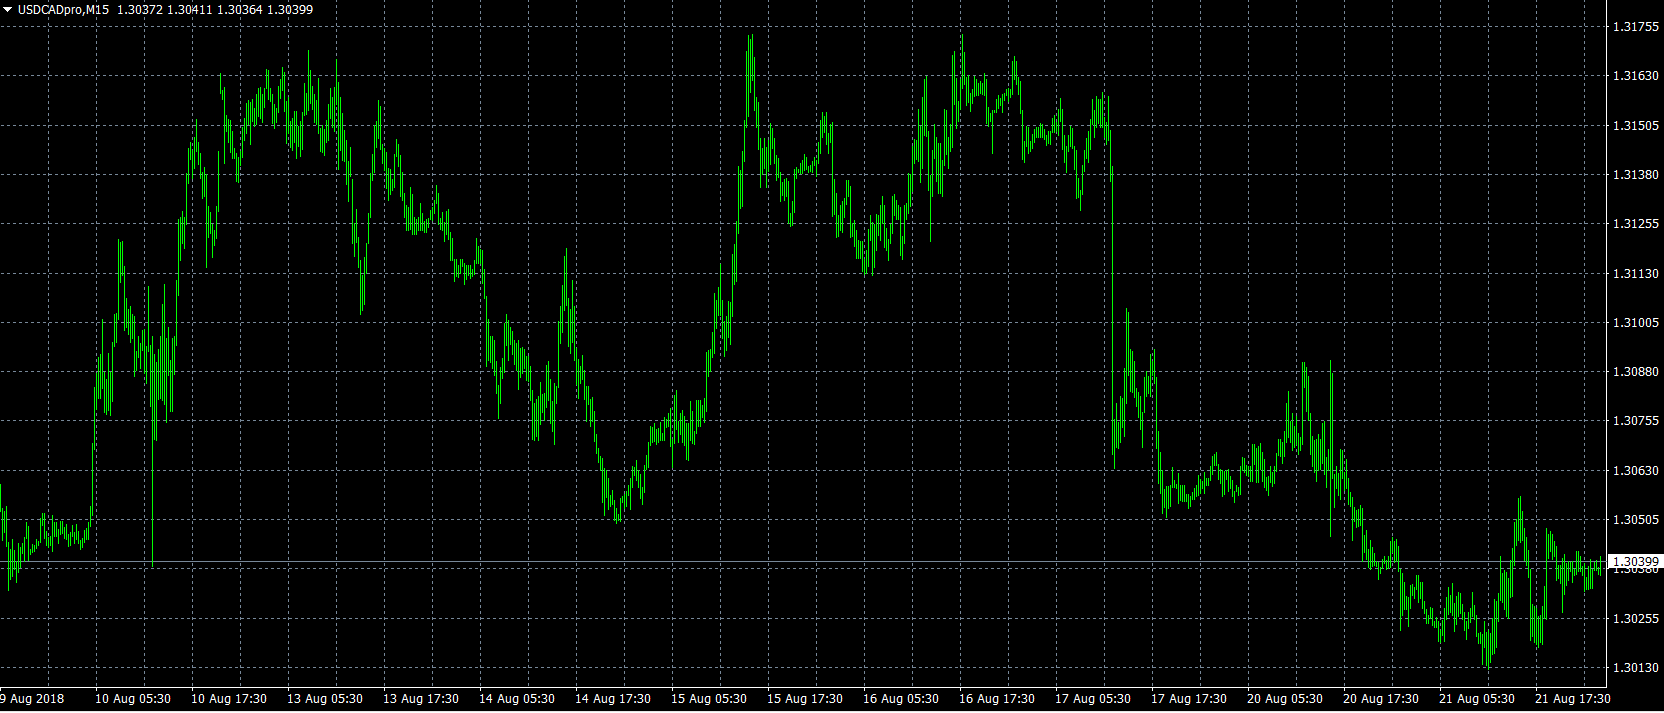
The Canadian dollar held firm against its southern counterpart Tuesday, as oil prices resumed their upward traction. The USD/CAD exchange rate currently sits at 1.3040, having declined sharply from last week’s high. The pair is testing immediate support at 1.3035, which is the 100-DMA.
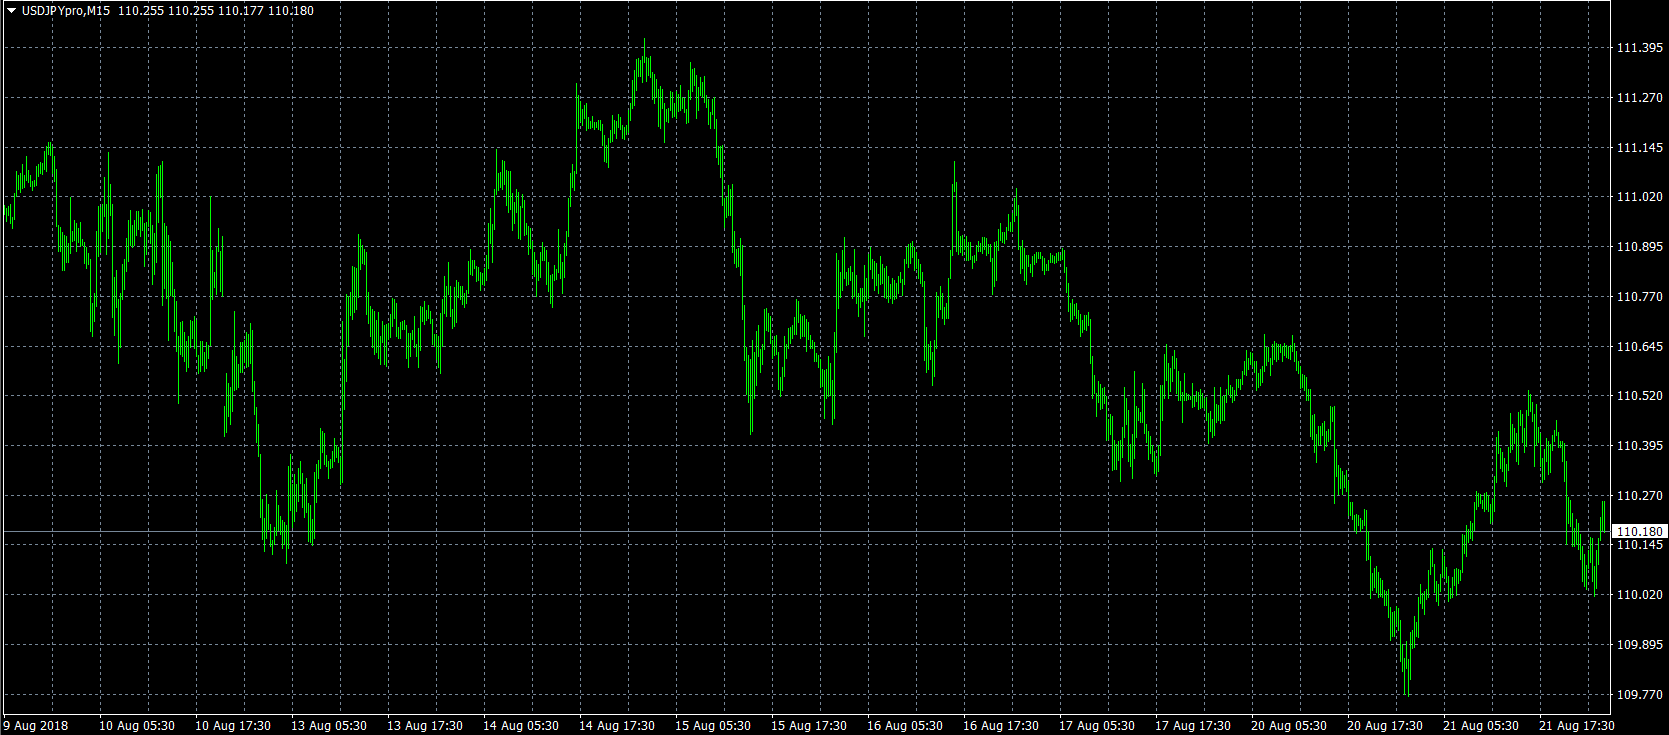
USD/JPY
The USD/JPY exchange rate is coming off a volatile Tuesday session as prices fell, rose and then fell again before finishing slightly higher. At the time of writing, the USD/JPY exchange rate was holding at 110.21, where it was little changed. The pair is likely to run into immediate resistance near 110.52, the high from Tuesday.