Sample Category Title
RBNZ Delays Timing for Rate Change and Inflation to Reach +2%, Kiwi Slumps
RBNZ’s August statement comes in more dovish than we had anticipated. While leaving the OCR unchanged at 1.75%, the members pushed backward expectations for the next interest rate adjustment. Moreover, they pushed back the timing for inflation to reach the +2% target. New Zealand dollar slumped after the announcement. NZDUSD plunged to as low as 0.6662, a level not seen since early 2016, before stabilizing. AUDNZD has rallied by about +1.5% on expectations that RBA would increase interest rates earlier than RBNZ.
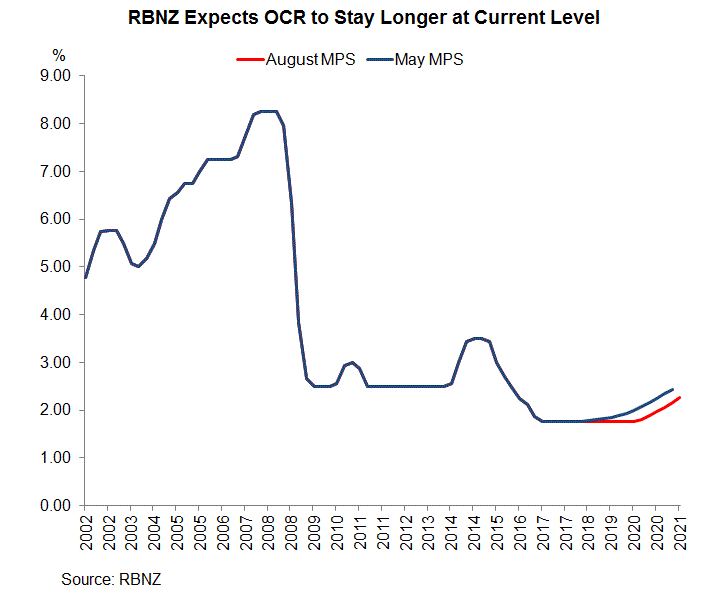
The central bank reiterated the stance that “the direction of our next OCR move could be up or down”. Yet, it added that the OCR would be kept at current level through 2019 and into 2020, longer than what had been projected in the May statement. The members acknowledged the slowdown in economic growth. However, they remained confident that economic growth would “pick up pace over the rest of this year and be maintained through 2019”, despite recent slowdown. The members were upbeat over the job market, noting that it has “tightened over the past year” and “employment is roughly around its maximum sustainable level”. They expected that the unemployment rate would “decline modestly from its current level”.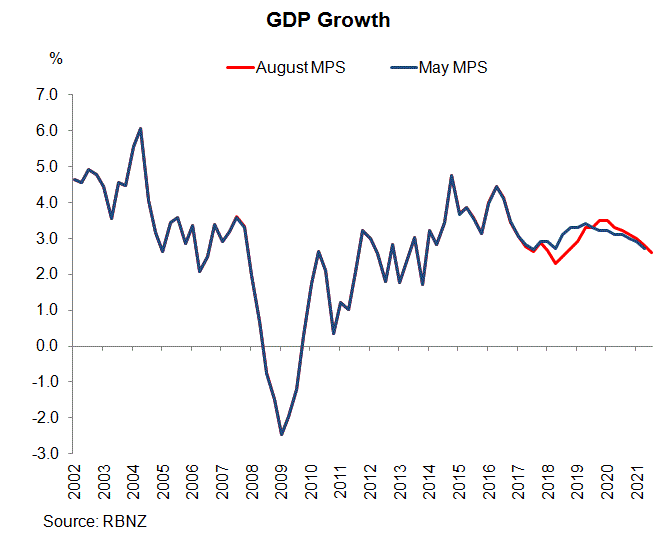
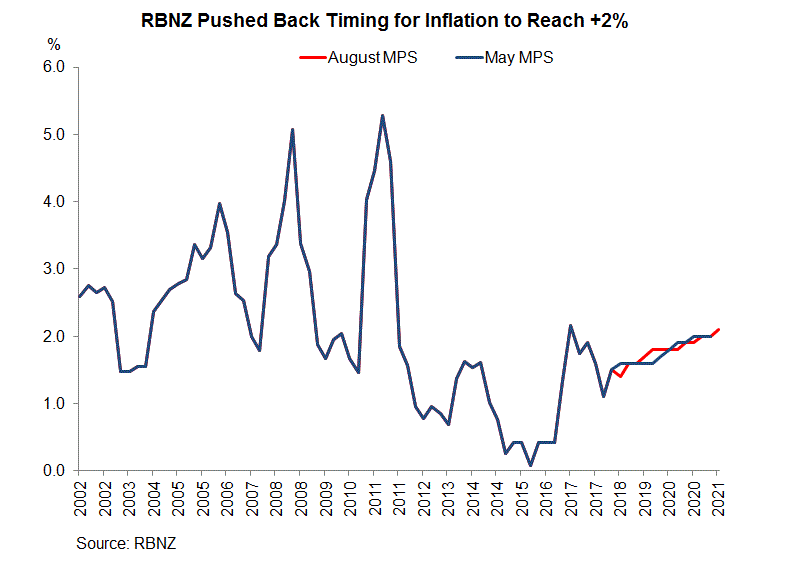
Concerning inflation, policymakers acknowledged the rise in core CPI and affirmed that inflation would increase towards +2% over the projection period as capacity pressures bite. They remained cautious towards the outlook, indicating that the path might be “bumpy”, with “one-off price changes from global oil prices, a lower exchange rate, and announced petrol excise tax rises expected”. As we suggested, the members decided to look through the volatility and “only respond to any persistent movements in inflation”. Meanwhile, RBNZ pushed back its 2% mid-target inflation forecast early 2021.
Can Gold Price Break This Crucial Resistance?
Key Highlights
Gold price corrected higher, but it faced a strong resistance near the $1,216 zone against the US Dollar.
There is a significant bearish trend line formed with resistance near $1,212-1,215 on the 4-hours chart of XAU/USD.
China’s CPI in July increased 0.3% (MoM), more than the forecast of +0.2%.
The US Producer Price Index for July 2018 will be released today, which is forecasted to increase 0.2% (MoM).
Gold Price Technical Analysis
After forming a low at $1,204.47, gold price corrected higher against the US Dollar. The price traded above the $1,210 level, but it faced a lot of selling interest above the $1,216 level.
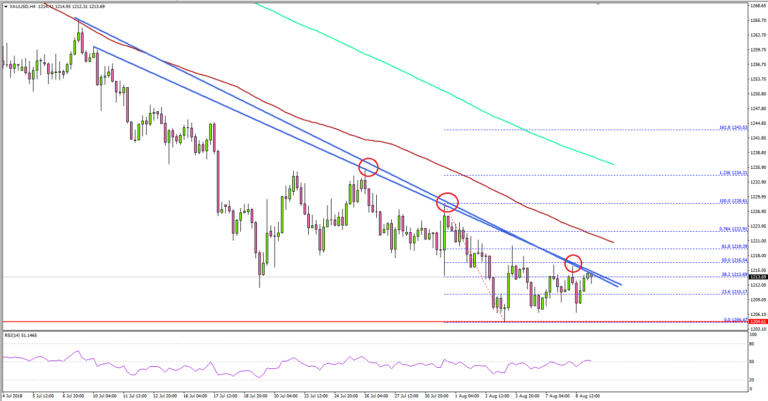
The 4-hour chart of XAU/USD indicates that the price failed on multiple occasions near a significant bearish trend line with current resistance near $1,212-1,215.
The last major wave failed near the trend line and the 61.8% Fib retracement level of the last decline from the $1,228 high to $1,204 low. As long as the price is below the trend line and $1,215, it remains at a risk of more losses.
An immediate support is at $1,204, below which, the price may perhaps test the $1,200 support zone. Should the price fail to hold the $1,200 support, there could be heavy declines in gold.
On the other hand, if the price recovers and breaks the trend line plus $1,215, it may possibly move towards the $1,220 level. Above $1,220, the price is likely to test the last swing high at $1,228.
Today, China’s Consumer Price Index report for July 2018 was released by the National Bureau of Statistics of China. The market was looking for a rise of 0.2% in the CPI in July 2018 compared with the previous month.
The result was positive as there was a rise of 0.3%. The yearly change posted a rise of 2.1%, compared with the forecast of +1.9%.
Overall, the US Dollar is trading with positive moves and it could ignite more losses in gold. Recently, the GBP/USD pair fell sharply to multi-month lows, helping the greenback to gain traction.
Economic Releases to Watch Today
- US Initial Jobless Claims – Forecast 220K, versus 218K previous.
- US Producer Price Index July 2018 (MoM) – Forecast +0.2%, versus +0.3% previous.
- US Producer Price Index July 2018 (YoY) – Forecast +3.4%, versus +3.4% previous.
- US Wholesale Inventories for June 2018 – Forecast 0%, versus 0% previous.
Market Morning Briefing: Euro Could Climb Higher Towards 1.165-1.167
STOCKS
Dow (25583.75, -0.18%) has broken above immediate resistances and is set to rise in the near to medium term but note resistance on the 3-day candles at current levels which could possibly push the index and keep the price low for a few sessions before the index tries to move up higher.
12500-12300 is an important support for Dax (12633.54, -0.12%) that could take it higher towards 12800+ levels in the medium term. A break below 12500 would open up chances of testing 12300 on the downside. This week could see some ranged movement followed by an upmove in the coming week.
Nikkei (22584.18, -0.27%) is stuck just along the weekly trend resistance for almost 4-weeks now without any indication of further directional clarity. While the resistance holds, there could be some scope of coming off to 22000 but while the index finds it difficult to come off just now, there could be worries of a break past 23000 in the medium term. For now we respect the immediate resistance and expect a fall in the near term.
Shanghai (2792.92, +1.78%) has important support on the weekly line charts and while that holds, downside could be limited in the near term. Some sideways consolidation is possible before a sharp upmove begins. Downside could be limited to 2700-2650.
Nifty (11450, +0.53%) is testing important resistance levels on the 3-day candles and weekly charts. While 11500 acts as a decent resistance, a fall from here is possible in the coming sessions towards 11300.
COMMODITIES
Nymex WTI (67.10) has come off as expected, moving below our expected 68 level and if it does not bounce back immediately, the price could continue to move down in the near term. Although the line charts show a break below immediate support levels, we wait for confirmation on the 3-day and weekly candles chart to assure bearishness in crude prices in the coming week.
Brent (72.52) also came off but continues to trade above immediate support near 71-70 levels. It would be crucial to keep a close watch as, a break below current supports, if seen would trigger fresh bearishness for the medium term.
Support on Gold (1222.70, +0.14%) 3-day candle chart at 1210 and support at 1200 on the weekly line charts suggest that the 1210-1200 is an important support in the near term that could possibly hold and push prices back to higher levels. Trade within 1240-1200 is possible in the next 1-2 weeks followed by a bounce back to higher levels.
Silver (15.47) has support at 15 and is likely to hold in the coming sessions leading to a bounce in silver prices to levels near 15.5-16.0 in the medium term.
Copper (2.7685) has scope of trading in the 2.8-2.7 region (daily candles) while support near 2.7 seems to be holding well on the weekly candle charts. But at the same time, near term resistance on the 3-day candles and the longer term line charts show scope of a sharp fall below 2.70 in the near term. We would remain cautious to see if the Copper breaks lower than 2.70 before testing 2.80 on the upside.
FOREX
Euro (1.1614): Euro could climb higher towards 1.165-1.167 over today-tomorrow . There is resistance in the 1.165-1.167 zone (provided by 21 days MA and 13 weeks MA), which could lead to another dip, back towards 1.155 in the next week.
Dollar Index (95.15): Dollar Index could move lower towards 94.8 (21 days MA) over the next 1-2 sessions. If it breaks below 94.8, there is trendline support near 94.5, which should hold for now, leading to a rise back towards 95.5 next week.
Dollar Yen (110.78): Dollar Yen has broken below support near 111 on daily candles. The 21 MA line on 3 day line chart near 110.65 could provide some interim support. While above 110.59 (previous low on 26th July), it could still move back up towards 112. A break below 110.59 could make Dollar Yen bearish towards the 21 weeks MA near 109.49.
Euro Yen (128.66): Euro Yen looks bearish towards support zone of 127.5-127.0 (seen on daily line chart and 3 day candles) and could test it sometime next week. Upside could be capped near 129.5 by the 13 days MA.
Pound (1.2880): As per expectation, Pound moved down to test support near 1.285 (earlier mentioned as 1.288) on daily candles. It could probably see some rise towards 1.30 in the next 2-3 sessions before resuming its downtrend towards lower levels. An immediate break below 1.285 might however negate the above mentioned upward correction to 1.30.
Dollar Rupee (68.625): Dollar Rupee could again rise towards 68.80 from current levels itself, or, after a test of 68.30. Few more sessions in the broad 68.80-68.30 range could be seen.
INTEREST RATES
The US 10 year treasury auctions saw decent demand yesterday – this is one indication that the yield could continue staying below 3%. Moreover trade tensions saw a rise as China announced that it would retaliate with tariffs on $16 bn worth of imports from USA (tariffs on an equal volume of imports from China would be coming into effect in the US from 23rd August). This development could just enhance the ‘risk off’ sentiment amongst investors.
US 10 year yield (2.95%), 30 Year (3.11%), 5 Year (2.83%), 2 Year (2.67%):
The US 10 year yield has been moving in the 2.95%-3.00% zone since July end and the longer it stays here, greater the chances of it coming back below 2.9%. There is crucial support near 2.82-85%, which it was not able to break below in Jun-Jul ’18 and which might again restrict its downmove (if it happens). A rise past 3% on the other hand is less preferred currently.
Repeating yesterday’s comment on Japanese long term yields: Following resistance levels are of crucial importance. A breach above these levels could trigger the US 10 year to breach 3%.
The Japanese 10 year yield (0.12%): resistance @ 0.129% (previous high)
The Japanese 30 year yield (0.85%): resistance @ 0.85% (long term resistance on medium term chart)
NZDUSD, NZDJPY resume down trend after dovish RBNZ
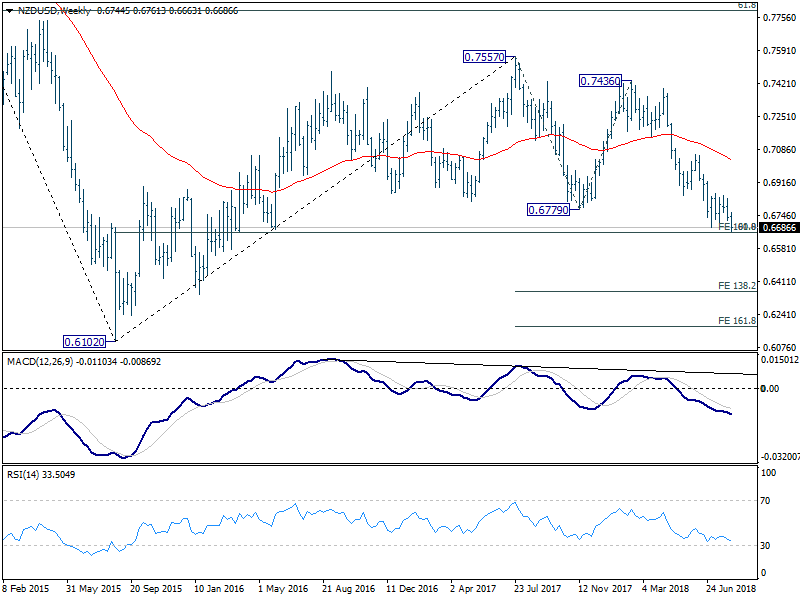
While NZD/USD drops sharply after dovish RBNZ, the selloff is not that "disastrous" yet. Technically, the pair is facing a key cluster fibonacci level. They are, 61.8% retracement of 0.6102 (2015 low) to 0.7557 (2017 high) at 0.6658, and 100% projection of 0.7557 to 0.6779 from 0.7426 at 0.66528. Some initial support could be seen as this level.
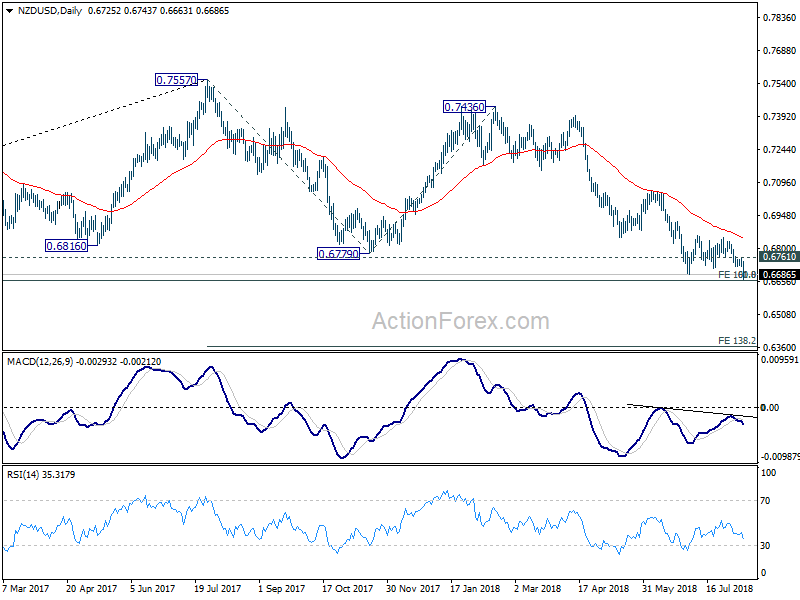
But in any case, near term outlook will stay bearish as long as 0.6761 minor resistance holds. Sustained break of 0.6658 will confirm underlying bearishness and next target will be 138.2% projection at 0.6361.
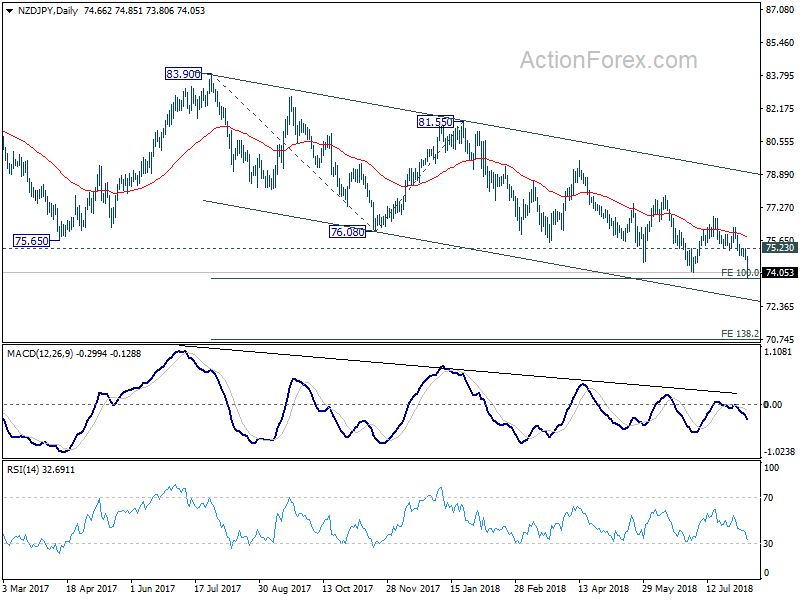
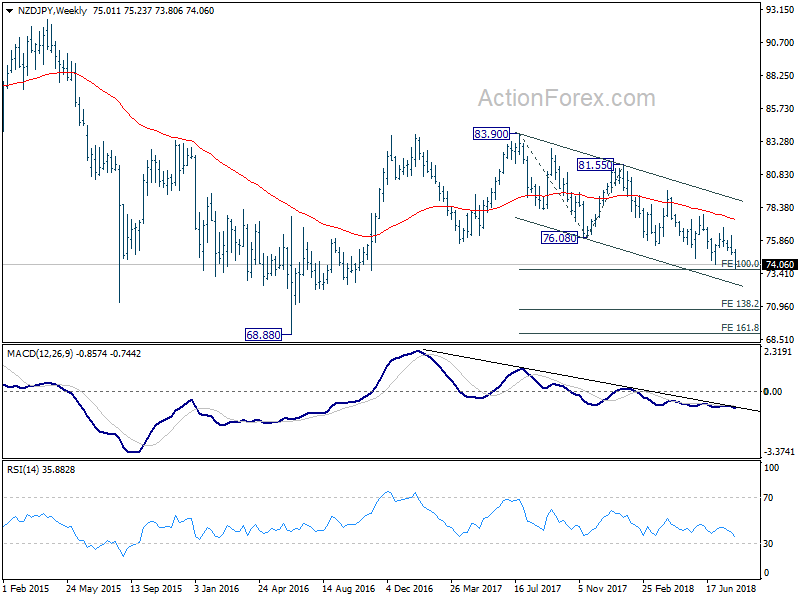
NZD/JPY also resumed larger medium term down trend by breaking 74.07 to as low as 73.80. Near term outlook will stay bearish as long as 75.23 minor resistance holds. Focus is now on 100% projection of 83.90 to 76.08 from 81.55. Firm break there will pave the way to 138.2% projection at 70.74.
RBNZ condition full 25bps hike in Q4 2020, revised down GDP forecasts
New Zealand Dollar tumbles broadly and sharply after RBNZ announcement turned out to be more dovish than expected. The Official Cash Rate is held unchanged at 1.75%. OCR is expected to be kept low, "but for longer", through 2019 and into 2020. RBNZ also reiterated that the next move "could be up or down".
According to the new Monetary Policy Statement (MPS), RBNZ is now conditioning a full 25bps hike to 2.00% in December quarter of 2020. That's notably later than March quarter in 2020 as in May MPS.
GDP growth forecasts were revised down to 2.7% in 2018 (2.8% in May MPS), 2.6% in 2019 (3.1%), 3.4% in 2020 (3.3%) and 3.2% in 2021 (3.1%).
CPI forecasts were kept unchanged at 1.1% in 2018, 1.6% in 2019, 1.8% in 2020, and 2.0% in 2021.
RBNZ Governor Adrian Orr press conference highlights and full
https://www.youtube.com/watch?v=50LqKdb1kB4
https://www.youtube.com/watch?v=d8T1GhMxhQ0
RBNZ kept OCR unchanged at 1.75% as widely expeced, full statement
Statement by Reserve Bank Governor Adrian Orr:
Tena koutou katoa, welcome all.
The Official Cash Rate (OCR) remains at 1.75 percent. We expect to keep the OCR at this level through 2019 and into 2020, longer than we projected in our May Statement. The direction of our next OCR move could be up or down.
While recent economic growth has moderated, we expect it to pick up pace over the rest of this year and be maintained through 2019.
Robust global growth and a lower New Zealand dollar exchange rate will support export earnings. At home, capacity and labour constraints promote business investment, supported by low interest rates. Government spending and investment is also set to rise, while residential construction and household spending remain solid.
The labour market has tightened over the past year and employment is roughly around its maximum sustainable level. We expect the unemployment rate to decline modestly from its current level.
There are welcome early signs of core inflation rising. Inflation will increase towards 2 percent over the projection period as capacity pressures bite. This path may be bumpy however, with one-off price changes from global oil prices, a lower exchange rate, and announced petrol excise tax rises expected. We will look through this volatility as appropriate, and only respond to any persistent movements in inflation.
Risks remain to our central forecast. The recent moderation in growth could last longer. Low business confidence can affect employment and investment decisions. Conversely, there is a chance that inflation could increase faster if cost pressures can pass through into higher prices and impact inflation expectations.
We will keep the OCR at an expansionary level for a considerable period to contribute to maximising sustainable employment, and maintaining low and stable inflation.
Meitaki, thanks.
(RBNZ) Official Cash Rate unchanged at 1.75 percent
Statement by Reserve Bank Governor Adrian Orr:
Tena koutou katoa, welcome all.
The Official Cash Rate (OCR) remains at 1.75 percent. We expect to keep the OCR at this level through 2019 and into 2020, longer than we projected in our May Statement. The direction of our next OCR move could be up or down.
While recent economic growth has moderated, we expect it to pick up pace over the rest of this year and be maintained through 2019.
Robust global growth and a lower New Zealand dollar exchange rate will support export earnings. At home, capacity and labour constraints promote business investment, supported by low interest rates. Government spending and investment is also set to rise, while residential construction and household spending remain solid.
The labour market has tightened over the past year and employment is roughly around its maximum sustainable level. We expect the unemployment rate to decline modestly from its current level.
There are welcome early signs of core inflation rising. Inflation will increase towards 2 percent over the projection period as capacity pressures bite. This path may be bumpy however, with one-off price changes from global oil prices, a lower exchange rate, and announced petrol excise tax rises expected. We will look through this volatility as appropriate, and only respond to any persistent movements in inflation.
Risks remain to our central forecast. The recent moderation in growth could last longer. Low business confidence can affect employment and investment decisions. Conversely, there is a chance that inflation could increase faster if cost pressures can pass through into higher prices and impact inflation expectations.
We will keep the OCR at an expansionary level for a considerable period to contribute to maximising sustainable employment, and maintaining low and stable inflation.
Meitaki, thanks.
Eco Data 8/9/18
[php_everywhere instance="1"]
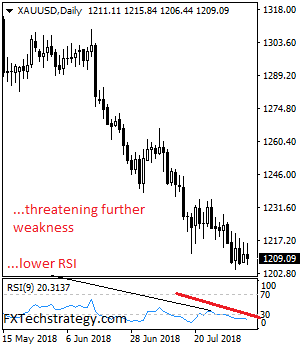
GOLD: Continues To Face Bear Threats
GOLD: The commodity continues to hold on to its downside pressure as it looks to extend its weakness. On the downside, support comes in at the 1,200.00 level where a break will turn attention to the 1,190.00 level. Further down, a cut through here will open the door for a move lower towards the 1,180.00 level. Below here if seen could trigger further downside pressure targeting the 1,170.00 level. Conversely, resistance resides at the 1,210.00 level where a break will aim at the 1,220.00 level. A turn above there will expose the 1,230.00 level. Further out, resistance stands at the 1,240.00 level. All in all, GOLD looks to weaken further.