

Sample Category Title
The Analytical Overview Of The Main Currency Pairs
The EUR/USD currency pair
Technical indicators of the currency pair:
Prev Open: 1.15233
Open: 1.15980
% chg. over the last day: +0.42
Day's range: 1.15939 – 1.16281
52 wk range: 1.0571 – 1.2557
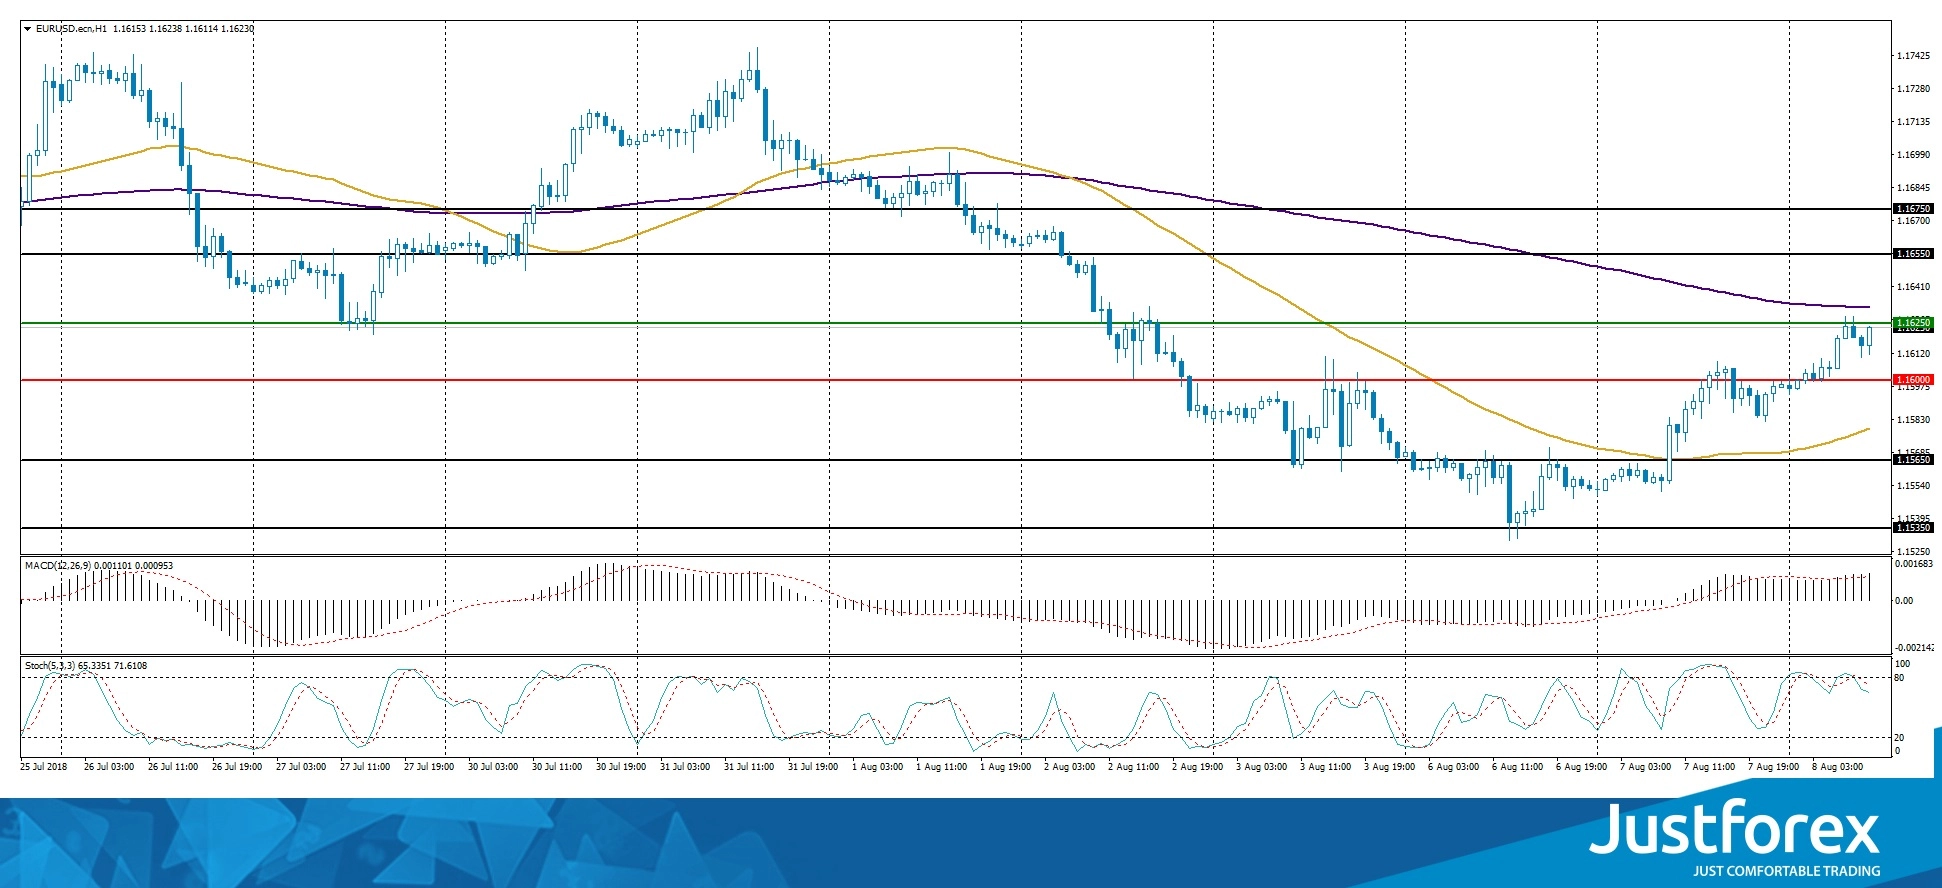
The euro has started recovering. During yesterday's and today's trading, growth of the EUR/USD quotes has exceeded 70 points. At the moment, the price is testing the "mirror" resistance of 1.16250. The round level of 1.16000 is a key support. The trading instrument has the potential for further correction.
Today, the news feed is calm. The publication of important economic reports is not planned.
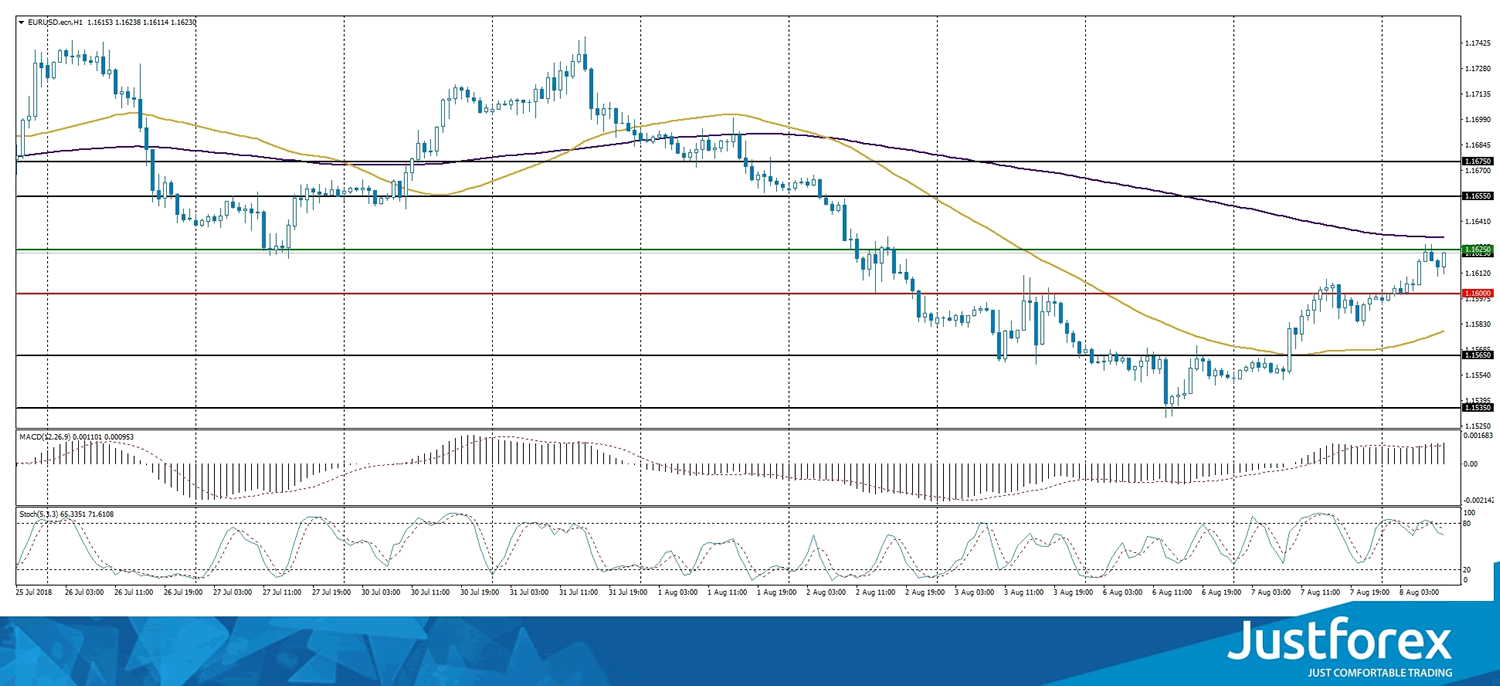
The signals of the indicators are different. The price has fixed between 50 MA and 200 MA.
The MACD histogram is located in the positive zone and above the signal line, which indicates the bullish sentiment.
Stochastic Oscillator is in the neutral zone, the %K line is below the %D line, which signals to sell EUR/USD.
Trading recommendations
Support levels: 1.16000, 1.15650, 1.15350
Resistance levels: 1.16250, 1.16550, 1.16750
If the price fixes above the resistance level of 1.16250, the EUR/USD quotes are expected to grow. The movement is tending to 1.16500-1.16750.
Alternative option. If the price fixes below the round level of 1.16000, it is necessary to consider sales of EUR/USD. The movement is tending to 1.15700-1.15500.
The GBP/USD currency pair
Technical indicators of the currency pair:
Prev Open: 1.29445
Open: 1.29378
% chg. over the last day: +0.02
Day's range: 1.29282 – 1.29596
52 wk range: 1.2361 – 1.4345
The technical pattern on the GBP/USD currency pair is ambiguous. Quotes are in a sideways trend. The pound is testing annual lows. Investors are still concerned about the consequences of Brexit. At the moment, the local support and resistance levels are 1.29250 and 1.29600, respectively. In the near future, we do not rule out a technical correction.
The news feed on the UK economy is calm.
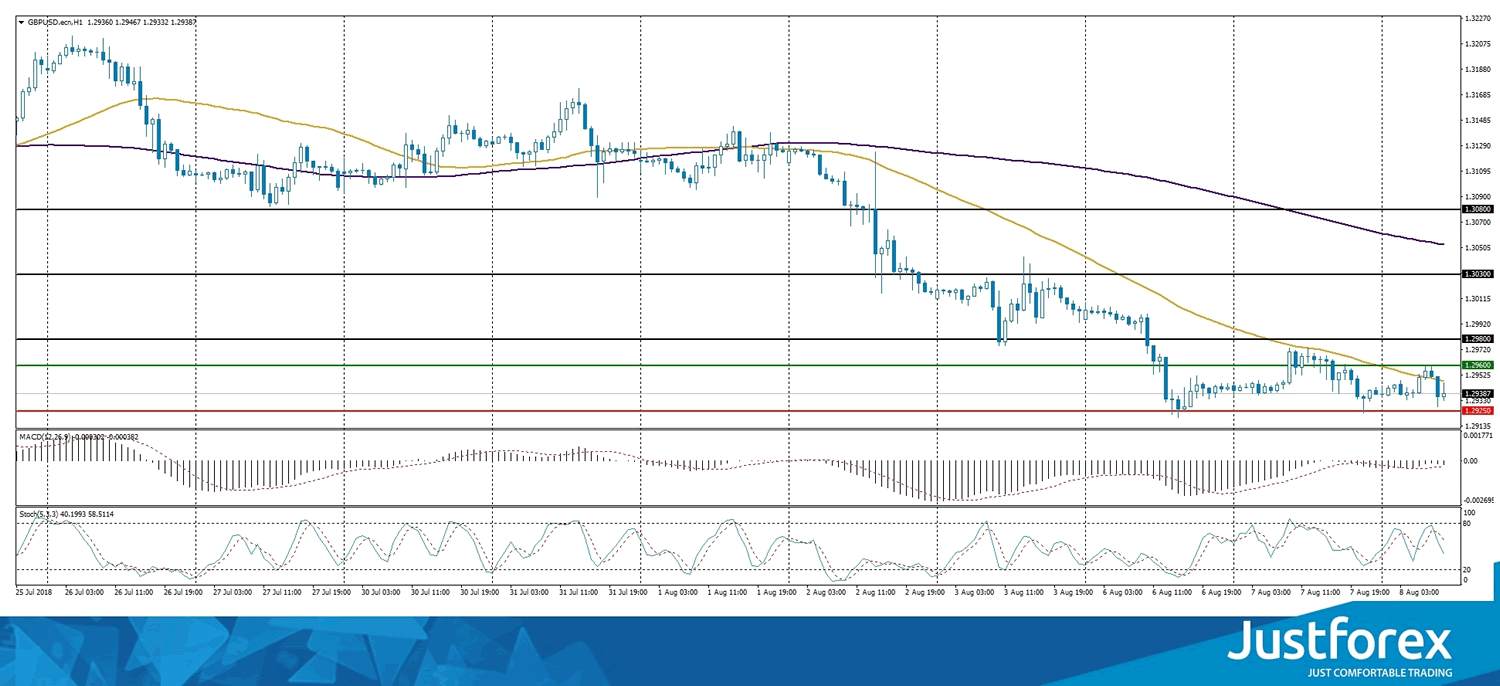
Indicators do not send accurate signals. The price is testing 50 MA.
The MACD histogram is in the negative zone, but above the signal line, which gives a weak signal to sell GBP/USD.
Stochastic Oscillator is located in the neutral zone, the %K line is below the %D line, which indicates the bearish sentiment.
Trading recommendations
Support levels: 1.29250, 1.29000
Resistance levels: 1.29600, 1.29800, 1.30300
If the price fixes below 1.29250, the GBP/USD quotes are expected to fall. The movement is tending to 1.29000-1.28750.
Alternative option. If the price fixes above the resistance of 1.29600, correction movement is expected. The movement is tending to the round level of 1.30000.
The USD/CAD currency pair
Technical indicators of the currency pair:
Prev Open: 1.30025
Open: 1.30521
% chg. over the last day: +0.42
Day's range: 1.30491 – 1.30736
52 wk range: 1.2059 – 1.3795
Yesterday, the Canadian dollar significantly weakened against the US dollar. The trading instrument has updated local extremes. This is due to the publication of weak data on economic activity from Ivey in Canada. At the moment, the USD/CAD quotes are consolidating in the range of 1.30500-1.30750. The USD/CAD currency pair has the potential for further growth.
Today, the news feed is rather calm:
Building permits in Canada at 15:30 (GMT+3:00).
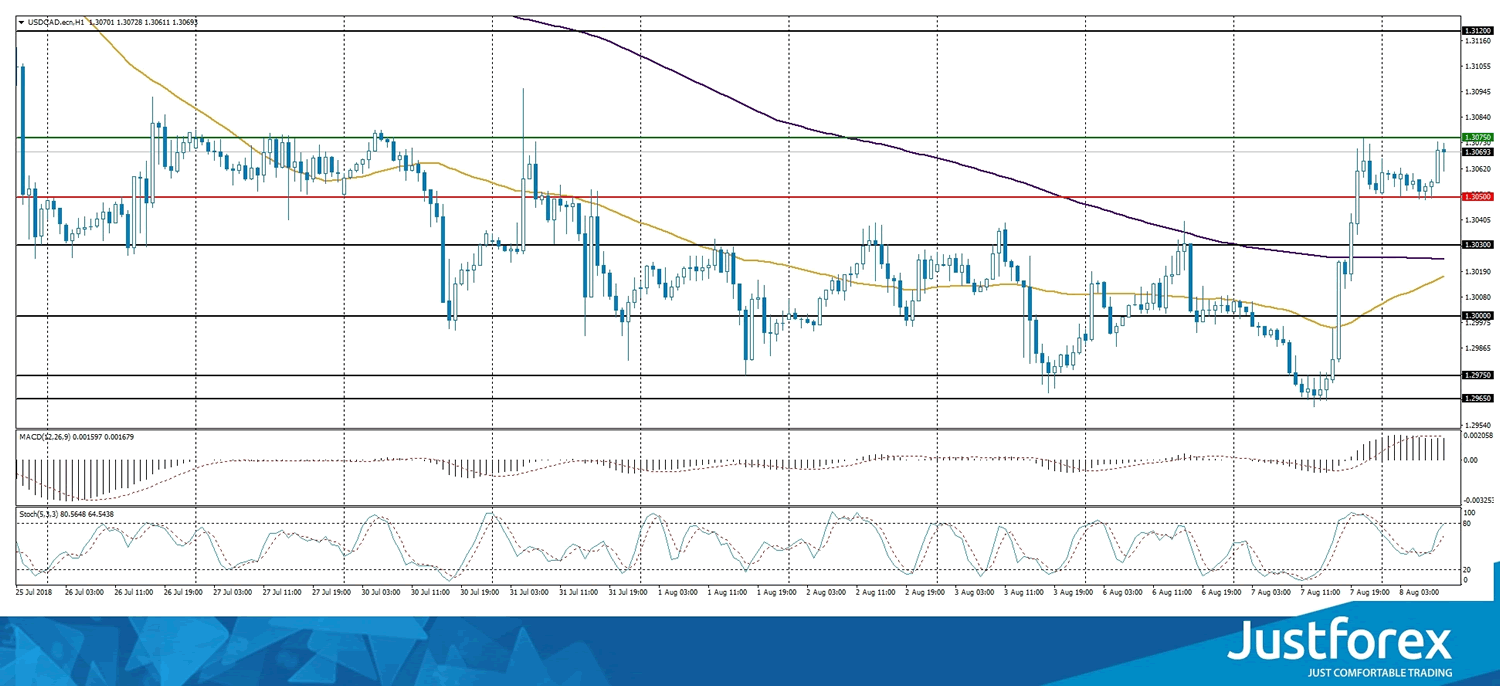
Indicators point to the power of buyers: the price has fixed above 50 MA and 200 MA.
The MACD histogram is in the positive zone, but below the signal line, which gives a weak signal to buy USD/CAD.
Stochastic Oscillator is located in the neutral zone, the %K line is above the %D line, which also gives a signal to buy.
Trading recommendations
Support levels: 1.30500, 1.30300, 1.30000
Resistance levels: 1.30750, 1.31200
If the price fixes above the key resistance of 1.30750, we recommend considering purchases of USD/CAD. The target movement level is 1.31000-1.31200.
Alternative option. If the price fixes below 1.30500, it is necessary to consider sales of USD/CAD. The movement is tending to 1.30300-1.30100.
The USD/JPY currency pair
Technical indicators of the currency pair:
Prev Open: 111.322
Open: 111.357
% chg. over the last day: -0.05
Day`s range: 110.837 – 111.437
52 wk range: 104.56 – 114.74
The USD/JPY currency pair is declining. The trading instrument has overcome the round level of 111.000, which is already a "mirror" resistance. The key support is 110.650. The USD/JPY quotes are tending to decline. We recommend paying attention to the dynamics of the US government bonds yield.
The news feed on the economy of Japan is calm.
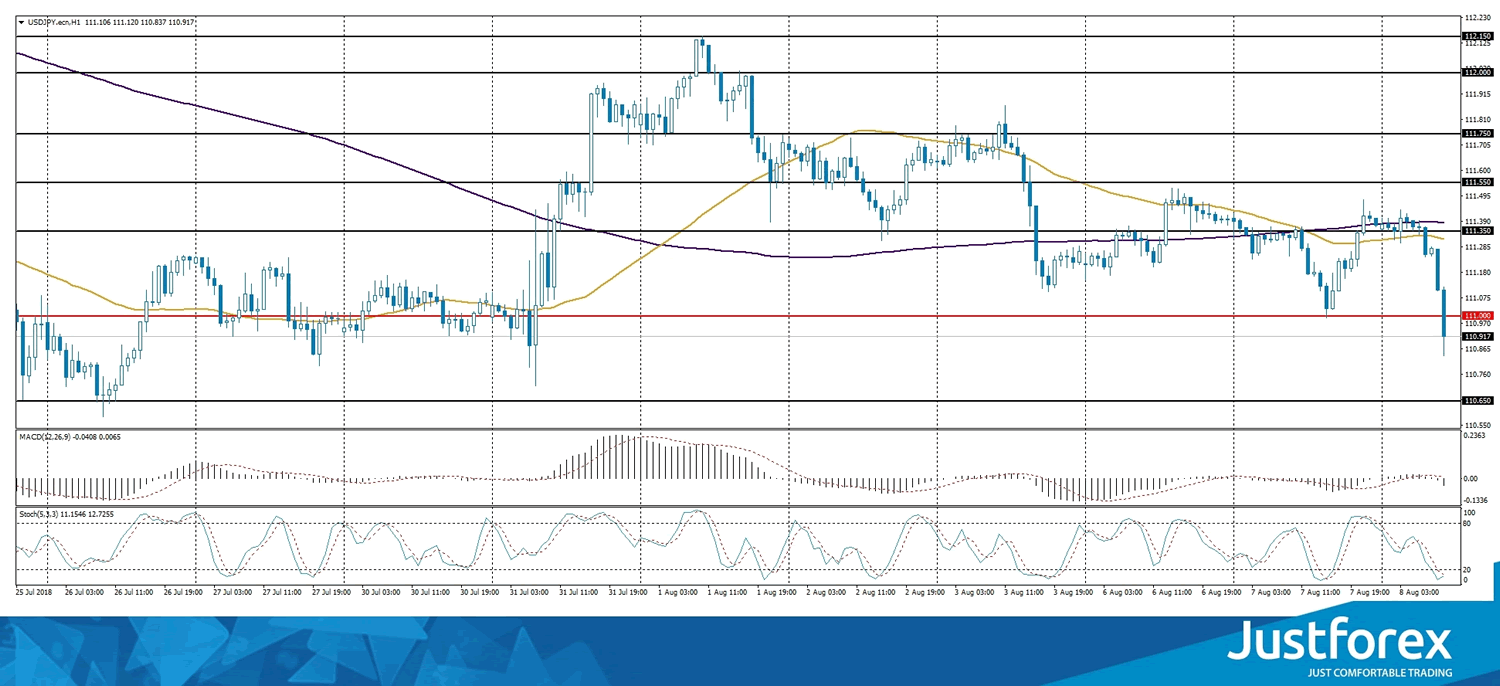
The price has fixed below 50 MA and 200 MA, which indicates the power of sellers.
The MACD histogram has started declining and moved to the negative zone, which signals the bearish sentiment.
Stochastic Oscillator is located in the oversold zone, the %K line is crossing the %D line. There are no accurate signals.
Trading recommendations
Support levels: 110.650, 110.150, 110.000
Resistance levels: 111.000, 111.350, 111.550
If the price fixes below the level of 110.850, it is necessary to look for entry points to the market to open short positions. The movement is tending to 110.500-110.250. When following the positions, we recommend using a trailing stop.
Forex Technical Analysis: EUR/USD, USD/JPY, GBP/USD
EUR/USD
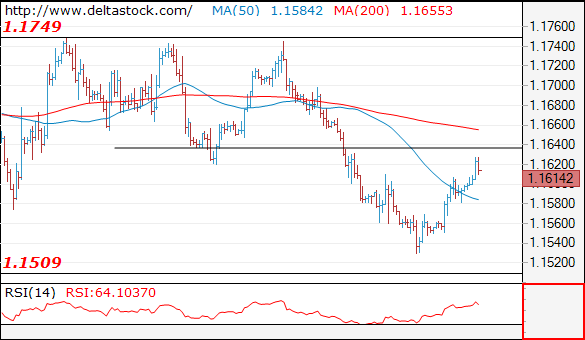
Current level - 1.1614
The pair is aiming at a tight test of 1.1640 resistance and the latter is expected to initiate a new wave downwards, for a break through 1.1509, en route to 1.1300 area.
| Resistance | Support | ||
| intraday | intraweek | intraday | intraweek |
| 1.1640 | 1.1750 | 1.1530 | 1.1510 |
| 1.1750 | 1.1830 | 1.1510 | 1.1300 |
USD/JPY
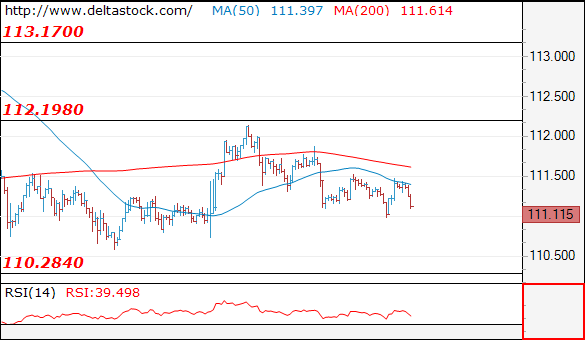
Current level - 111.11
The bias is bearish, for a slide towards 110.20 area and crucial on the upside is 111.50 peak.
| Resistance | Support | ||
| intraday | intraweek | intraday | intraweek |
| 111.50 | 114.50 | 110.25 | 110.25 |
| 113.20 | 114.50 | 110.25 | 109.30 |
GBP/USD
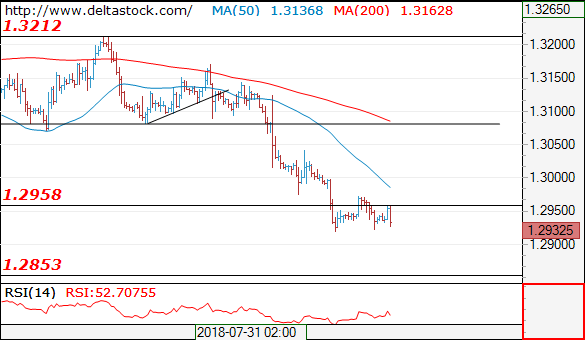
Current level - 1.2932
The general bias remains bearish, for a renewal of the downtrend towards 1.2770. Intraday there is a risk of another upswing to 1.2980 minor resistance.
| Resistance | Support | ||
| intraday | intraweek | intraday | intraweek |
| 1.2980 | 1.3210 | 1.2920 | 1.2960 |
| 1.3060 | 1.3460 | 1.2840 | 1.2770 |
China Trade Balance Unaffected By Trade War
China Trade balance unaffected by trade war
If there is a 'trade war' no one told China importers/exporters. China’s exports growth unexpectedly rose above expectations despite U.S tariffs and heavy media rotation of protectionist rhetoric. Imports also accelerated indicating solid domestic demand. A key focus for the market was Chinas surplus with the United Sates, which fell only marginally. China July trade balance came in at $28.05, Exports 12.2% vs. 10.0% y/y, Imports 27.3% vs. 16.5% y/y. Ironically for US President Trump the negative sentiment on trade which has driven the CNY against the USD, down 10% since April, actually supported exports. Yet with no sign either nation is prepared to back-down as disagreement expanding further then trade into intellectual property, investments and technical transfer, downside the risk to China’s growth has increased. In response, Chinese officials have moved proactively by releasing additional liquidity into the banking system and suggested further fiscal stimulus. As the potential for a trade war shifted from a tail-risk into base scenario, equites, specifically Chinese shares become vulnerable for deeper correction. Our base scenario, China will now seek to negotiate with the US to avoid further escalation, however, outcome is uncertain. The directional risk to the CNY at this point is at an unstable equilibrium.
NZD edges higher amid stronger inflation expectations
The New Zealand stood amongst the best performers within the G10 complex on Wednesday after the last RBNZ survey showed inflation expectations increased in the third quarter. Business managers anticipate a moderate pick-up as average annual inflation expectation increase to 1.86%y/y in the third quarter compared to 1.8% in the previous one, which is still below the central bank’s mid-range target. Two-year inflation expectations rose marginally to 2.04% from 2.01% three months ago.
The Reserve Bank of New Zealand is set to announce its monetary policy decision later today. However, the slight improvement in inflation expectations isn’t going to make the monetary institution raise rates. The Official Cash Rate should remain unchanged at record low 1.75%. According to the last survey, market participant do not expect the RBNZ to raise rates before at least the third quarter of 2019 – it is an optimistic view.
Speculators are still short the Kiwi as the net short speculative position as percentage of total open interest stabilized around 45%. Given this extreme positioning, the downside in NZD/USD is limited. The USD rally is slowly running out of steam. NZD/USD is currently trading around 0.6755, which is slightly higher than the bottom of its 3-month range. A return towards the 0.68-0.69 area appears the most likely scenario.
Crude oil futures contracts heading higher amid Trump sanctions against Iran
US sanctions on Iranian exporting goods have pushed oil prices higher since the beginning of the week. Despite concerns as to how demand could be affected by ongoing US – China trade tensions or Russian and Saudi Arabian plan to increase crude oil output, speculations towards lower supply are dominating the marketplace, although current sanctions do not directly concern Iran’s oil exports (i.e. USD purchases, automotive industry, coal, metals).
Accounting for 5% of total oil production, Iran, the third largest OPEC producer, is surely an important stakeholder of the industry, which can have a strong influence on the global market, but as US sanctions will be taking place at the beginning of November 2018, anything could happen since then. Strong oppositions expressed by China, India and the EU with regards to US sanctions against Iran could play an important role in the negotiations.
Since the beginning of the week, Brent crude, WTI and Shanghai Crude gained +2%, +1.11% and +4.51% and trade at $ 74.70, $ 69.25 and CNY 530.60 ($ 77.67) respectively.
As US crude inventories released by the API indicated a decline in inventories of 6 million barrels (consensus: -3.33 million barrels) and EIA inventories data are approaching later today and are expected to be lower (consensus: -2.16 million), a lift in crude prices is favored. WTI is heading along $ 69.90.
USDMXN Trades Around 3½-Month Low, Medium-Term Outlook Mostly Bearish
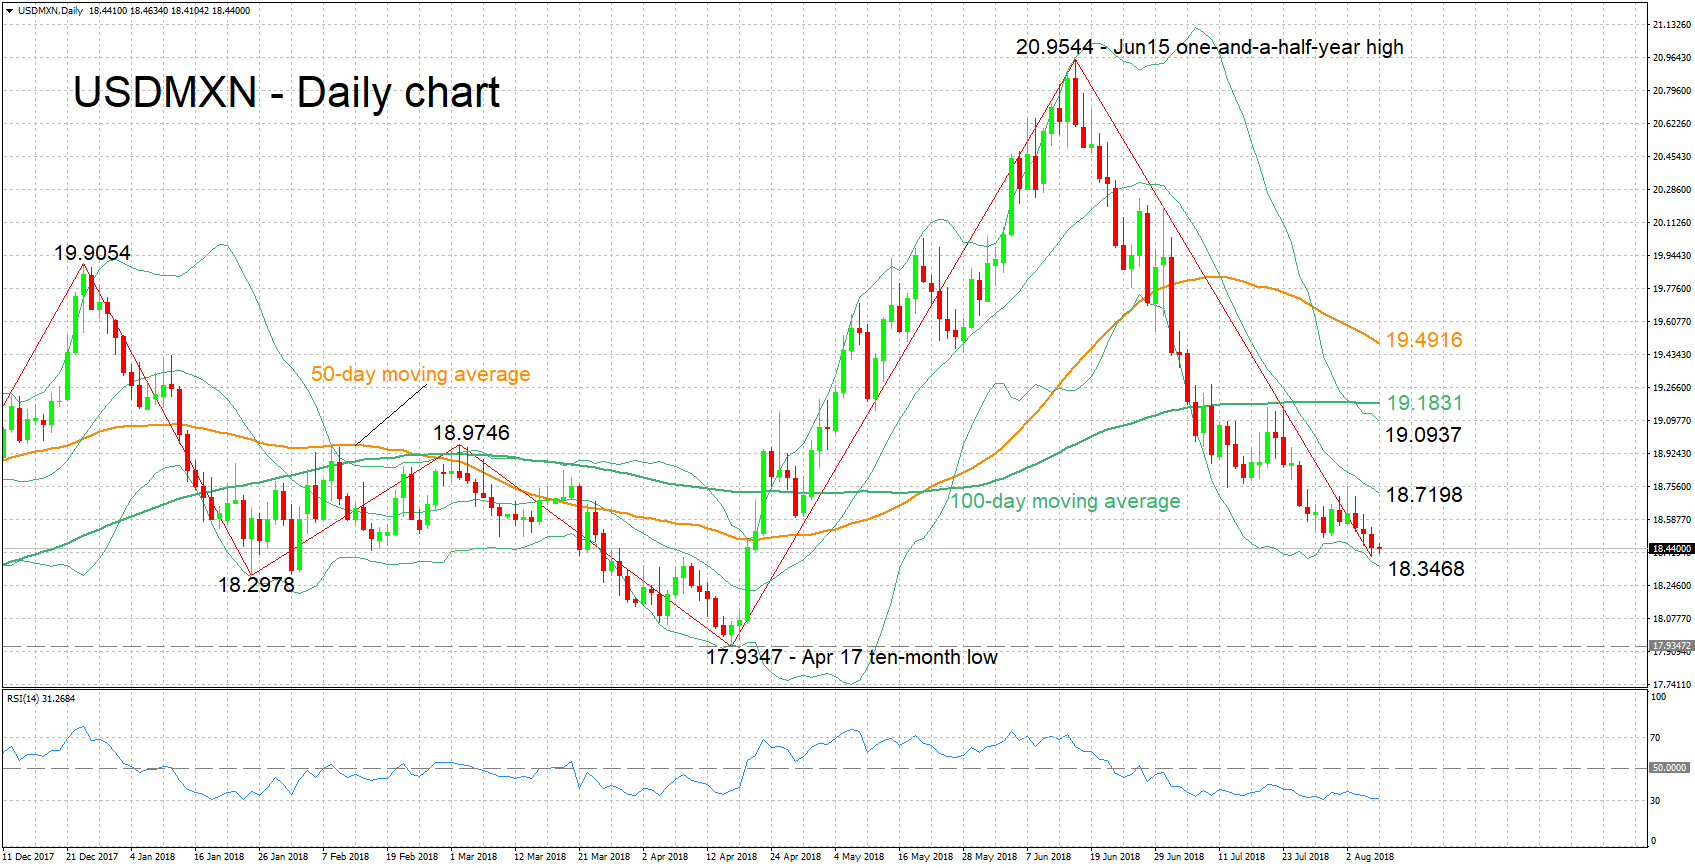
USDMXN has lost 12.0% of its value after reaching a one-and-a-half-year high of 20.9544 in mid-June. The pair is currently trading not far above the three-and-a-half-month low of 18.3993 hit on Tuesday.
The RSI, which is in bearish territory below 50, is projecting a negative short-term picture for the pair. Notice though that the indicator is not steeply negatively-sloped at the moment – a sign that bearish momentum has eased somewhat – as well as that it is close to the 30 oversold level; oversold conditions may render a near-term reversal more likely.
Additional declines may meet immediate support around the lower Bollinger band at 18.3468, with the area around it also encapsulating yesterday’s low of 18.3993. Further below, the 10-month low of 17.9347 recorded around mid-April would increasingly come into scope.
A reversal to the upside may meet resistance around the middle Bollinger line – a 20-day moving average line – at 18.7198. Meanwhile, steeper gains would turn the attention to the upper Bollinger band at 19.0937, with the current level of the 100-day MA lying not far above at 19.1831.
In terms of the medium-term picture, it is looking predominantly bearish with price action taking place below the 50- and 100-day MA lines.
Overall, both the short- and medium-term outlooks are looking negative. For perspective, USDMXN has retreated by 6.1% in the year-to-date.
EURJPY Tumbles Near 1-Month Low, Could Weaken Further
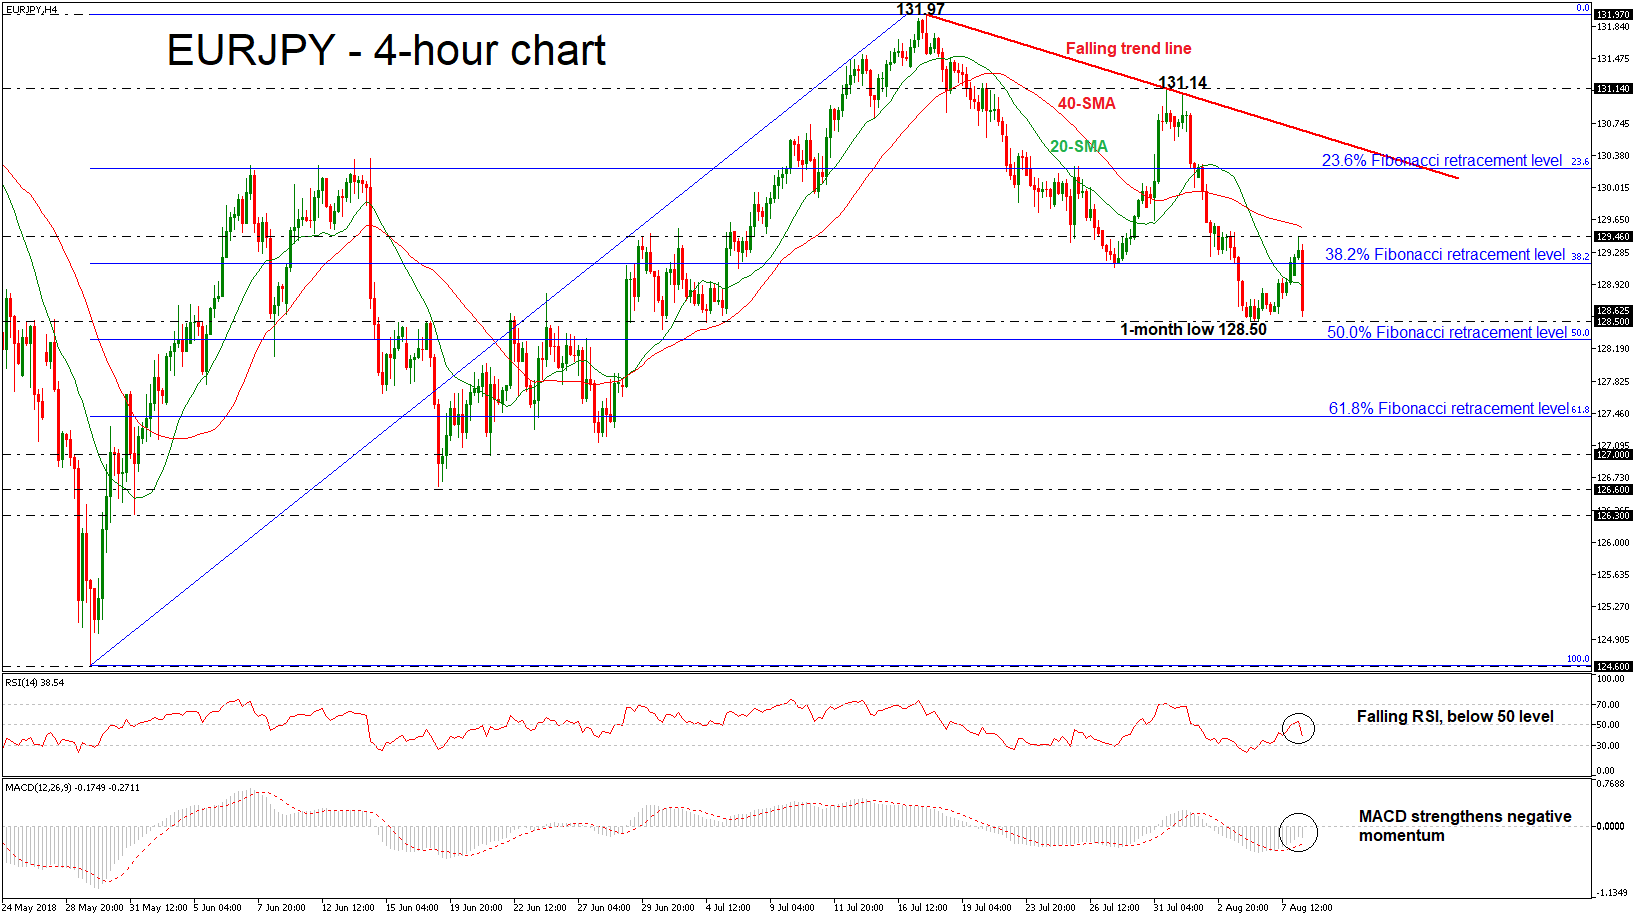
EURJPY has come under renew selling pressure today after it found resistance at the 129.46 obstacle. The price tumbled below the 20-simple moving average (SMA) in the 4-hour chart, indicating further losses. The technical indicators are confirming the strong bearish bias.
Looking at the short-term timeframe, the Relative Strength Index (RSI) dropped aggressively below the 50 level and is approaching with strong momentum the threshold of 30. Additionally, the MACD oscillator strengthened its negative structure below the zero line but is still moving above the trigger line.
In case of a further sell-off below the one-month low of 128.50, immediate support could be found near the 50.0% Fibonacci retracement level of 128.30 of the upleg from 124.60 to 131.97. Steeper declines could drive the price until the major hurdle of the 61.8% Fibonacci of 127.42.
On the other side, a rebound on the 128.50 support level could push the price higher towards the 38.2% Fibonacci around 129.15. Slightly higher the 129.46 could act as resistance level for the bulls and in case of a break above it could open the door for the 23.6% Fibonacci of 130.23. It is worth mentioning that the pair needs to surpass the 40-SMA for more upside movements.
Overall, EURJPY has been developing within a bearish correction mode since July 17 and the significant negative rally on Wednesday erased the previous days’ gains.
GBPUSD Hits New 2018 Trading Low
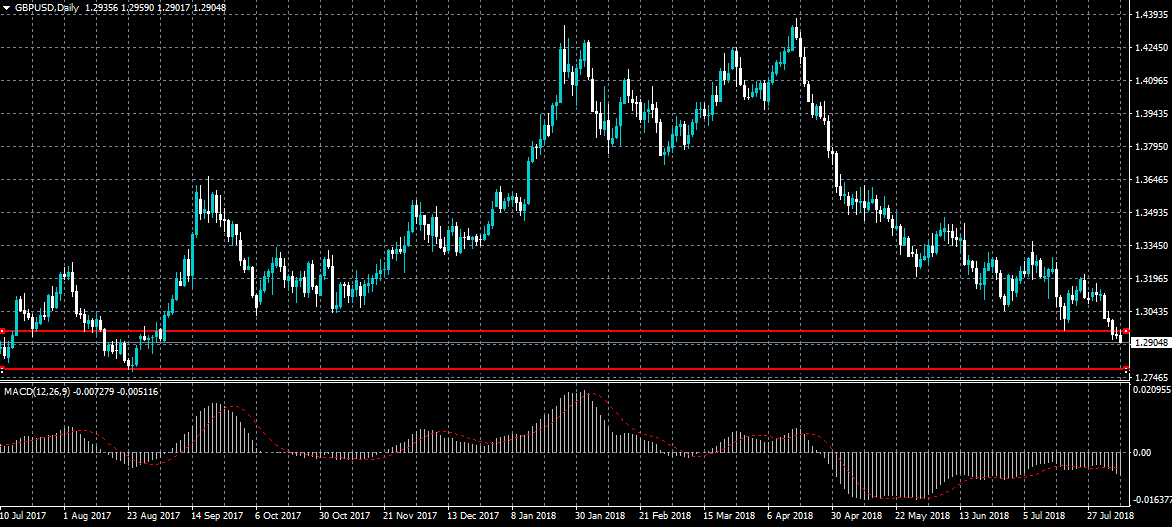
The British pound has fallen to its lowest trading level of 2018 so far against the US Dollar during the European trading session, as the previously mentioned head and shoulders pattern unfolds. The GBPUSD pair currently trades close to the 1.2900 support level, whilst the full downside projection of the bearish head and shoulders extends towards the 1.2750 support level.
The GBPUSD pair is strongly bearish while trading below the 1.2900 level, key support is now found at the 1.2880 and 1.2840 levels.
If the GBPUSD pair does moves above the 1.2955 level, key resistance is then now found at the 1.2975 and 1.3000 levels.
EURUSD Strongly Rejected From Triangle Pattern
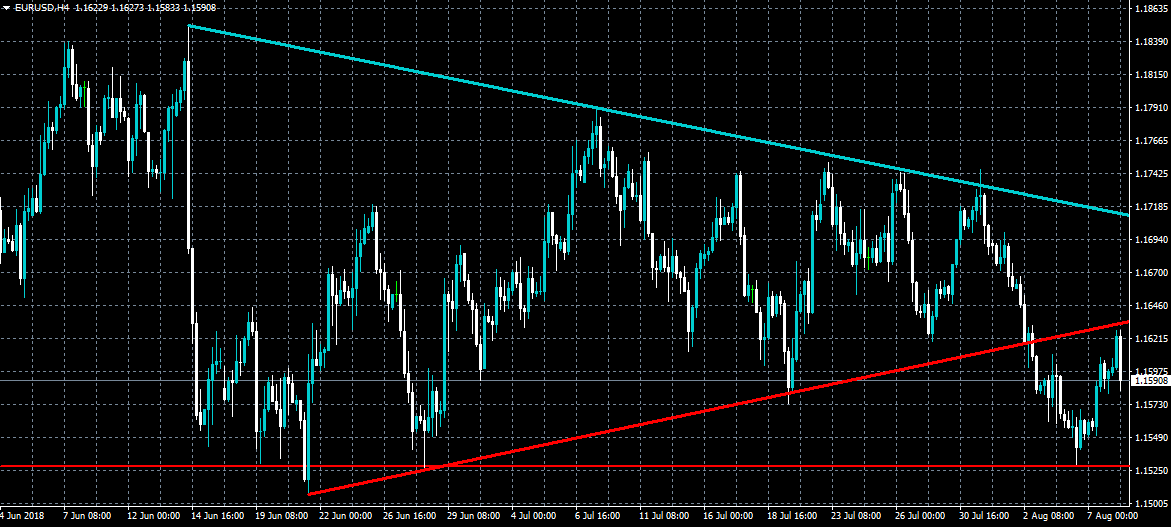
The euro has fallen below the key 1.1600 level against the greenback after buyers earlier failed to break inside the symmetrical triangle pattern. The EURUSD pair has also weakened as the US dollar index held key technical support this morning. Sellers will now aim to push the price below the 1.1554 level, while buyers will once again attempt to break trendline resistance.
The EURUSD pair is intraday bearish while trading below the 1.1600 level, key support remains at the 1.1553 and 1.1527 levels.
If the EURUSD pair trades above the 1.1600 resistance level once again, buyers may test towards the 1.1630 and 1.1650 resistance levels.
ECB policy contributed considerably to private consumption growth
ECB released a bulletin article "Private consumption and its drivers in the current economic expansion" today. It argues that private consumption has been a main driver of growth in the current cycle that started back in 2013. And this has been "largely driven by the recovery in the labour market". And, as labor markets continue to improve, " consumer confidence should remain elevated and private consumption should rise further"
At the same time, the article said that ECB's accommodative monetary policy has "contributed considerably to the expansion of private consumption". At the same time, the policies have also "directly decreased income and wealth inequality". There is little evidence that low interest rates have led to generalized increases in household indebtedness. And therefore, the overall economic expansion is "sustainable".
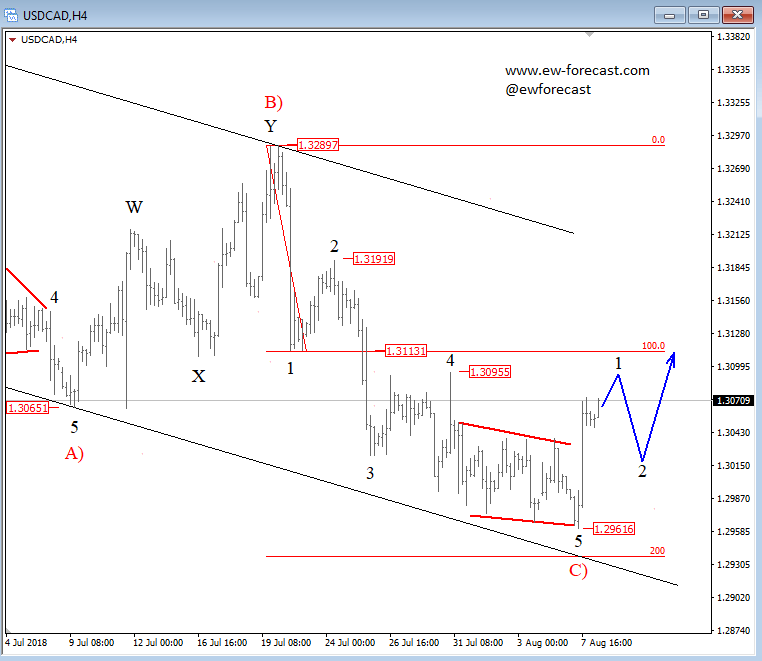
Elliott Wave Analysis: USDCAD In A Temporary Correction
USDCAD is turning nicely to the upside, now suggesting that a five wave decline can be done for wave C) which means more upside can be coming. In fact, an intraday reaction from yesterday is looking like an impulse away from the lower side of a downward channel, so pullback of wave 2 can be interesting to join the dollar strength.
USDCAD, 4h
Italy Tria revised down 2018 and 2019 growth forecasts
Italian Economy Minister Giovanni Tria told the parliament said the government have downgraded growth forecast for both this year and next.
2018 GDP growth is projected to be 1.2%, down from prior forecast of 1.5%. 2019 GDP growth is projected to be at 1-1.1%, down from prior forecast of 1.4%.
Tria added that the slowdown would bring deficit to 1.2% in 2019, higher than deficit target of 0.8% of GDP, drawn up by prior administration.
A more clearer estimate of the deficit will be available later in September. The figures will depend on the cost of servicing the debts and spending cuts.
While the plan appears to be at odds with EU rules, Tria emphasized that it's still "compatible" with Italy's commitment to EU on its public finances.