Sample Category Title
XAU/USD Enters Between Strong Levels
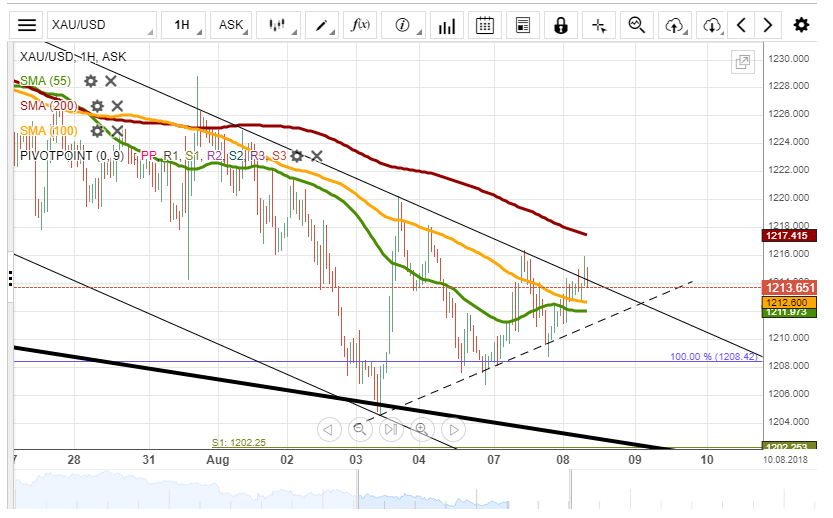
XAU/USD has been diminishing its trading range for the last three sessions. This has left the rate in a triangle-like formation between a channel line and a trend-line.
Gold breached the 55– and 100-hour SMAs and the aforementioned channel early on Wednesday. However, it is unlikely that a surge could follow today, as a strong resistance level is formed by the 200-hour and 55-period (4H) SMAs near 1,220.00. Likewise, technical indicators flash bearish signals for the pair today.
It seems that the 55– and 100-hour SMAs at 1,210.00 could surrender, thus sending the rate lower down to the monthly S1 at 1,202.00.
Dollar Consolidates Expecting Possible Rally
Financial markets rise on positive sentiments about earnings and China’s fiscal stimulus. That pushed down the demand for USD, but more likely it is just a step back before the jump.
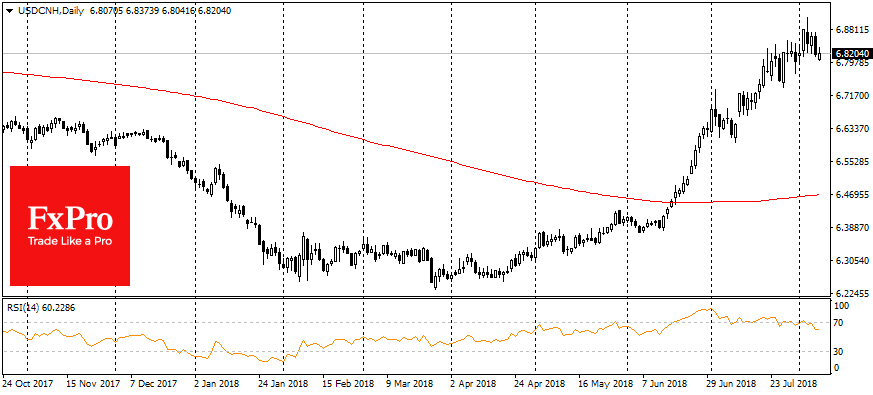
American indices added yesterday on strong earnings reports, where tax cuts were favourable for profit. Asian indices in the morning add on speculation that China will protect local companies from the trade conflict with the U.S. through fiscal stimulus. Besides, the restrictions on speculation introduced by Beijing a few days ago had a positive impact on Chinese bourses and the yuan. As a result, The Renminbi increased by more than 1% to U.S. Dollar.
Globally, the dollar recedes this week and turns lower from the important resistance levels. The dollar index has turned to a decline, failing to gain a foothold above 95, and this morning it loses another 0.2%, increasingly receding in the middle of the three-months trading range. The important resistance has once again shown its strength. Often, after an unsuccessful testing of extremums, it is necessary to expect a rollback in the middle of the trading range (-0.5% to 94.4) or to its bottom (-1.3% to 93.60).
However, it should be noted that global risks are still offset in favour of the dollar: the fears of trade wars and a slowdown in the growth of the global economy.
In these circumstances, beyond short-term fluctuations, the American currency still retains the potential to strengthen and exit the trading range of the recent months. August is considered to be a quiet month with low activity in capital markets, but at this time usually the basis for the rally builds up for the next few months.
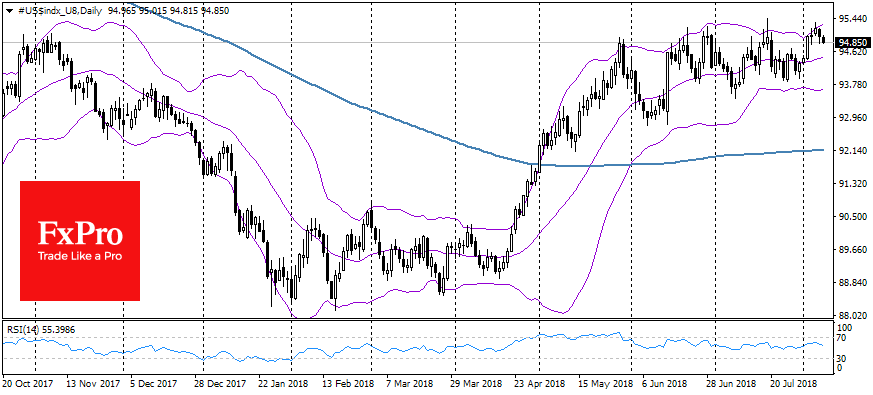
The period of trading in the channel can quickly be changed by the rise of volatility, as it was in April after the consolidation in January-April, when DXY had added 6% for a month and a half with almost no adjustments. A similar scope of movement this time will allow the dollar index to return to the psychologically important boundary of 100.
As we note yesterday, in the short-term the dollar growth can reduce inflationary pressure in the US and deter the Fed from excessive tightening of monetary policy.
The US Currency Weakened
The US dollar slightly weakened against the basket of major currencies during yesterday's trading. The US dollar index (#DX) closed in the negative zone (-0.20%). Yesterday, a report on JOLTS job openings was published. In June, the number of jobs increased to 6.662M, but it was still worse than the forecasts of investors who expected the value of 6.740M. In May, the value was revised from 6.638M to 6.659M.
The Canadian dollar fell against the US dollar. The index of business activity from Ivey counted to 61.8 in July and was worse than the forecasted value of 64.2. Today, during the Asian trading session, mixed data on China's trade balance have been also published.
The "black gold" prices are rising after the US sanctions against Iran have again come into effect. At the moment, futures for the WTI crude oil are testing a mark of $69.15 per barrel. At 17:30 (GMT+3:00), a report on the US crude oil inventories will be published.
Market Indicators
Yesterday, the bullish sentiment was observed in the US stock market: #SPY (+0.33%), #DIA (+0.50%), #QQQ (+0.36%).
At the moment, the 10-year US government bonds yield is at the level of 2.96% -2.97%.
The news feed on 2018.08.08:
Important economic news is not expected to be published today.
AUDUSD Remains In Sideways Channel, Bearish Outlook In Medium Term
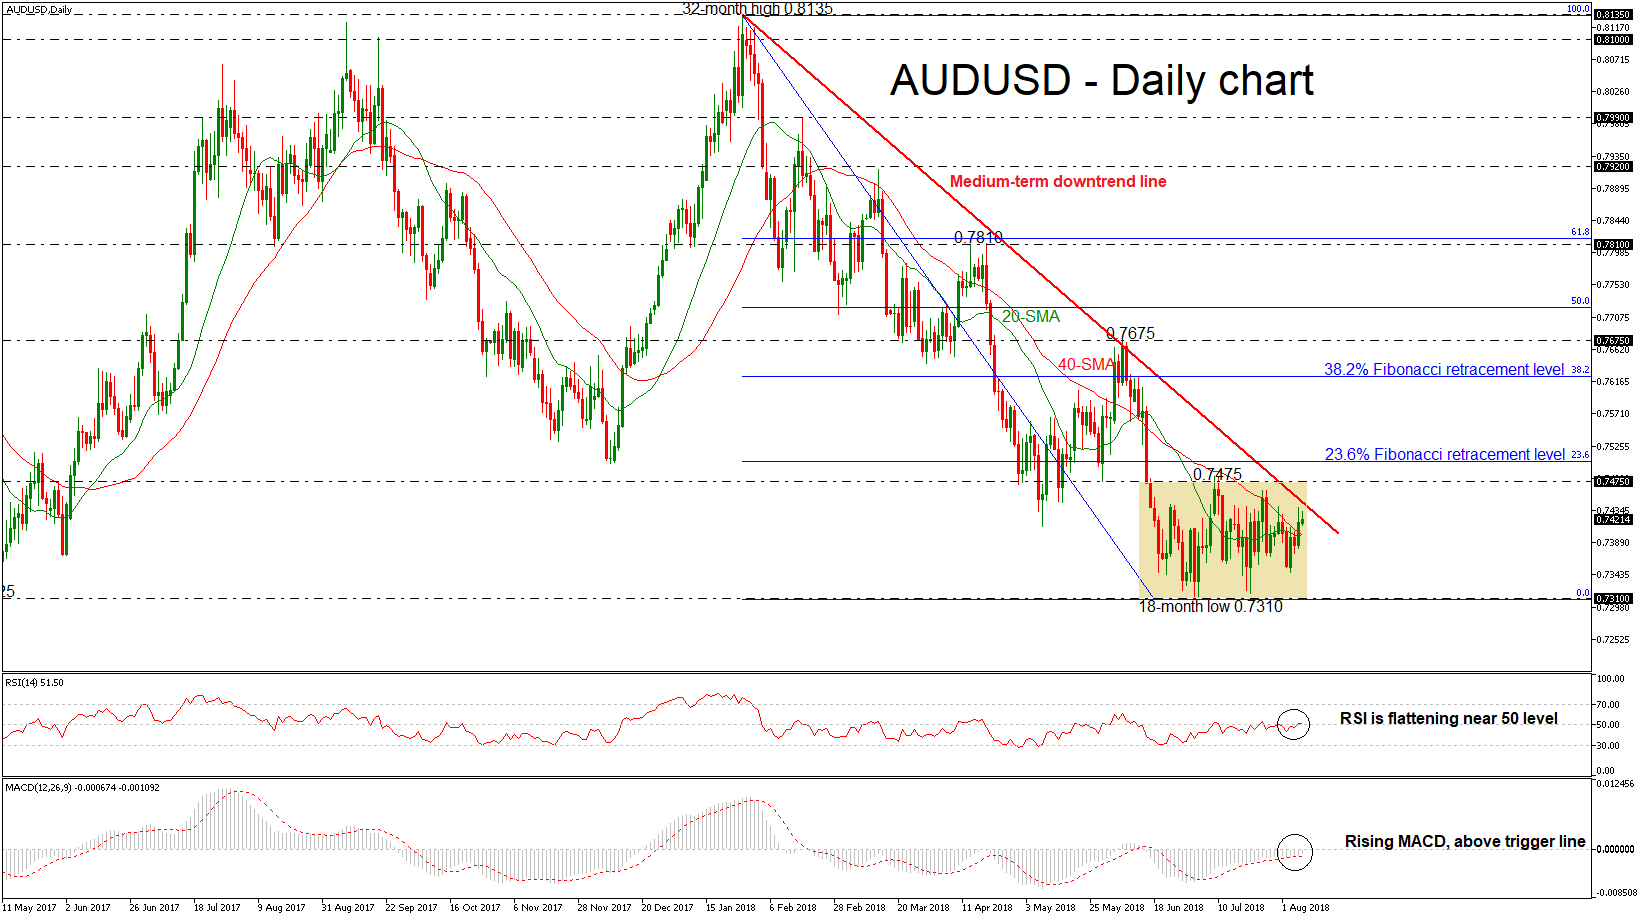
AUDUSD has been struggling within a consolidation area during the last seven weeks with upper boundary the 0.7475 resistance level and lower boundary the 18-month low of 0.7310. Furthermore, the pair successfully surpassed the 20- and 40-simple moving averages (SMAs) in the daily timeframe.
Technically, momentum indicators are endorsing the neutral to bullish movement in the market. The RSI indicator is flattening and stands near the threshold of 50, however, the MACD oscillator is moving higher in the negative territory above its trigger line and is approaching the zero line with weak momentum. Also, the SMAs are ready to record a bullish crossover in the near term.
Moving higher, the first resistance for investors to have in mind is the upper boundary (0.7475). If there is a jump above this region, the price could challenge the 23.6% Fibonacci retracement level of 0.7505 of the downleg from 0.8135 to 0.7310, increasing the chances for a bullish retracement. Above this barrier, if there is an upside penetration of the falling trend line, the focus shifts to the upside until the 38.2% Fibonacci of 0.7625.
However, if the price slips below the moving averages, this could open the way towards the 18-month low (0.7310). Further downside extensions could drive the pair until the 0.7160 hurdle, where it bottomed on December 2016.
To conclude, in the bigger picture, AUDUSD has been trading within a descending move since January 26, however, in the short-term price action endorses the scenario for a sideways move but it also remains below the downtrend line.
Euro Advances As Sterling & Dollar Retreat, RBNZ Meeting Eyed
Here are the latest developments in global markets:
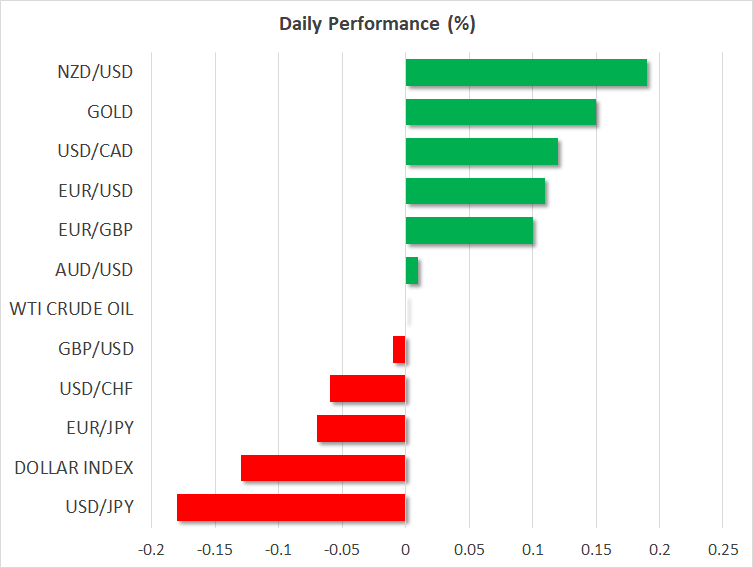
FOREX: The US dollar index – which measures the greenback’s performance against a basket of six major currencies – is down by 0.13% on Wednesday, extending the pullback that started in the previous session. The euro capitalized both on the dollar’s correction and on some weakness seen in sterling. Meanwhile, the loonie plunged even in the absence of any NAFTA news.
STOCKS: US markets continued their upward march on Tuesday, with the lack of any significant escalation on the trade front and strong earnings results fueling the optimism. The Dow Jones rose by 0.50% and for the fourth consecutive day, while the Nasdaq Composite and the S&P 500 gained 0.31% and 0.28% respectively. Both the S&P and the Nasdaq are now within breathing distance of their all-time highs. That said, futures tracking the Dow, S&P, and Nasdaq 100 are all pointing to a negative open today, albeit only marginally so. Asia was mixed on Wednesday. In Japan, the Nikkei 225 and the Topix inched lower by 0.08%, but in Hong Kong, the Hang Seng rose by 0.17%. In Europe, all the major indices were set for a lower open today, according to futures.
COMMODITIES: In energy markets, oil prices are more or less flat on Wednesday, following some gains in the previous session. WTI is practically unchanged at $69.16 per barrel, while Brent is down by a marginal 0.07% at $74.57. The precious liquid responded little to data released overnight showing that China’s crude oil imports rose by 1.5% in July, recovering from the six-month low hit in June. In precious metals, gold prices are up by 0.15% at $1,215, capitalizing slightly on the correction lower seen in the US dollar.
Major movers: Euro advances as pound & dollar retreat; loonie slides
The euro was the winner in Tuesday’s session, advancing against most of its major counterparts, and most notably versus the battered British pound, which has been suffering at the hands of speculation for a no-deal Brexit. Euro/sterling is up by 0.1% on Wednesday as well, touching a fresh 8-month high of 0.8975 as the Brexit risk premium on the pound appears to be rising – with the latest cautious turn by the BoE likely amplifying the negative sentiment.
The dollar, meanwhile, corrected lower yesterday and has continued to retreat on Wednesday, with the dollar index being down by 0.13%. There was little in the way of fresh news flow or data releases to justify the move, so its underperformance may have been primarily a case of profit-taking, following recent gains.
Turning to commodity-linked currencies, the Canadian dollar saw a sharp selloff yesterday. Dollar/loonie surged by roughly 100 pips, from around 1.2960 to 1.3060, even despite a broadly weak US dollar and an uptick in oil prices. Given the absence of any developments around NAFTA, the loonie’s slide appears to have been owed mainly to a softer-than-expected Ivey PMI for July, released yesterday.
In the antipodeans, kiwi/dollar is up by 0.18% today, after the RBNZ released its 2-year inflation expectations for Q3 overnight. The print rose only marginally, to 2.04% from 2.01% previously, but still probably enhanced the narrative that inflationary pressures in New Zealand are slowly mounting. Now, all eyes turn to the RBNZ policy decision at 2100 GMT. Aussie/dollar is nearly flat today, unable to extend its RBA-induced gains from yesterday, even despite some stronger-than-expected trade data from China overnight.
In equities, all eyes were on Tesla yesterday (+10.99%), after CEO Elon Musk tweeted he is considering taking the electric car-maker private. He suggested shareholders would be offered $420 per share, much higher than the $342 the stock was trading at prior to his announcement, or even the $379 that the share closed the day at. The decision is not final yet, pending a shareholders’ vote.
Day ahead: RBNZ meeting in focus; trade developments remain in the spotlight
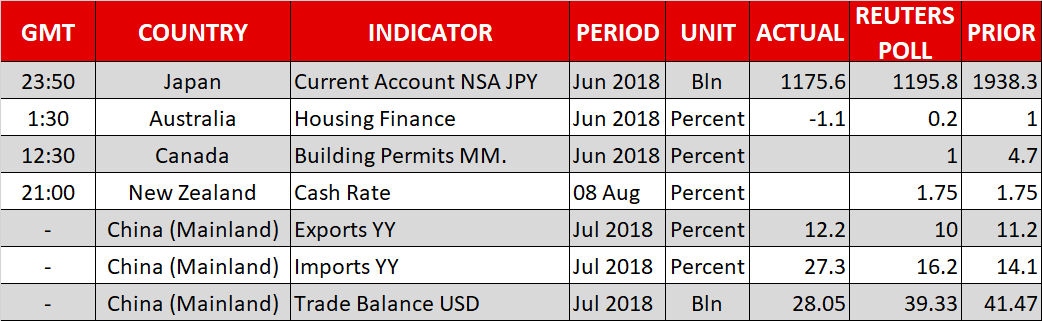
The highlight out of Wednesday’s calendar will be the conclusion of the RBNZ meeting on monetary policy.
Canadian building permits data for June will be made public at 1230 GMT.
The Reserve Bank of New Zealand’s rate decision is due at 2100 GMT, with the central bank widely anticipated to maintain its policy rate at the record low of 1.75%. During its latest meeting, the Bank tilted dovish by saying that the next move in rates could be both higher or lower, putting the prospect of a rate reduction back in focus amid rising risks. Should this pick up traction upon completion of the meeting, then the kiwi is expected to come under pressure. If, on the other hand, the statement accompanying the decision and the Governor Adrian Orr during the press conference at 2200 GMT paint a positive picture on the outlook for the economy, then the NZD is likely to rise. Any comments by the Bank on the state of global trade and how it can affect New Zealand’s economy are also likely to attract attention.
Remaining on trade, tensions between the US and China remain in place, with the former saying it will begin applying 25% duties on an additional $16 billion worth of Chinese imports in two weeks’ time.
Richmond Fed President Tom Barking – a voting FOMC member in 2018 – is scheduled to deliver a speech at 1230 GMT.
In equities, Twenty-First Century Fox will be releasing quarterly results after Wednesday’s closing bell on Wall Street.
In energy markets, oil traders will be paying attention to weekly EIA data on US crude stocks due at 1430 GMT; a drawdown by around 3.3 million barrels is anticipated during the week ending August 3 after a buildup by roughly 3.8m barrels in the previously tracked week.
Technical Analysis: WTI oil futures neutral in the short-term
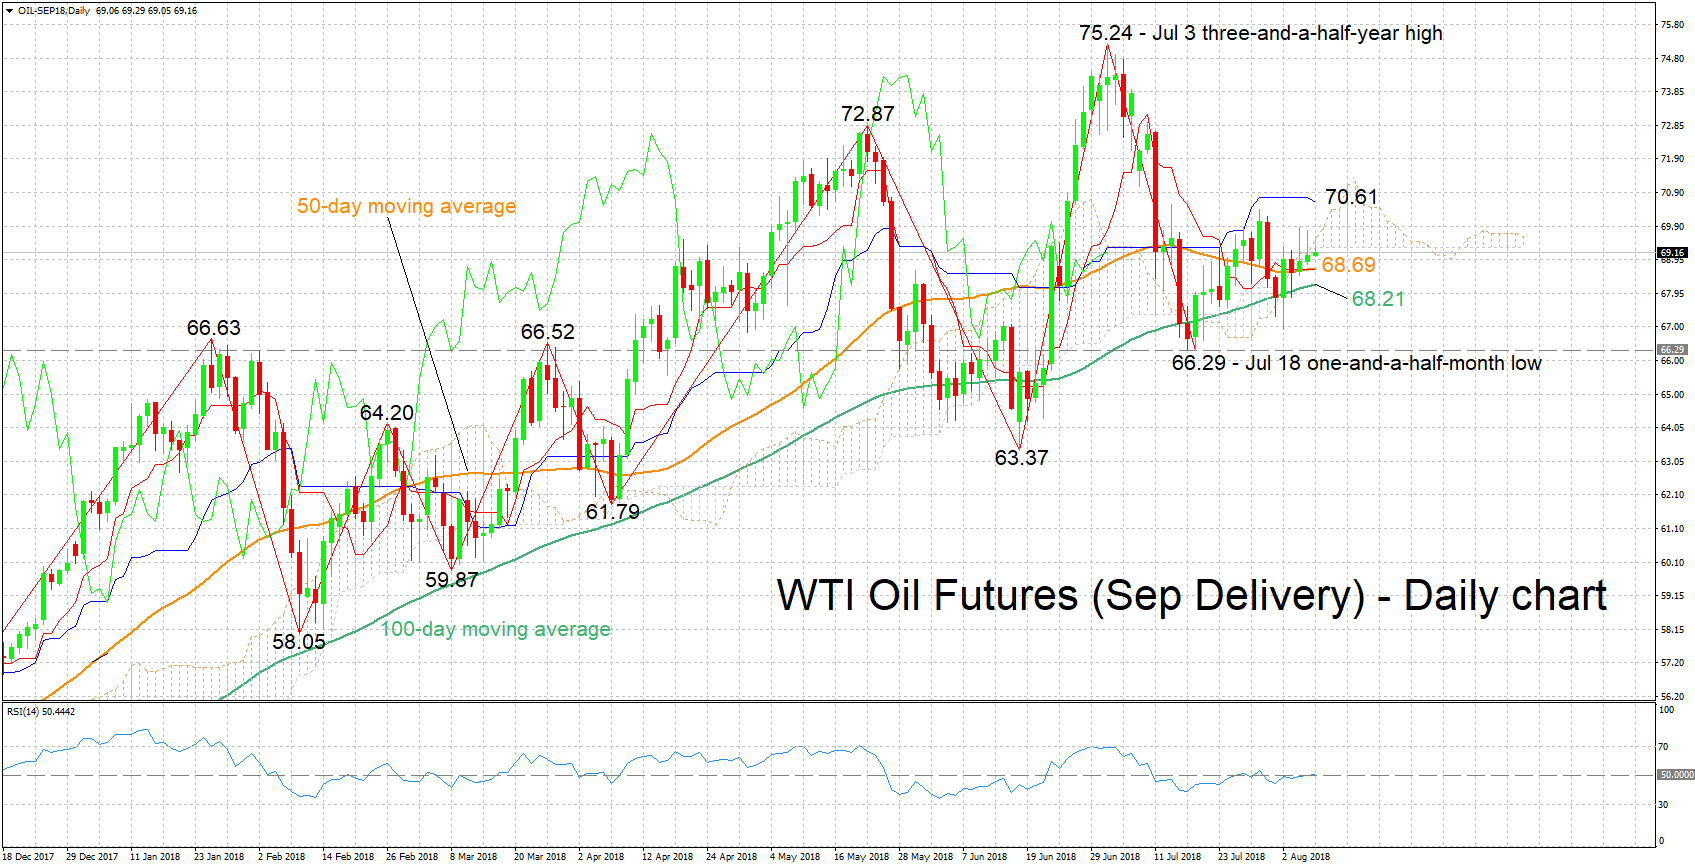
WTI oil futures (September delivery) have been moving within a relatively narrow range between roughly 67 and 70 since late July. The Tenkan- and Kijun-sen lines are negatively aligned though the two have been largely moving sideways in recent days, on balance projecting a neutral picture in the short-term. The RSI, which is at the 50 neutral-perceived level and has been moving around this point lately, also lends credence to the view for a neutral near-term bias.
Should today’s EIA report show a lager drawdown in crude stocks than anticipated, then prices may rise. Immediate resistance may be taking place around the Ichimoku cloud bottom and top at 69.30 and 69.54 respectively. Further above, the Kijun-sen at 70.61 would be eyed, with the three-and-a-half-year high of 75.24 increasingly coming into scope in case the Kijun-sen is violated to the upside.
If the data reflect a smaller-than-expected drawdown or a buildup in stocks however, prices may head lower. Initial support to losses could come around the current levels of the 50- and 100- day moving average lines at 68.69 and 68.21 correspondingly. Sharper losses would turn the focus the one-and-a-half-month low of 66.29 hit on July 18
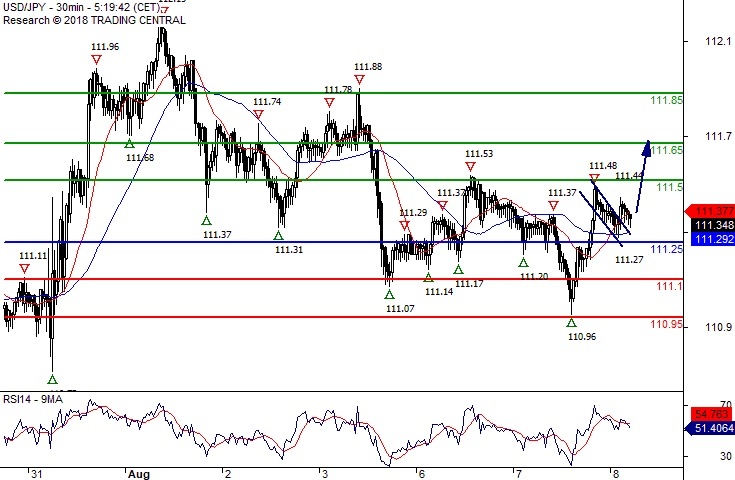
USD/JPY The Bias Remains Bullish
Pivot (invalidation): 111.25
Our preference Long positions above 111.25 with targets at 111.50 & 111.65 in extension.
Alternative scenario Below 111.25 look for further downside with 111.10 & 110.95 as targets.
Comment Technically the RSI is above its neutrality area at 50.
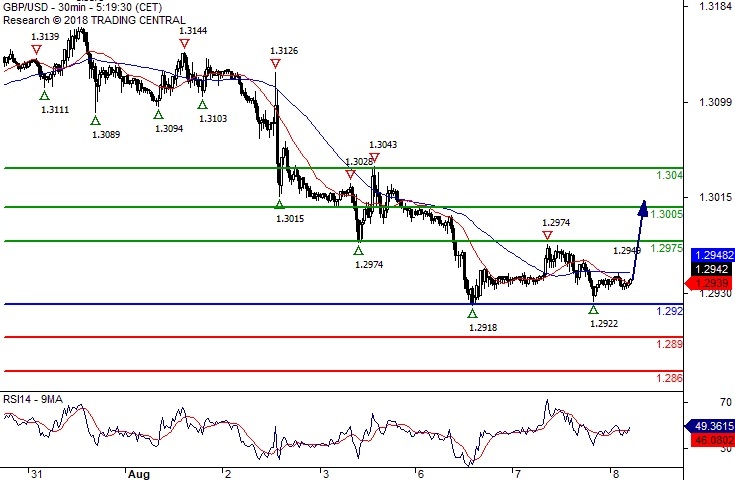
GBP/USD Limited Upside
Pivot (invalidation): 1.2920
Our preference Long positions above 1.2920 with targets at 1.2975 & 1.3005 in extension.
Alternative scenario nBelow 1.2920 look for further downside with 1.2890 & 1.2860 as targets.
Comment A support base at 1.2920 has formed and has allowed for a temporary stabilisation.
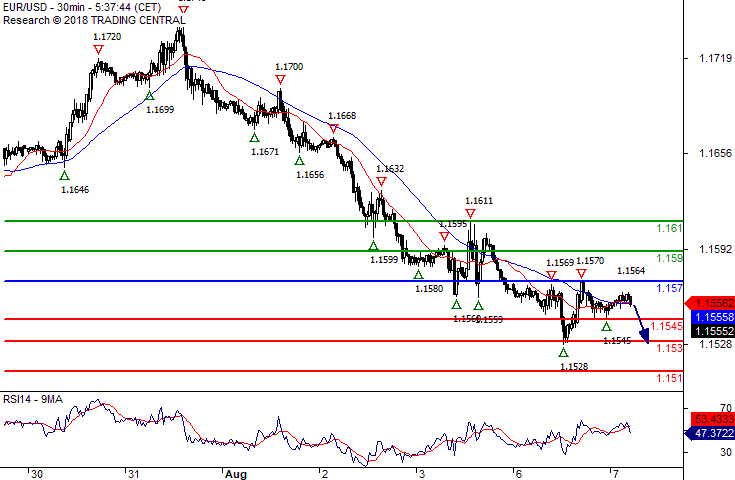
EUR/USD The Upside Prevails
Pivot (invalidation): 1.1580
Our preferencLong positions above 1.1580 with targets at 1.1630 & 1.1655 in extension.
Alternative scenario Below 1.1580 look for further downside with 1.1550 & 1.1530 as targets.
Comment The RSI advocates for further upside.
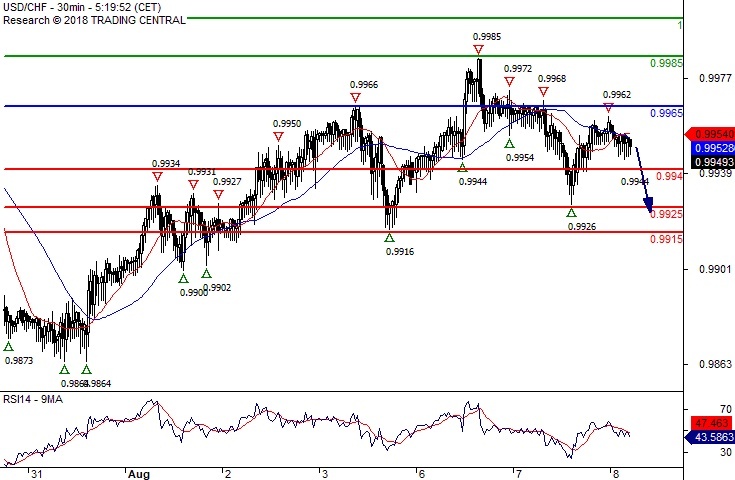
USD/CHF Under Pressure
Pivot (invalidation): 0.9965
Our preference Short positions below 0.9965 with targets at 0.9940 & 0.9925 in extension.
Alternative scenario Above 0.9965 look for further upside with 0.9985 & 1.0000 as targets.
Comment As Long as the resistance at 0.9965 is not surpassed, the risk of the break below 0.9940 remains high.
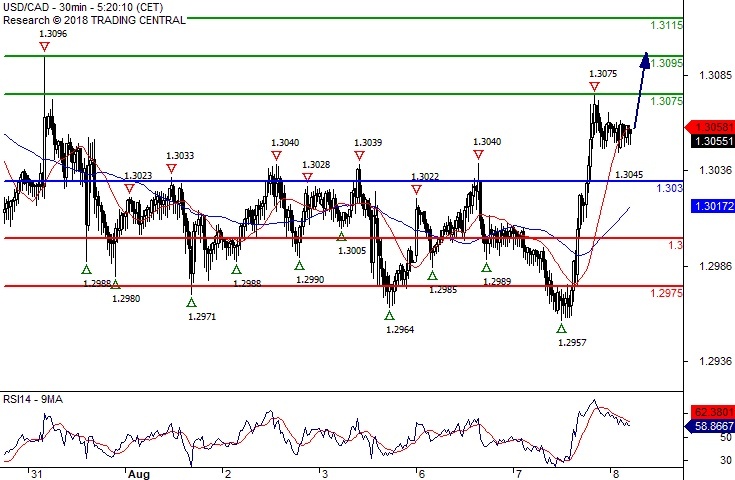
USD/CAD Towards 1.3075
Pivot (invalidation): 1.3030
Our preference Long positions above 1.3030 with targets at 1.3075 & 1.3095 in extension.
Alternative scenario Below 1.3030 look for further downside with 1.3000 & 1.2975 as targets.
Comment The break above 1.3030 is a positive signal that has opened a path to 1.3075.