Sample Category Title
USD/CAD Daily Outlook
Daily Pivots: (S1) 1.2985; (P) 1.3030; (R1) 1.3100; More...
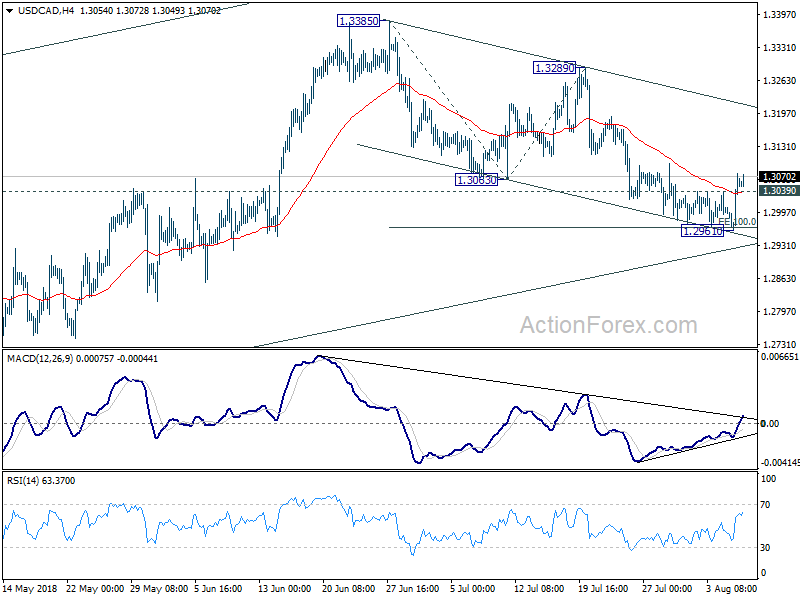
USD/CAD's break of 1.3039 minor resistance argues that correction from 1.3385 could have completed with three waves down to 1.2961. Intraday bias is turned back to the upside for 1.3289 resistance. Decisive break there will confirm an target 1.3385 and above. In case of another fall, we'd continue to expect strong support from rising channel line (now at 1.2924) to contain downside to bring rebound.
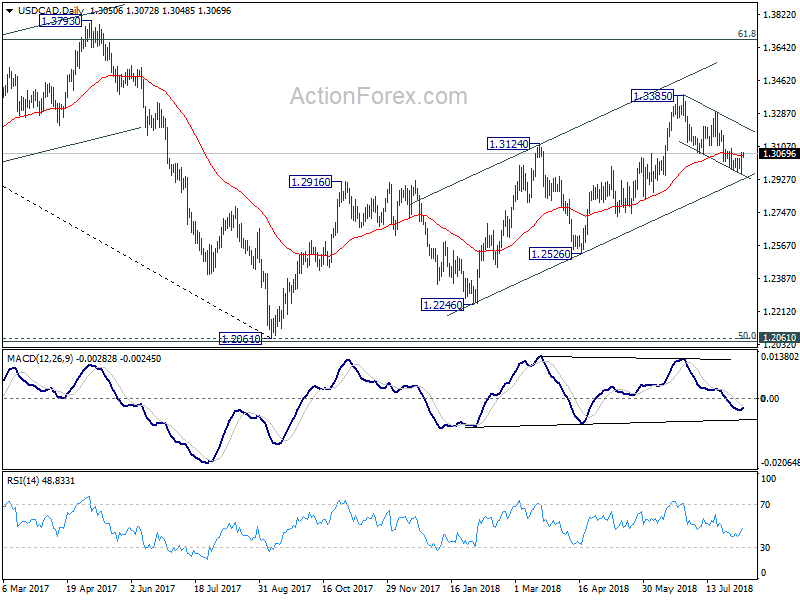
In the bigger picture, as long as channel support (now at 1.2924) holds, we're holding to the bullish view. That is, fall from 1.4689 (2015 high) has completed at 1.2061, ahead of 50% retracement of 0.9406 (2011 low) to 1.4689 (2015 high) at 1.2048. Further rally should be seen for 61.8% retracement of 1.4689 to 1.2061 at 1.3685 and above. However, sustained break of the channel support will argue that rise from 1.2061 has completed and will bring deeper fall to 1.2526 support to confirm.
Does Not See A Strong Case For A Near-Term Policy Change: RBA Governor, Philip Lowe
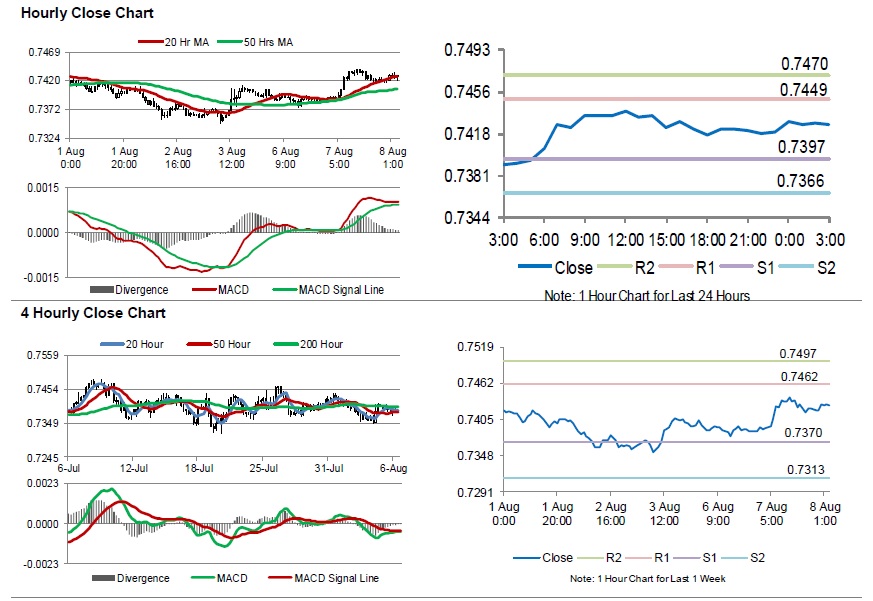
For the 24 hours to 23:00 GMT, the AUD rose 0.46% against the USD and closed at 0.7420.
LME Copper prices rose 1.5% or $92.0/MT to $6132.0/MT. Aluminium prices rose 1.3% or $26.0/MT to $2026.5/MT.
In the Asian session, at GMT0300, the pair is trading at 0.7427, with the AUD trading 0.09% higher against the USD from yesterday’s close.
The Reserve Bank of Australia’s (RBA) Governor, Philip Lowe, stated that he expects the economy to record good growth, the unemployment rate to come down gradually and inflation to reach the 2.5% target midpoint in 2020. Further, he reiterated that the board does not see a strong case for a near-term policy change.
Elsewhere in China, Australia’s largest trading partner, trade surplus narrowed more than expectations to $28.1 in July, compared to a revised surplus of $41.5 billion in the prior month. Market participants had envisaged the surplus to narrow to $39.1 billion
The pair is expected to find support at 0.7397, and a fall through could take it to the next support level of 0.7366. The pair is expected to find its first resistance at 0.7449, and a rise through could take it to the next resistance level of 0.7470.
The currency pair is showing convergence with its 20 Hr moving average and trading above its 50 Hr moving average.
AUD/USD Daily Outlook
Daily Pivots: (S1) 0.7386; (P) 0.7413; (R1) 0.7446; More...
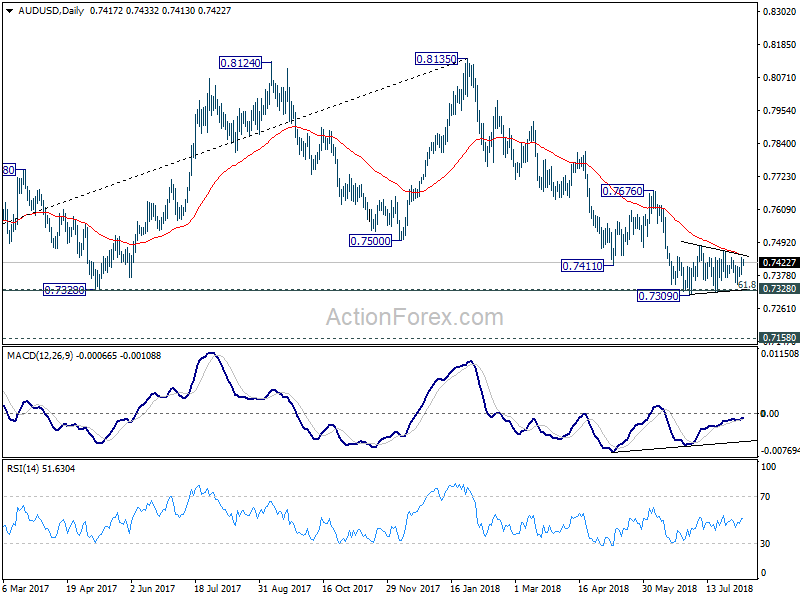
Intraday bias in AUD/USD remains neutral at this point as the consolidation from 0.7309 is extending. More sideway trading could be seen. On the downside, break of 0.7309 and sustained trading below 0.7328 cluster support (61.8% retracement of 0.6826 to 0.8135 at 0.7326) will extend the fall from 0.8135 to 0.7158 support next. On the upside, above 0.7483 resistance will bring stronger rebound. But upside should be limited below 0.7676 resistance to bring larger fall resumption eventually.
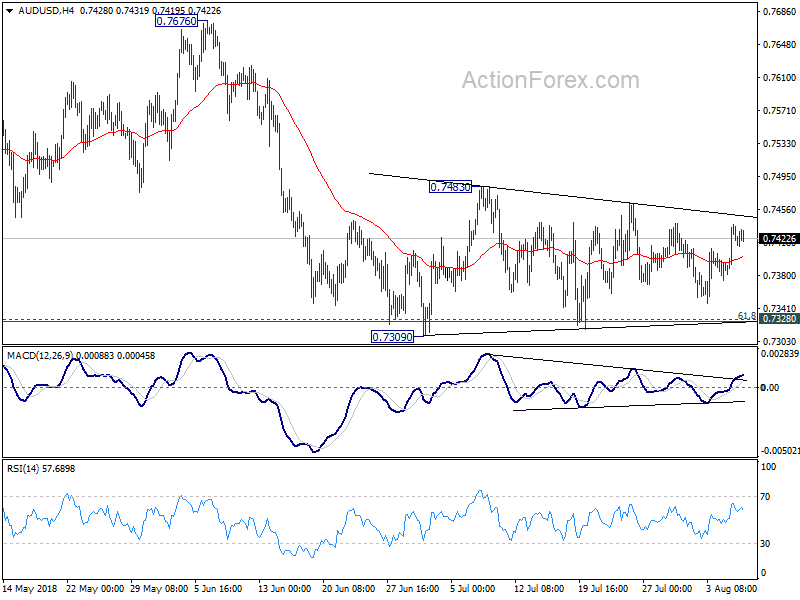
In the bigger picture, medium term rebound from 0.6826 is seen as a corrective move that should be completed at 0.8135. Deeper decline would be seen back to retest 0.6826 low. This will now remain the favored case as long as 0.7676 resistance holds.
Gold: Yellow Metal Trading On A Stronger Footing In The Asian Session
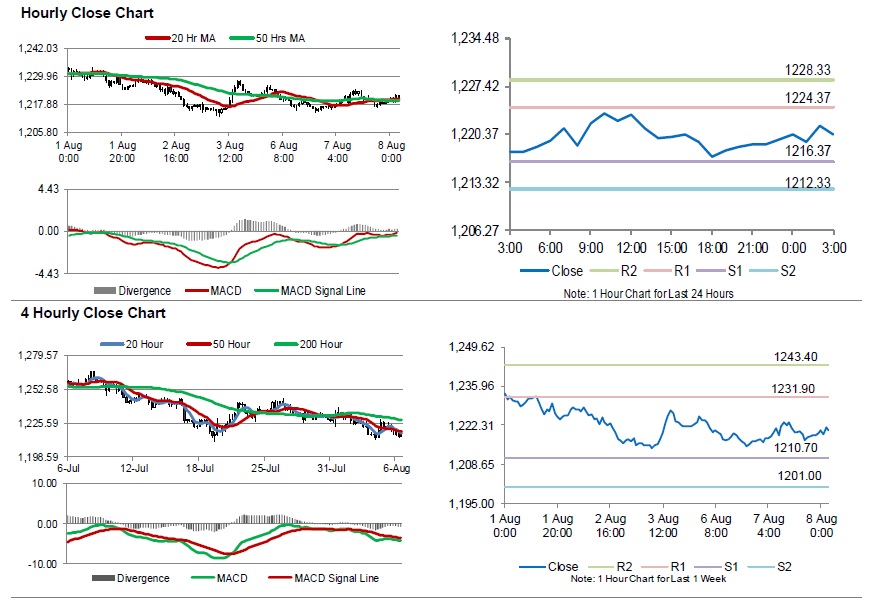
For the 24 hours to 23:00 GMT, Gold rose 0.17% against the USD and closed at USD1218.80 per ounce.
In the Asian session, at GMT0300, the pair is trading at 1220.40, with gold trading 0.13% higher against the USD from yesterday’s close.
The pair is expected to find support at 1216.37, and a fall through could take it to the next support level of 1212.33. The pair is expected to find its first resistance at 1224.37, and a rise through could take it to the next resistance level of 1228.33.
The yellow metal is showing convergence with its 20 Hr and 50 Hr moving averages.
Silver: White Metal Extends Its Gains In The Morning Session
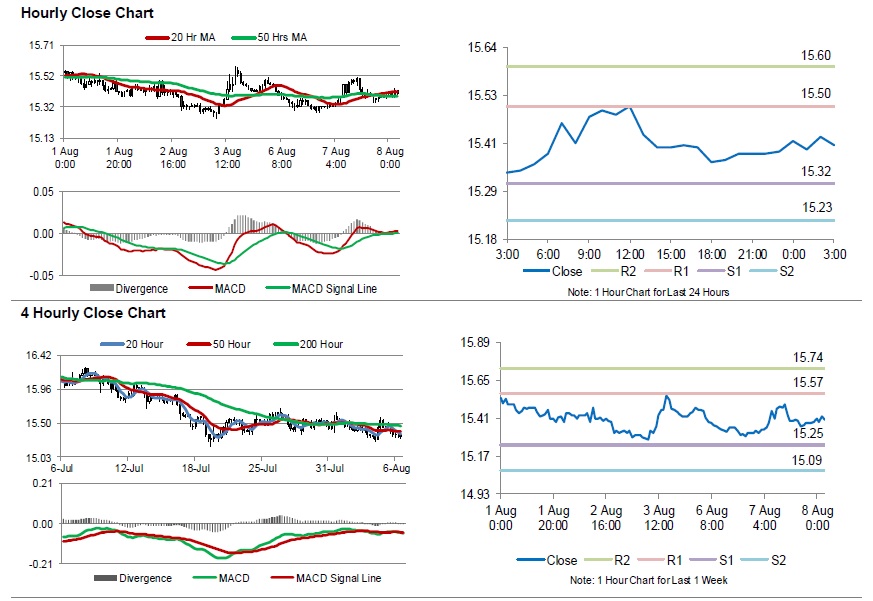
For the 24 hours to 23:00 GMT, Silver rose 0.42% against the USD and closed at USD15.39 per ounce.
In the Asian session, at GMT0300, the pair is trading at 15.41, with silver trading 0.10% higher against the USD from yesterday’s close.
The pair is expected to find support at 15.31, and a fall through could take it to the next support level of 15.22. The pair is expected to find its first resistance at 15.50, and a rise through could take it to the next resistance level of 15.59.
The white metal is showing convergence with its 20 Hr moving average and trading above its 50 Hr moving average.
USD/JPY Daily Outlook
Daily Pivots: (S1) 111.09; (P) 111.28; (R1) 111.58; More...
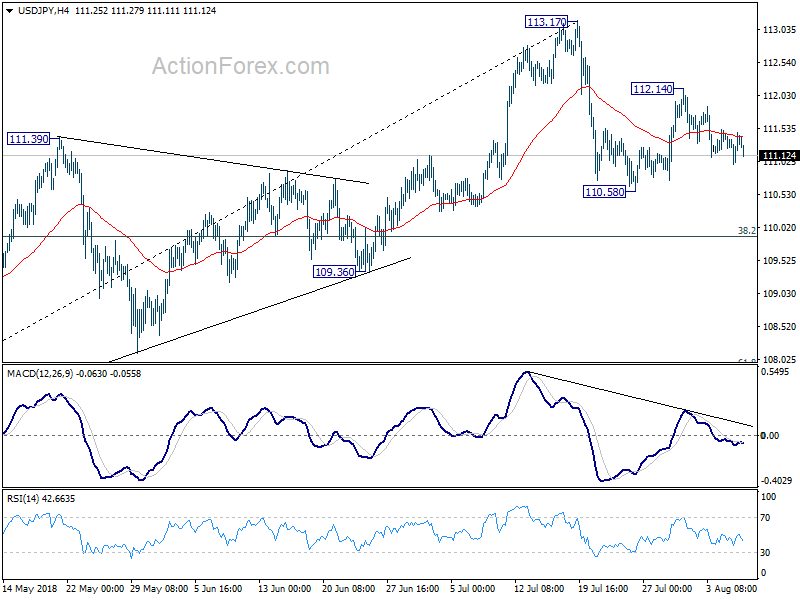
Intraday bias in USD/JPY is staying neutral for the moment. The corrective decline from 113.17 could extend lower through 110.58. But in that case, we'd expect strong support from 38.2% retracement of 104.62 to 113.17 at 109.90 to bring rebound. On the upside, above 112.14 will target a test on 113.17 high.
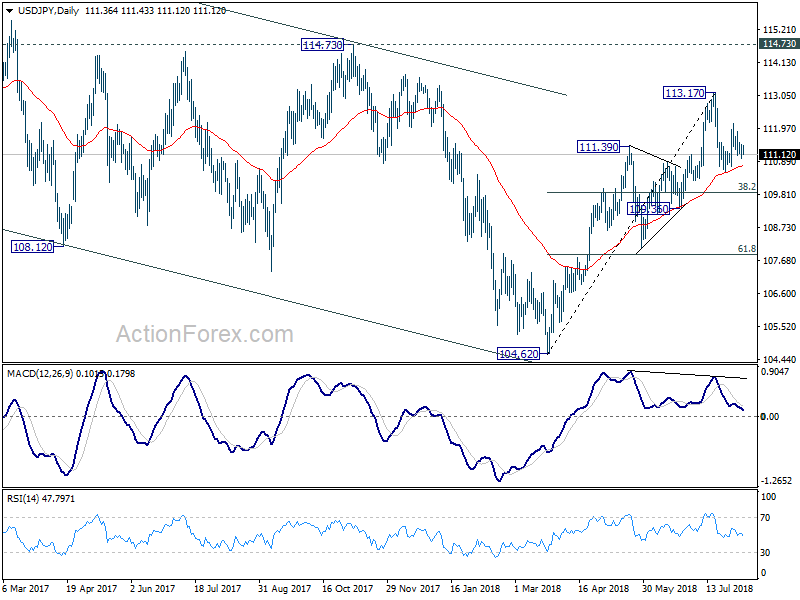
In the bigger picture, corrective fall from 118.65 (2016 high) should have completed with three waves down to 104.62. Decisive break of 114.73 resistance will likely resume whole rally from 98.97 (2016 low) to 100% projection of 98.97 to 118.65 from 104.62 at 124.30, which is reasonably close to 125.85 (2015 high). This will stay as the preferred case as long as 109.36 support holds.
Crude Oil: Oil Trading Higher, Ahead Of EIA’s Weekly Crude Oil Stockpiles Data
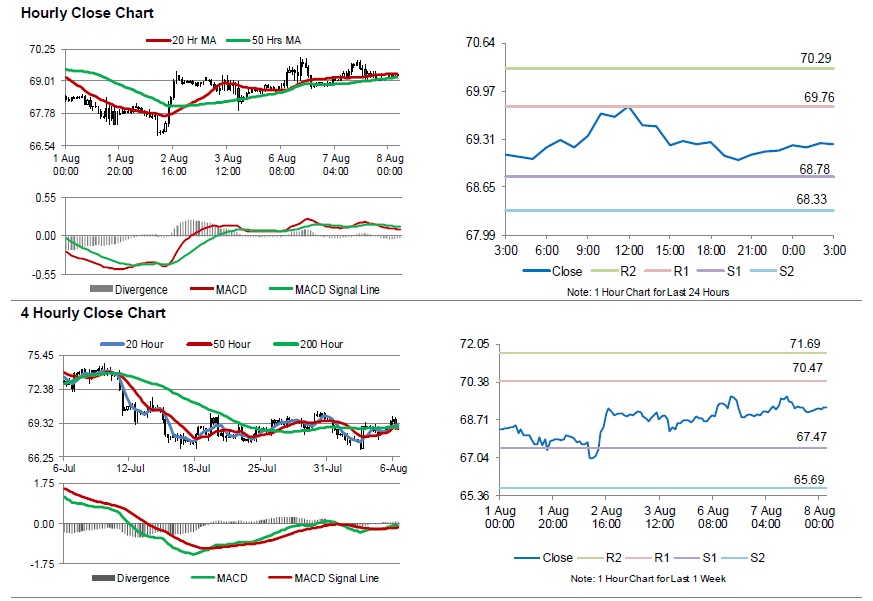
For the 24 hours to 23:00 GMT, Crude Oil rose 0.38% against the USD and closed at USD69.16 per barrel, after US re-imposed sanctions against Iran. The US Energy Information Administration lowered its 2019 forecast on the US crude-oil production to 11.7 million barrels per day from 11.8 million barrels per day issued in July. Further, the EIA expects 2018 output at 10.70 million barrels per day, down from 10.79 million barrels projected last month.
In the Asian session, at GMT0300, the pair is trading at 69.24, with oil trading 0.12% higher against the USD from yesterday's close, after the American Petroleum Institute (API) reported a major drop in US crude oil inventories of 6.0 million barrels to 407.2 million barrels in the week ended 03 August.
The pair is expected to find support at 68.78, and a fall through could take it to the next support level of 68.33. The pair is expected to find its first resistance at 69.76, and a rise through could take it to the next resistance level of 70.29.
Crude oil is showing convergence with its 20 Hr and 50 Hr moving averages.
USD/CHF Daily Outlook
Daily Pivots: (S1) 0.9931; (P) 0.9954; (R1) 0.9979; More...
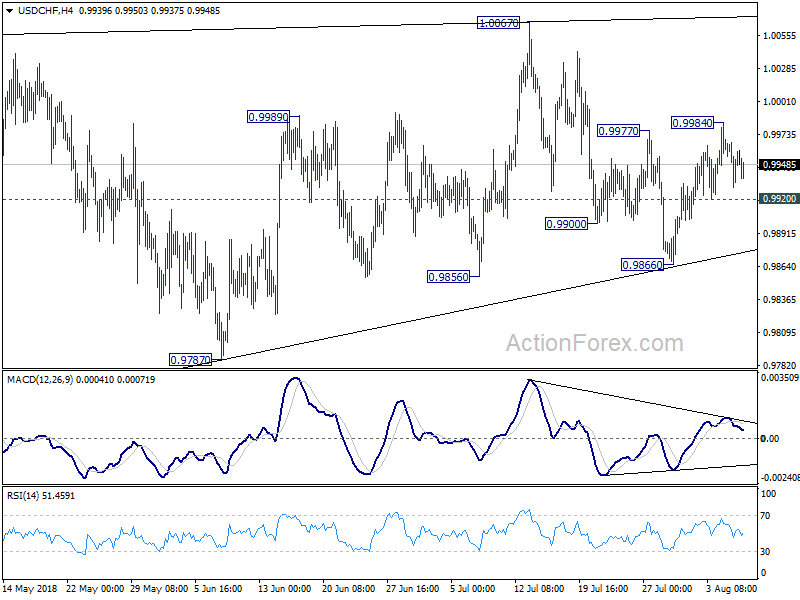
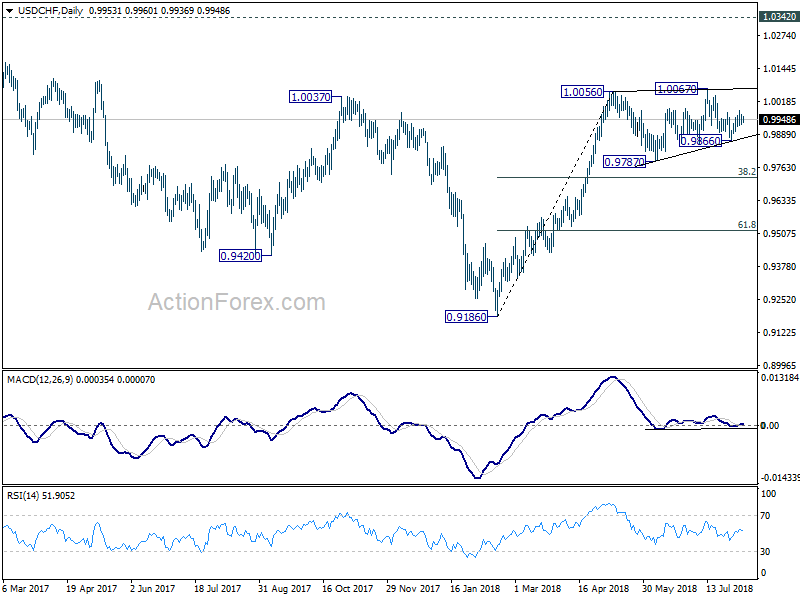
Intraday bias in USD/CHF remains neutral at this point. With 0.9920 minor support intact, further rise is mildly in favor. Above 0.9984 will target a test on 1.0067 key resistance next. On the downside, break of 0.9920 minor support will turn bias to the downside, to bring another decline to extend the consolidation pattern from 1.0056.
In the bigger picture, current development suggests that the consolidation pattern from 1.0056 is extending with another leg. As long as 38.2% retracement of 0.9186 to 1.0056 at 0.9724 holds, we'd expect rise from 0.9186 to resume at a later stage to retest 1.0342 key resistance (2016 high). However, sustained break of 0.9724 fibonacci level will bring deeper fall, as another declining leg in the long term range pattern.
EUR/USD H8 Chart Is Showing A Possible Retracement
The EUR/USD is in a downtrend but the pair has been ranging last few days. At this point we see a possible retracement to 1.1615-40, close to historical sellers. A rejection from the POC zone should target 1.1516. However a bounce from 1.1670 should make a bullish u-turn towards 1.1700 and 1.1750.
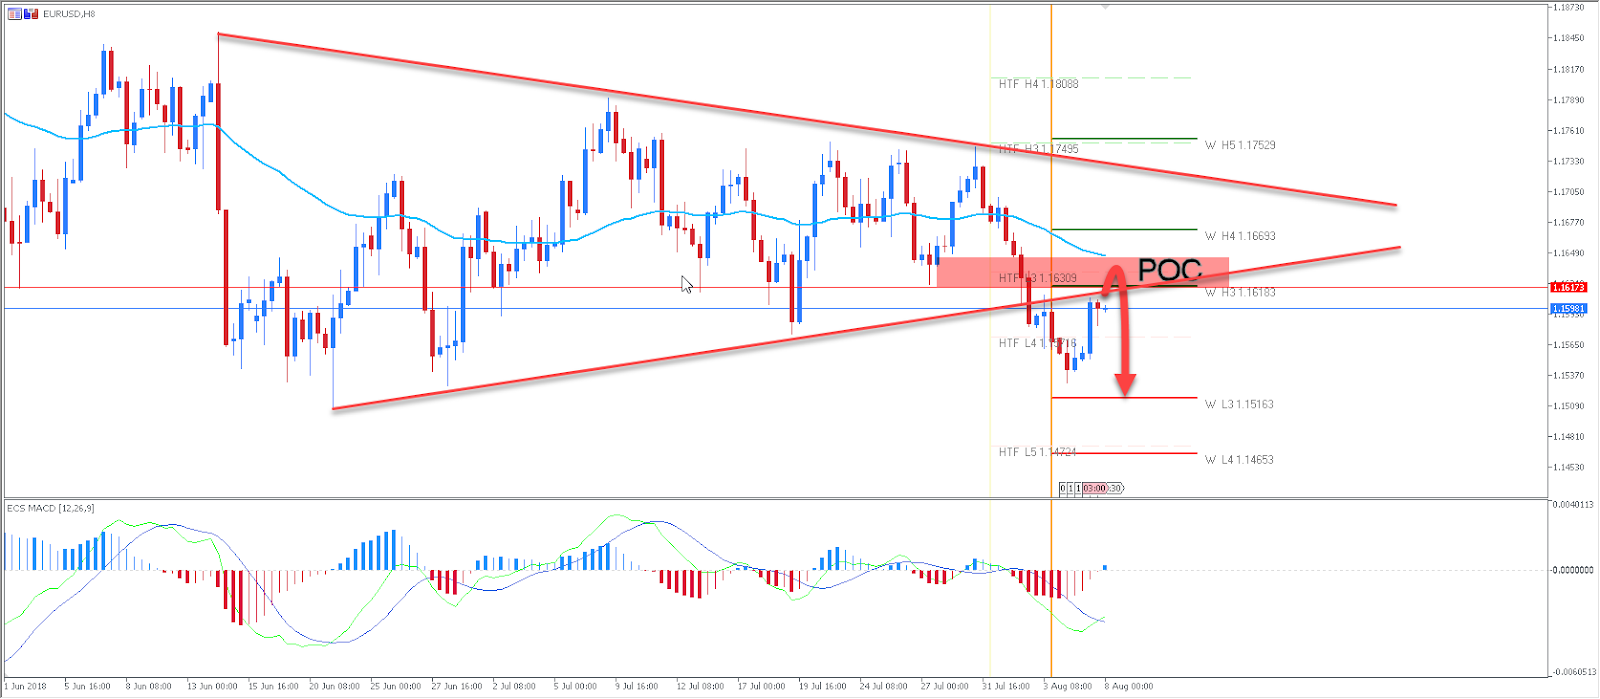
W L3 - Weekly Camarilla Pivot (Weekly Interim Support)
W H3 - Weekly Camarilla Pivot (Weekly Interim Resistance)
W H4 - Weekly Camarilla Pivot (Strong Weekly Resistance)
D H4 - Daily Camarilla Pivot (Very Strong Daily Resistance)
D L3 – Daily Camarilla Pivot (Daily Support)
D L4 – Daily H4 Camarilla (Very Strong Daily Support)
POC - Point Of Confluence (The zone where we expect price to react aka entry zone) 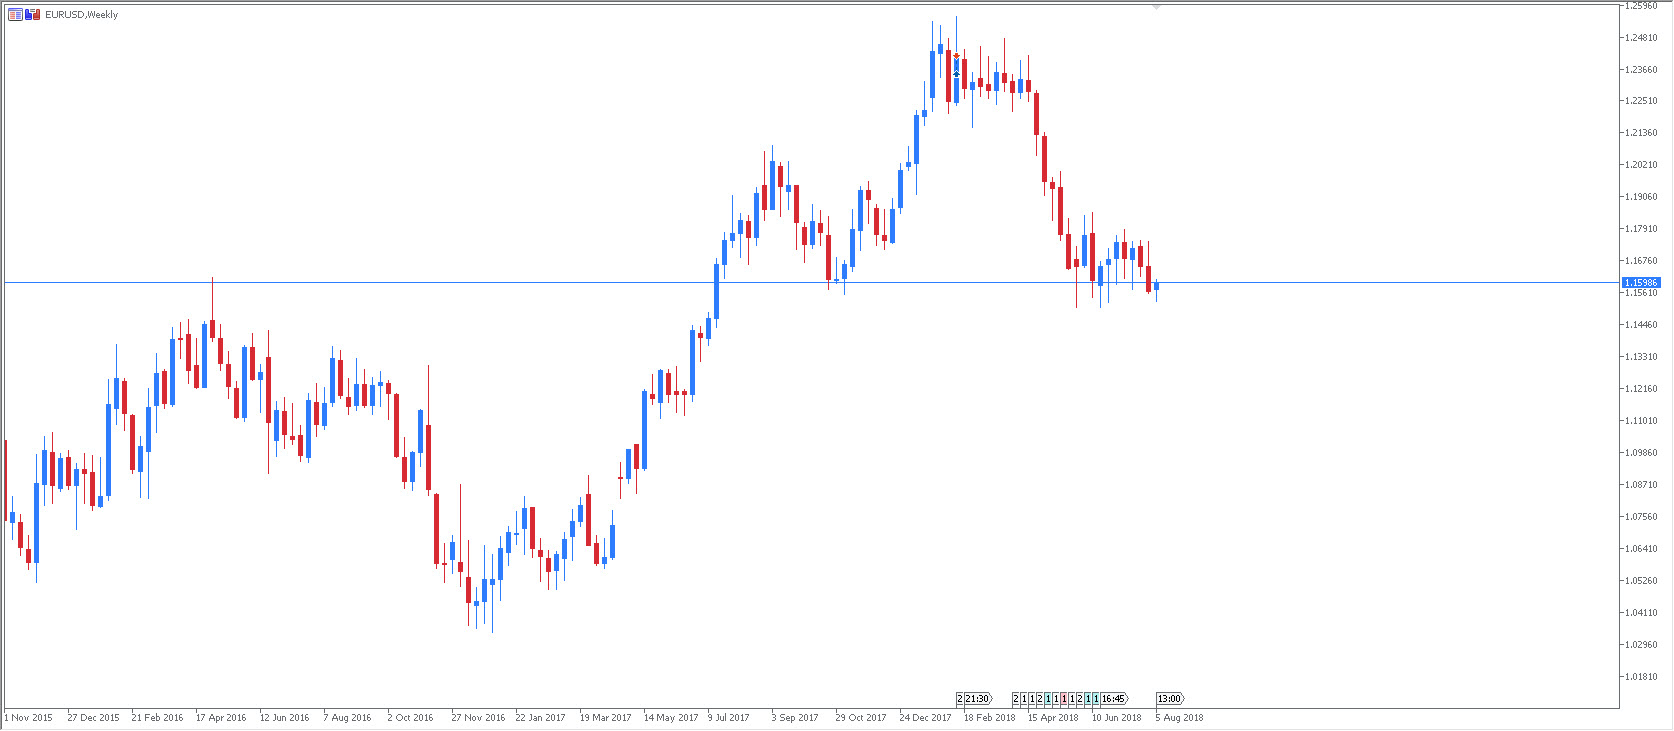
GBP/USD Daily Outlook
Daily Pivots: (S1) 1.2917; (P) 1.2945; (R1) 1.2968; More...
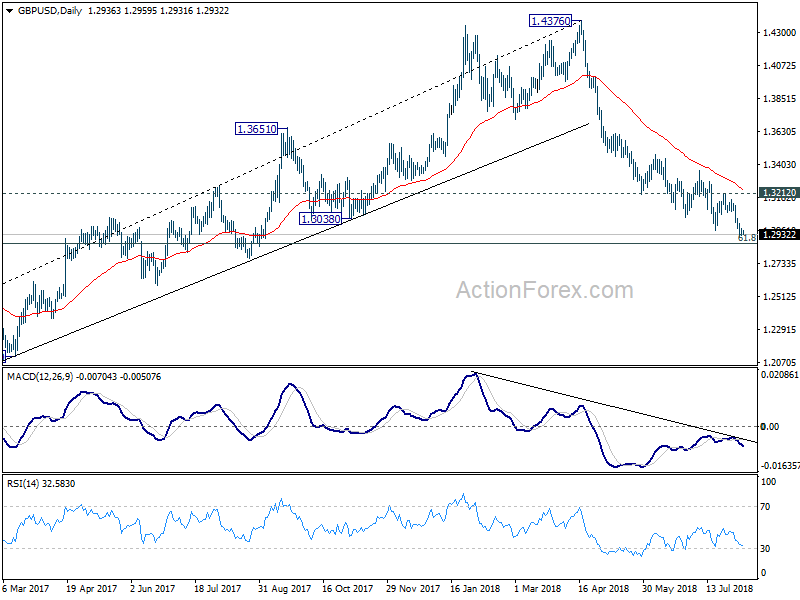
Despite diminishing downside momentum as seen in 4 hour MACD, intraday bias in GBP/USD remains on the downside with 1.2998 minor resistance intact. Current down trend from 1.4376 should target 1.2874 fibonacci level next. On the upside, above 1.2998 minor resistance will bring strong recovery. But upside should be limited below 1.3212 resistance to bring fall resumption.
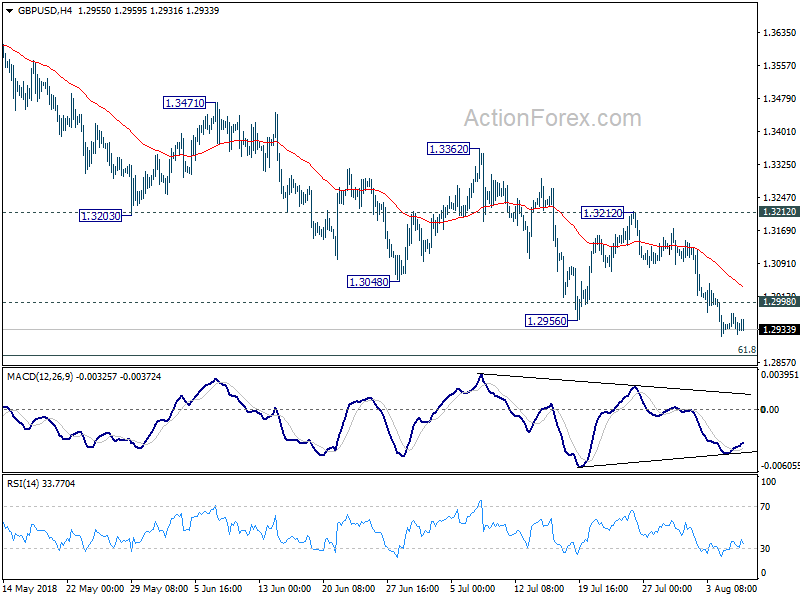
In the bigger picture, whole medium term rebound from 1.1946 (2016 low) should have completed at 1.4376 already, after rejection from 55 month EMA (now at 1.4141). Fall from 1.4376 should extend to 61.8% retracement of 1.1946 (2016 low) to 1.4376 at 1.2874 next. Decisive break of 1.2874 will raise the chance of long term down trend resumption through 1.1946 low. On the upside, break of 1.3212 resistance is needed to be the first indication of medium term bottoming. Otherwise, outlook will remain bearish even in case of strong rebound.