Sample Category Title
Market Morning Briefing: Pound Is Seeing Muted Movement Near 1.294-1.298
STOCKS
Dow (25628.91, +0.50%) has moved up as expected and could soon rise towards 25750 in the next couple of sessions. The resistance on the 3-day and weekly candle charts has finally broken on the upside and is indicative of further bullishness in the medium term.
Dax (12648.19, +0.40%) moved back to levels above 12600 yesterday contrary to our expectation of testing 12400 on the downside. There is room on both sides towards 13000 and 12400-12200 but while the Dow rises, Dax could also move up in the near term. While above 12600, we could negate immediate bearishness towards 12400-12200.
Nikkei (22750.48, +0.39%) has risen sharply and could test resistance above 22800 on the daily candles. A fall from there would keep the index ranged for some more time or push it sharply to fall below 22400 in the medium term. We watch price action above current levels for directional clarity in the coming weeks.
Shanghai (2772.32, -0.25%) rose up to test 2800 yesterday but is trading low just now. Overall near term trade is likely to be seen in the 2800-2700 region with little preference of a fall towards 2650.
Nifty (11389.45, +0.021%) came off from immediate resistance to close at lower levels. While the resistance zone of 11400-11500 does not produce a sharp rejection, the index could continue to trade within 11300-11500 region for a few more sessions. Clear resistance is visible on the weekly line charts and suggest a corrective dip from here in the near to medium term.
COMMODITIES
Brent (74.59) and WTI (69.23) have risen slightly. WTI tested 70 for 2-consecutive sessions but came off sharply to close at lower levels. If 70 holds just now, we may see another dip towards 68 by the end of this week. Brent looks bullish towards 76 but if the WTI falls, upside for Brent could be limited in the near term.
Gold (1220.50) has been trading along the medium term resistance line on the daily candles and while that holds, Gold could come off towards 1210 or even lower in the next 2-3 sessions. Trade is likely to remain ranged just now with a maximum downside target of 1200 in the medium term.
Copper (2.7620) is holding within the 2.80-2.70 region just now. A rise towards 2.80 is possible by end of this week. Overall view remains ranged.
FOREX
Euro (1.1603): Against our expectation, Euro bounced from support near 1.153 yesterday, back towards 1.16. It could climb higher towards 1.167 today (13 weeks MA could provide resistance near 1.167). If it comes off from 1.165-1.167, we could still look for a break below 1.153-1.151 in the next few sessions. However, a breach above 1.167 would lead to a test of resistance near 1.17.
Dollar Index (95.15): Dollar Index dipped yesterday after having seen a high near 95.52 on Monday. It has support at 94.8 (21 days MA) and 94.5 (trendline support). A test of 94.8 would correspond to Euro testing 1.165-1.167 while a test of 94.5 would correspond to Euro testing 1.17. While it stays above 94.8-94.5, the preference is for another upmove towards 95.5 and then towards 96 in the next 1 week.
Dollar Yen (111.37): Support near 111 on daily candles continues to hold for Dollar Yen. While above 110.59, the preference is for Dollar Yen to see another leg of upmove towards 113 and beyond.
Euro Yen (129.24): Euro Yen moved up yesterday from levels near 128.60 towards 129.20-30 due to the Euro’s rise. Maybe Euro Yen could move up to test the 13 and 21 days MA near 129.60-130.20 in the next 1-2 sessions and then again resume its downmove towards support near 127.5 on daily line chart by next week.
Pound (1.2937): Pound is seeing muted movement near 1.294-1.298. However, having broken below crucial long term support on weekly candles near 1.3050, the trend is bearish and a test of support on daily candles near 1.290-1.288 could happen this week.
Dollar Rupee (68.6875): In the near term, maybe we see a dip towards 68.60-50 in Dollar-Rupee over today-tomorrow.
INTEREST RATES
The US 10 year bond yield had tested the psychologically important 3% level last week and came off from there towards 2.93% - possibly due to a rise in the trade war rhetoric. The ongoing US Treasury auctions have again raised the yield closer to 3%. If today’s 10 year bond auction (of $26 bn) and the 30 year bond auction (of $18 bn) later in the week dont get adequate demand, the 10 year yield might rise to 3% again in the next 1-2 sessions.
In the weeks ahead, if it moves below 2.9% again, there is crucial support near 2.82-85%, which it was not able to break below in Jun-Jul ’18. Note that the US-China trade war rhetoric is only expected to intensify in the weeks ahead – this could lead to a ‘risk off’ sentiment amongst investors, taking the 10 year yield towards 2.8%.
US 10 year yield (2.97%), 30 Year (3.11%), 5 Year (2.84%), 2 Year (2.67%)
Following resistance levels are of crucial importance for Japanese yields. A breach above these levels by Japanese yields could trigger the US 10 year to breach 3%.
The Japanese 10 year yield (0.11%) : resistance @ 0.129% (previous high)
The Japanese 30 year yield (0.85%) : resistance @ 0.85% (long term resistance on medium term chart)
USD/CHF Likely To Correct Lower Towards 0.9900
Key Highlights
- The US Dollar failed to move above the 0.9980 resistance and declined against the Swiss Franc.
- There is a key bearish trend line forming with resistance at 0.9965 on the 4-hours chart of USD/CHF.
- The Swiss Foreign Currency Reserve increased to 750B from 749B in June 2018.
- Spain’s Industrial Output for June 2018 will be released today, which is forecasted to increase 1.0% (YoY).
USDCHF Technical Analysis
The US Dollar traded with bullish moves above the 0.9950 level this past week against the Swiss Franc. However, the USD/CHF pair struggled to clear the 0.9980-0.9985 resistance and later declined.
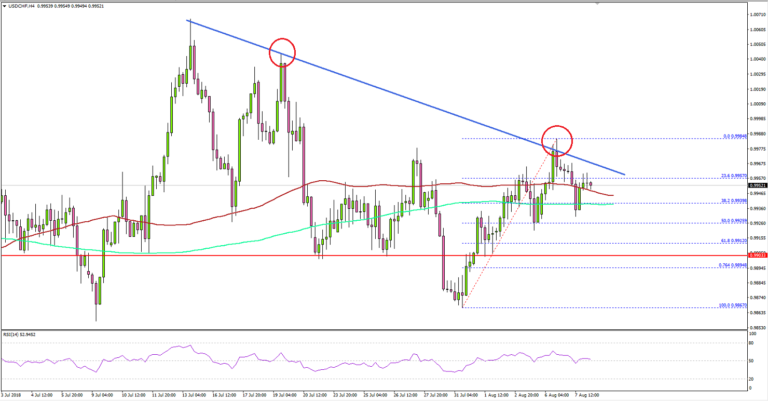
Looking at the 4-hours chart, the pair traded below the 0.9960 support and the 23.6% Fib retracement level of the last wave from the 0.9867 low to 0.9984 high.
It seems like the pair is struggling to hold gains and it could continue to move down towards the 0.9900 support. An intermediate support is the 50% Fib retracement level of the last wave from the 0.9867 low to 0.9984 high at 0.9925.
On the flip side, if the pair moves higher and breaks the trend line resistance at 0.9965, it may well gain bullish momentum. In this case, the pair could rise towards the 0.9980 and 1.0000 resistance levels.
Overall, the current bias is short-term bearish as long as USD/CHF is below 0.9965 and 0.9980. Looking at the other major pairs, EUR/USD bounced back sharply after trading to a new yearly low below 1.1540.
GBP/USD is holding the 1.2900-20 support zone, but it remains at a risk of more declines in the near term.
RBA Lowe reiterated next move is up not down
RBA Governor Philip Lowe delivered a speech titled "Demographic Change and Recent Monetary Policy" today. There he reiterated that "the next move in interest rates to be up, not down". But the timing will depends upon the "speed of the progress" in "reducing the unemployment rate and having inflation return to around the midpoint of the target range on a sustained basis." And in the Q&A, Low also noted that there is no strong case for a near term move.
On the economy, Lowe's comments were similar to those in yesterday's RBA statement. That is, GDP is expected to average a bit above 3% in 2018 and 2019. Unemployment rate is expected to drop over time to 5% at some point over the next few years. And Australia could "go lower than this on a sustained basis". Due to once-off factors, inflation could slow to 1.75% in 2018. But over the forecast period, inflation is projected to rise to 2.5% in 2020.
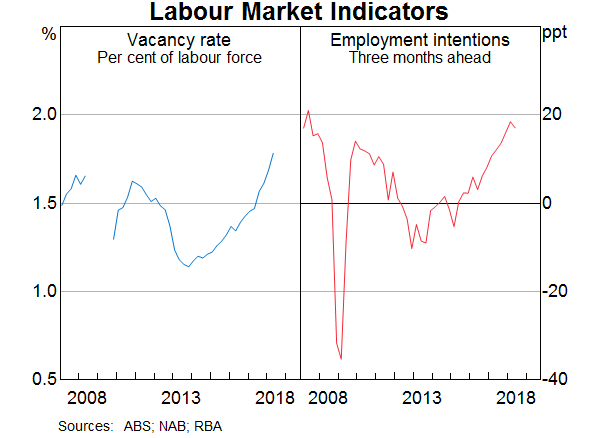
Lowe also pointed to steady increased in job vacancies with vacancy rate hitting highest level in many years. And, there was an increased in number of businesses reporting hiring difficulties. The tightening of labor market will lead to higher wages as a "more general story".
On financial market risks, Lowe noted that borrowing by investors has "slowed considerably" because of "reduced demand" and "tightening of credit standards". And the change in financial trends has helped reduce the build-up of risk."
USDJPY – Still Retains Upside Pressure
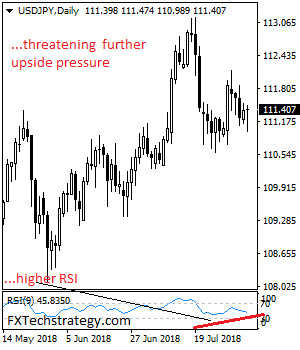
USDJPY - The pair remains biased to the upside as it looks for more strength. On the downside, support lies at the 111.00 level where a break if seen will aim at the 110.50 level. A cut through here will turn focus to the 110.00 level and possibly lower towards the 109.50 level. On the upside, resistance resides at the 112.00 level. Further out, we envisage a possible move towards the 112.50 level. Further out, resistance resides at the 113.00 level with a turn above here aiming at the 113.50 level. On the whole, USDJPY faces further upside pressure.
BoJ: Allowing long-term yields to rise may contribute to sluggish prices
BoJ released the Summary of Opinions at the July 30/31 monetary policy meeting today. There BoJ added forward guidance to " maintain the current extremely low levels of short- and long-term interest rates for an extended period of time". Also, BoJ is allowing 10 year JGB yield to move between -0.1% and +0.1%, as Governor Haruhiko Kuroda noted in the press conference.
The summary of opinions noted that it's "extremely important" to introducing forward guidance as a new measure. And, that would strengthen its commitment to achieving the price stability target, in order to ensure public confidence in its strong stance toward achieving the target."
Also, the summary noted that "controlling the long-term yields in a flexible manner is likely to contribute to maintaining and improving market functioning." Rise in interest rates "is expected to be effective in alleviating the cumulative impact on the functioning of financial intermediation and enhancing the sustainability of the Bank's policy.
Additionally, "referring to the recent developments in long-term interest rates in major economies, it can be considered appropriate for interest rate control in Japan to allow the yields to move upward and downward by around 0.25 percent." Though, most member agreed that it should be "made clear at the press conference" that currently yield may move between -0.1% to 0.1%.
However, the summary also noted concerns that " when medium- to long-term inflation expectations are weak, making policy adjustments that could allow the long-term yields to rise may lead to an increase in real interest rates and thereby contribute to sluggish prices."
USTR: 25% tariffs on $16B of Chinese goods to start on Aug 23
The US Trade Representative announced to start to collect 25% tariffs on USD 16B of Chinese imports starting August 23. The announced lists contains 279 of the original 284 tariff lines that were proposed back on June 15. This is the second tranche of tariffs as part of the Section 301 intellectual property investigations. The first tranche of 25% tariffs on USD 34B of Chinese goods already took effect on July 6. The upcoming 25% tariffs on USD 200B in Chinese goods are work in progress.
In the statement, USTR reiterated China's bad practices as revealed by Section 301 investigation. The practices include:
- China uses joint venture requirements, foreign investment restrictions, and administrative review and licensing processes to require or pressure technology transfer from U.S. companies.
- China deprives U.S. companies of the ability to set market-based terms in licensing and other technology-related negotiations.
- China directs and unfairly facilitates the systematic investment in, and acquisition of, U.S. companies and assets to generate large-scale technology transfer.
- China conducts and supports cyber intrusions into U.S. commercial computer networks to gain unauthorized access to commercially valuable business information.
Eco Data 8/8/18
[php_everywhere instance="1"]
GBPAUD Bearish and Oversold at 2-Month Low
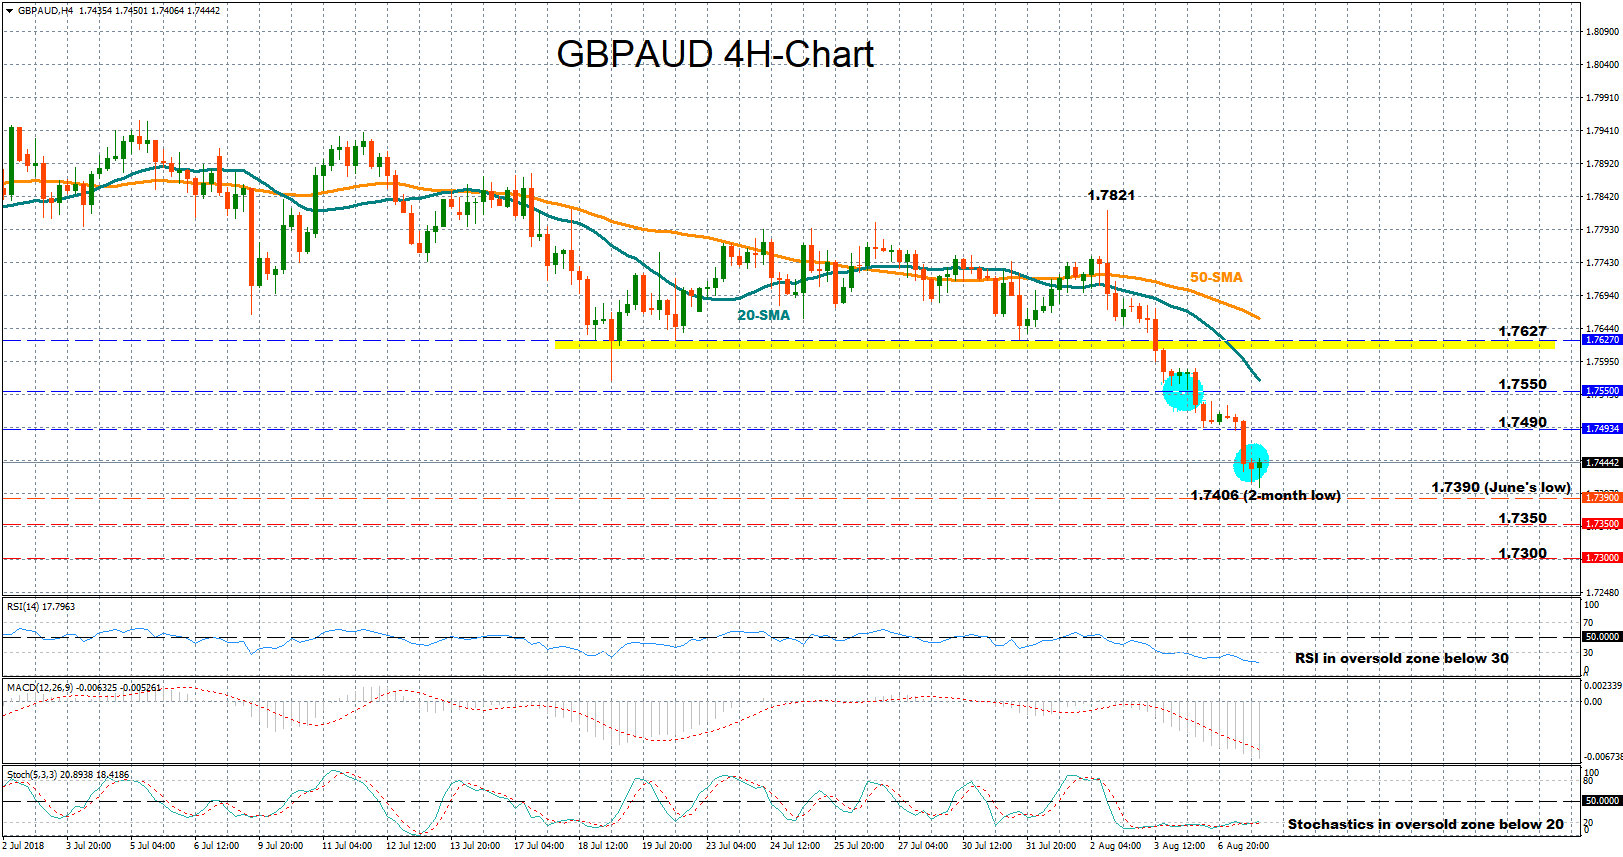
GBPAUD turned increasingly bearish after breaking support around 1.7627 on Friday in the four-hour chart, diving to a two-month low of 1.7406 on Tuesday. While the MACD signals that negative momentum could persist in the short-term, with the index increasing strength to the downside in negative territory and below its red signal line, the RSI and the Stochastics suggest that chances for a rebound are high as both indicators fluctuate in oversold territory; the former below 30 and the latter under 20.
An extension lower could revisit June’s low of 1.7390, where a successful close below that level would resume the downward move started at the end of April and at the same time strengthen bearish action to probably drive the pair towards 1.7350. Even lower, the focus could turn to the 1.7300 psychological level.
Alternatively, if the recent downside is indeed overstretched, a reversal to the upside could meet resistance first at 1.7490 and then at 1.7550 where bears got a rest over the past two days. Only a cross above 1.7627, however, could remove bearish sentiment and turn GBPAUD back to neutrality.
8 Forex Terms: How Professional Forex Traders Speak
Very often, traders and professional Forex investors simplify currency pair names by referring to them using nicknames. The most used jargon in FX is about the major currency pairs. This language is not only used in forums or social media but also in official communications, news, and formal events.
If you are trading FX, you have got to know about the Fiber. This is, by far, the most traded FX pair in the world: the EUR/USD. The “Fiber” nickname has two meanings: on one side, it stands as a deviation from the fact that the GBP/USD is called Cable, the Euro being a newer currency. On the other side, because it said that Europe has the fastest optical fiber network worldwide.
Trading the GBP against the US Dollar must imply that one knows what Cable is. This is the most widely used nickname in the Forex market since its launch. The name comes as a mixture between the steel cables found beneath the Atlantic Ocean; build in 1858 to connect the two major economies in the world (back then): US and UK, to enable telegraphic messages about currency prices to be transmitted between the New York and London exchanges.
When you trade the AUD/USD currency pair, you are actually exchanging the Australian Dollar against the United States Dollar or the other way around. This pair is also known as the Aussie or Ozzie, although the most commonly used is the Aussie, the second being just a variation – difference in pronunciation between the US and UK English.
NZD/USD. This pair is known as the Kiwi. Not a hard one to remember, as New Zeeland is commonly named the Kiwi in official communications.
You will often read or hear about Loonie, especially in the US markets hours. Coming from the name of the bird on the Canadian currency, this pair is the nickname of the USD/CAD currency pair.
Between the United States dollar resonance and the Swiss currency, traders choose to use the name Swissy. So from now on, when you stumble upon this word you will know that it is about USD/CHF cross. Swissy was definitely very common in the first part of 2015 when the Swiss Franc rose against the US Dollar by approximately 2500 pips in one hour’ that is 26 times more than the average volatility for a day in the Swissy.
EUR/GBP. This is the cross formed by the European currency (Euro – EUR) and the Great Britain’s currency (British Pound Sterling – GBP). The colloquial name for this pair is the Chunnel, coming from the Channel Tunnel that connects France and England, the Euro and the GBP zones.
If you are trading the Asian session, you have to know about Yen or Ninja. This obviously stands for the major currency pair USD/JPY. The explanation for “Yen” is not complicated, as it is the short version of the pair. As for the “Ninja” term, it is safe to say that it happened because ninja fighters are found in Japanese tradition.
Trading Forex is not about the names and nicknames but there is a lot of jargon in the trading world and if you want to understand the information you find on the internet about trading you must learn to speak the language of the professionals.
The 3 Core Principles to Improve Your Trading
Simplicity is best in just about anything, but as humans making things complex is what we do best. Forex trading is no different either. What could be simpler than buying low and selling high? Instead, what we have are tons of indicators, complex variables, all in an effort do the simple thing, buying low selling high. It is easy to get lost in the complexity that at times we miss the most obvious.
Here’s a thought: On trading forums, we often find traders writing and explaining their trading strategy. But, despite all the information they share, isn’t it strange that nearly half the traders or more who follow the strategy still end up losing money?
Some of the common reasons we find, that seems to justify why traders fail to make money with a strategy that is successful for one trader is because:
- The trading strategy no longer works because the markets have changed
- The trading strategy works only at a certain time and only for a certain instrument
The real reason is in fact:
- You haven’t spent much time analyzing the strategy
- You haven’t practiced the strategy enough
Sure, there can be instances where the trading strategy presented does indeed require more improvements, but broadly speaking, even the most successful strategies outline do not stick well with most traders.
So how can you, as a trader improve your trading, regardless of how simple or complex your strategy may be?
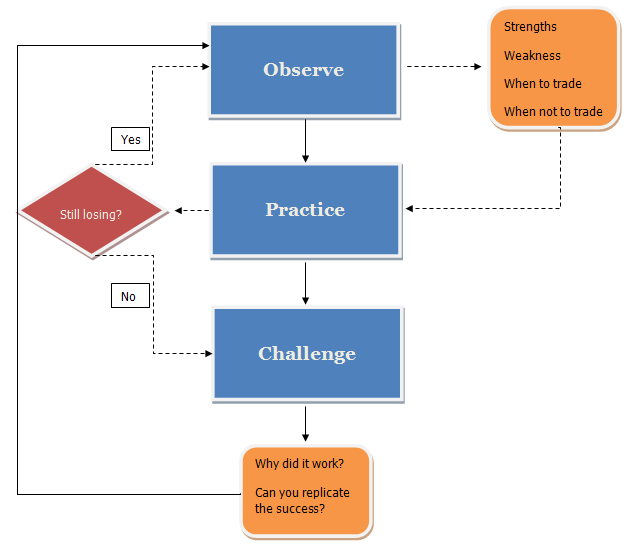
Observe
Observation is a great tool
You can tell a lot about what is happening in the markets by simply observing the markets. No trading, but just eyeballing the charts using the strategy rules and indicators. Observation can be a great tool but one that is seldom used. For a trader, the best place to start is to load their strategy templates and simply sit back and observe. Most importantly, looking at the price charts and taking notes on what price could do, based on your strategy rules can be a great way to look back to your notes and figure out what happened in the markets.
If moving average crossovers are your forte, then instead of trying to build an EA or scalping the markets, take a few days and simply watch the charts. You don’t need to sit in front of your charts all day long, but simply make notes on what you think the price will do. The minor details such as pull backs in the trend, the price targets, and invalidation levels can greatly help to improve your trading odds.
This seemingly boring job can actually do wonders for your trading. A conscious effort made to put this into practice will automatically tune your mind to watch for potential opportunities as well as warning signs when you are actually trading.
Practice
Practice makes you perfect
And this couldn’t be further from the truth in trading. By practice, we are not talking about a ‘demo trading account’ where you blindly buy and sell based on the strategy rules.
Practice is, in fact, the next step in your trading journey. Based on the information that you gathered by observing the charts and putting this knowledge into practice can help you to form a habit.
Practicing your trading strategy over and over again can be a great way to improve your trading skills. More importantly, this repetitive process will also help you to identify some minor yet important details that price can offer you. These minor details are what can be the differing variable between a winning and a losing trade.
Challenge yourself
Once you stop learning, you start dying
Or in the trading context, once you stop learning your strategy starts to fall apart.
So far, you have observed the markets, and you have started practicing. But that is not the end. The real game changer comes in this next part which is to challenge yourself. But how does one go about doing this?
There are many forums, websites, and resources nowadays with many traders/bloggers posting their own charts. The first step is to find a trader who uses the same strategy such as yours. It could be a simple moving average crossover or a Bollinger Band strategy. The point is, once you narrow down to a few traders who keep updating their charts and writing their analysis, you can then use these very charts, figure out how price action unfolded and then challenge yourself as to whether you would have taken that trade or if you would have done it differently.
Nowadays, most traders end up arguing on whose analysis is right. An argument doesn’t increase your trading capital at the end of the day. Learning does!
So instead of arguing with a trader, who thinks the price is going to move in their favor, take a step back, wait for the price to evolve, then look back at those charts and determine if the trader was right or wrong. If he was right, try to understand how the trade worked out. If he was wrong, figure out why he was wrong and if you could have done things differently.