Sample Category Title
The Analytical Overview Of The Main Currency Pairs
The EUR/USD currency pair
Technical indicators of the currency pair:
Prev Open: 1.15699
Open: 1.15233
% chg. over the last day: -0.03
Day's range: 1.15760 – 1.15805
52 wk range: 1.0571 – 1.2557
The technical pattern on the EUR/USD currency pair is ambiguous. During yesterday's trading session, quotes were in a sideways trend. Today, the currency pair has slightly increased, but there is no exact trend. Investors expect additional drivers. The key support and resistance levels are 1.15600 and 1.15900, respectively. We recommend opening positions from these marks. In the near future, the EUR/USD correction is not ruled out.
The news feed on 2018.08.07:
JOLTS job openings in the US at 17:00 (GMT+3:00).
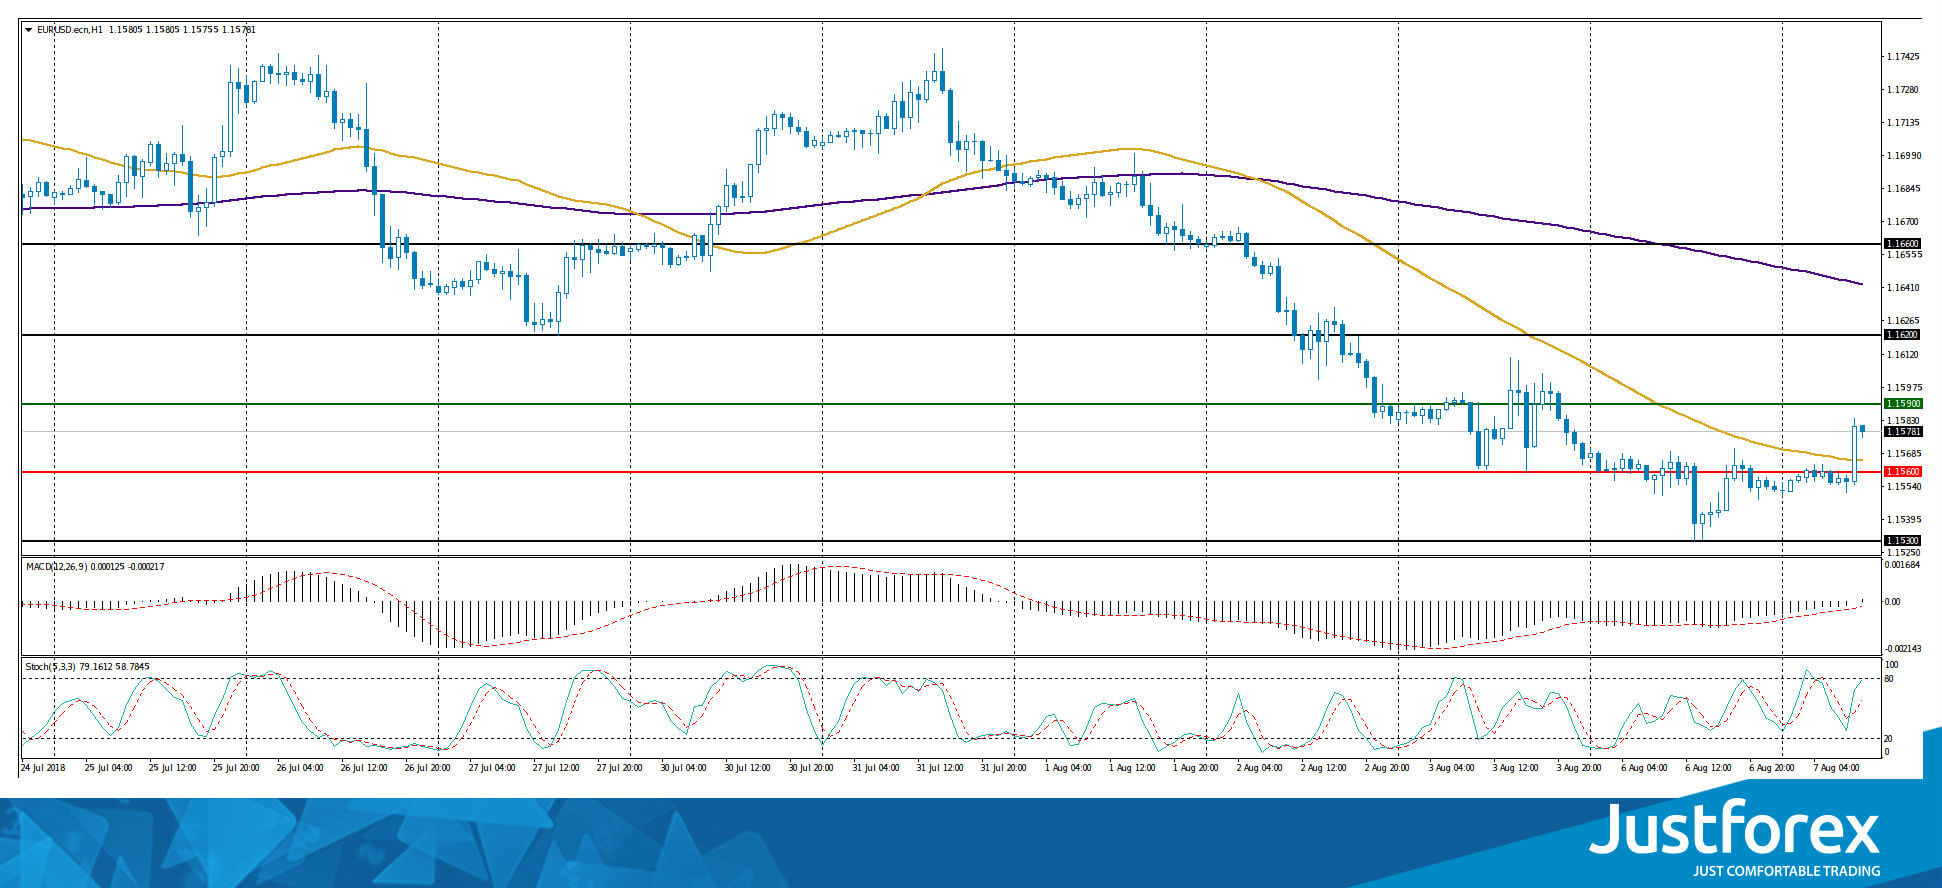
Indicators do not send accurate signals: the price has fixed between 50 MA and 200 MA.
The MACD histogram is located near the 0 mark.
Stochastic Oscillator is in the neutral zone, the %K line is above the %D line, which indicates the bullish sentiment.
Trading recommendations
Support levels: 1.15600, 1.15300
Resistance levels: 1.15900, 1.16200, 1.16600
If the price fixes below the support level of 1.15600, the EUR/USD quotes are expected to fall. The movement is tending to 1.15300-1.15000.
Alternative option. If the price fixes above the resistance level of 1.15900, it is necessary to consider purchases of EUR/USD. The movement is tending to 1.16200-1.16400.
The GBP/USD currency pair
Technical indicators of the currency pair:
Prev Open: 1.29952
Open: 1.29445
% chg. over the last day: -0.45
Day's range: 1.29614 – 1.29715
52 wk range: 1.2361 – 1.4345
During yesterday's trading session, the pound continued to lose ground against the US dollar. The British pound is significantly weakened after a Secretary of State for International Trade Liam Fox announced that the UK is likely to exit from the European Union without signing any agreements. At the moment, the GBP/USD quotes are moving in the range of 1.29400-1.29800. The positions should be opened from these marks.
The news feed on the UK economy is calm.
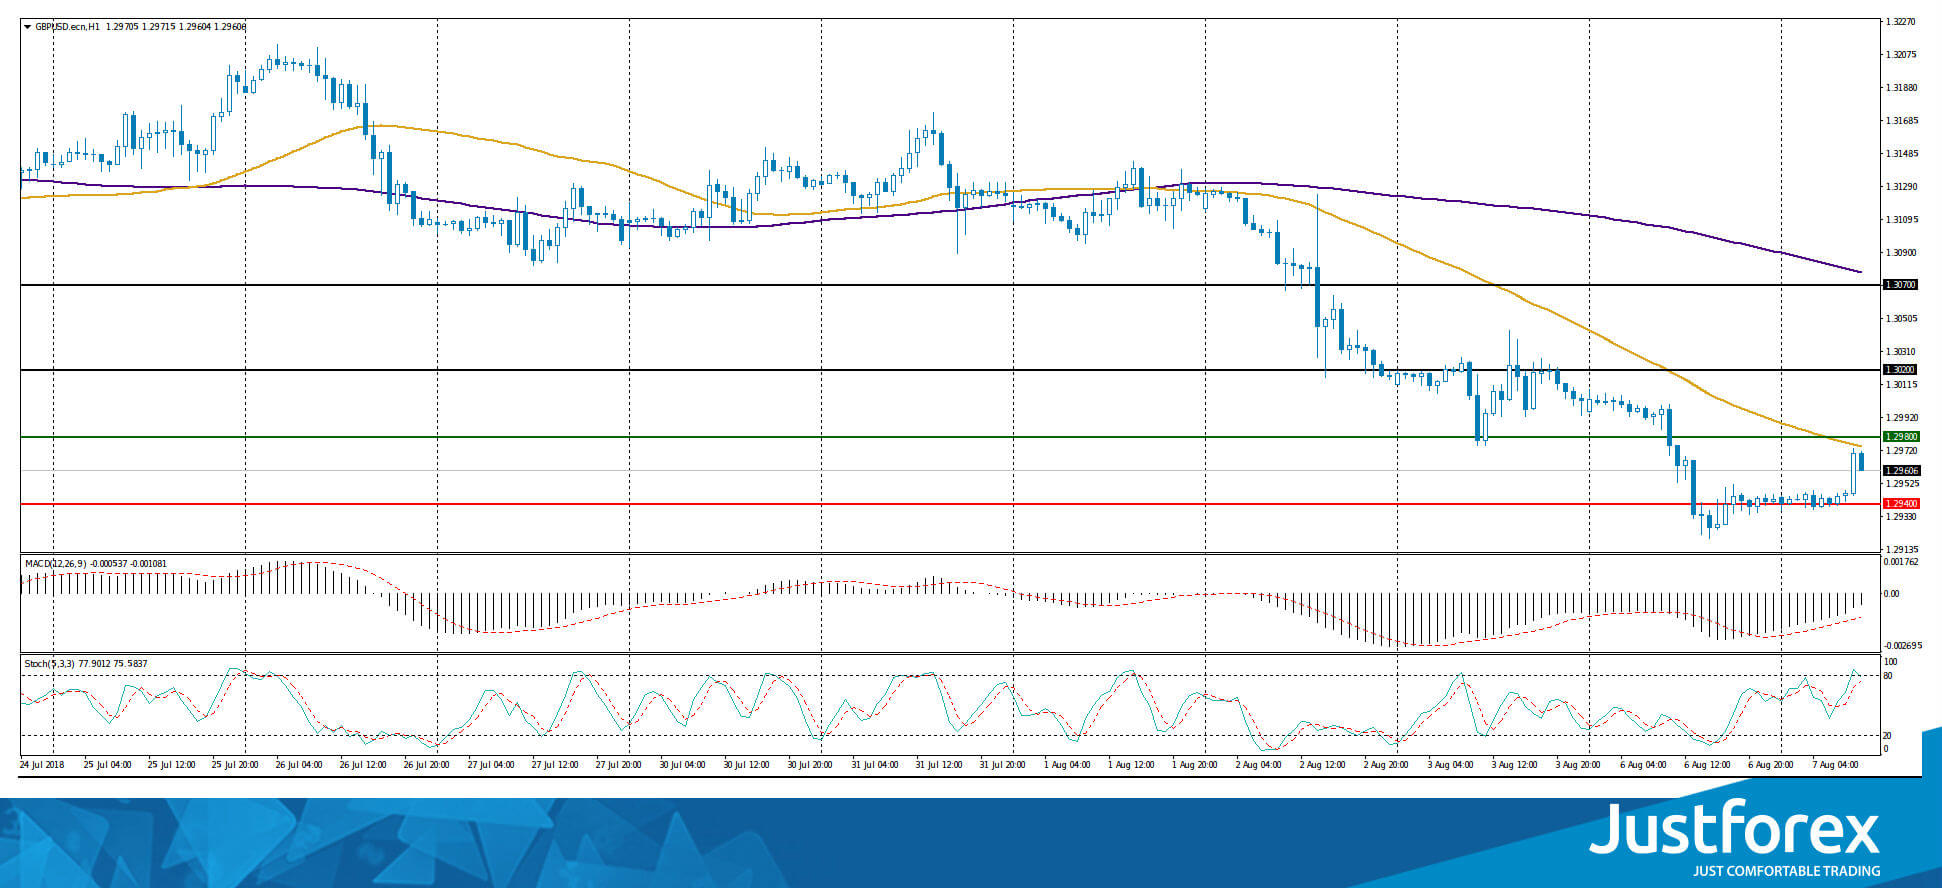
Indicators point to the power of sellers. The price has fixed below 50 MA and 200 MA.
The MACD histogram is in the negative zone, but above the signal line, which gives a weak signal to sell GBP/USD.
Stochastic Oscillator is located in the neutral zone, the %K line is crossing the %D line. There are no accurate signals.
Trading recommendations
Support levels: 1.29400, 1.29000
Resistance levels: 1.29800, 1.30200, 1.30700
If the price fixes below 1.29400, a further decline of the currency pair is expected. The movement is tending to 1.29000-1.28800.
Alternative option. If the price fixes above the resistance of 1.29800, it is necessary to look for entry points to the market to open long positions. The movement is tending to 1.30200-1.30400.
The USD/CAD currency pair
Technical indicators of the currency pair:
Prev Open: 1.29925
Open: 1.30025
% chg. over the last day: -0.09
Day's range: 1.29880 – 1.29943
52 wk range: 1.2059 – 1.3795
Yesterday, there was a variety of trends on the USD/CAD currency pair. At the moment, quotes are declining. Local support and resistance levels are 1.29700 and 1.30000, respectively. The positions should be opened from these marks. We recommend paying attention to the dynamics of oil quotes.
At 17:00 (GMT+3:00) the index of economic activity from Ivey will be published in Canada.
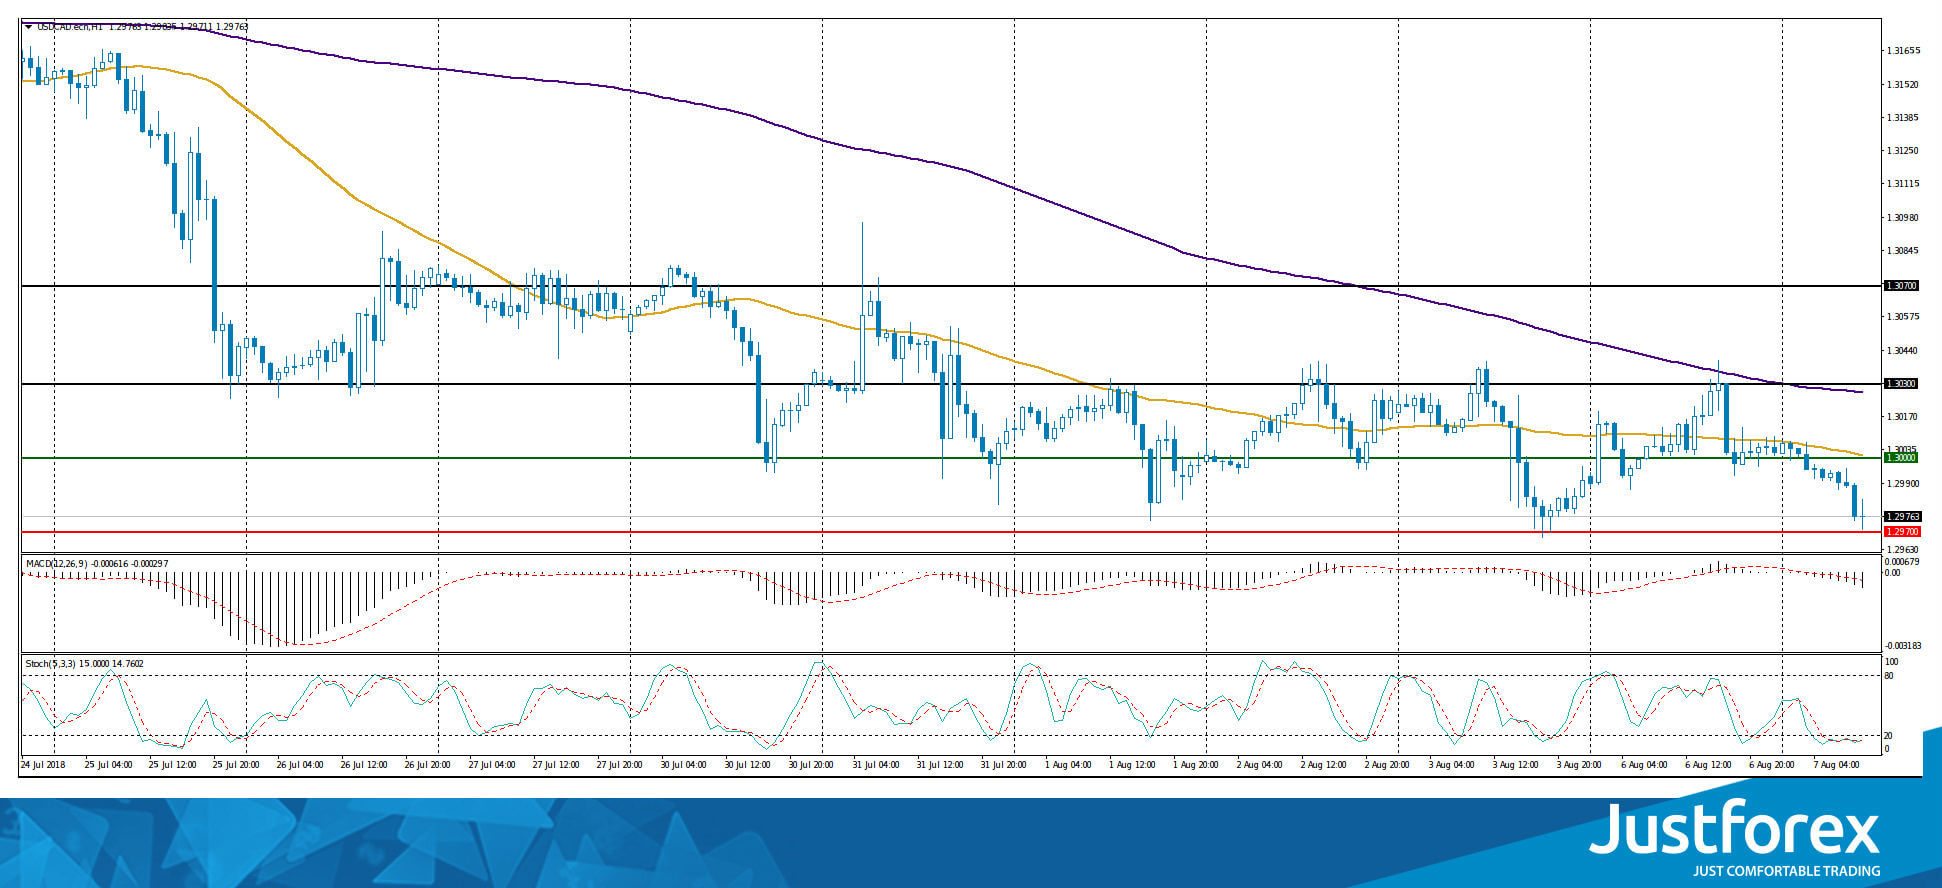
Indicators point to the power of sellers: the price has fixed below 50 MA and 200 MA.
The MACD histogram is in the negative zone and below the signal line, which gives a strong signal to sell USD/CAD.
Stochastic Oscillator is located in the oversold zone, the %K line is crossing the %D line. There are no accurate signals.
Trading recommendations
Support levels: 1.29700, 1.29300, 1.29000
Resistance levels: 1.30000, 1.30300, 1.30700
If the price fixes above the round level of 1.30000, we recommend considering purchases of USD/CAD. The target movement level is 1.30300-1.30500.
Alternative option. If the price fixes below 1.29700, the USD/CAD quotes are expected to decline. The movement is tending to 1.29400-1.29200.
The USD/JPY currency pair
Technical indicators of the currency pair:
Prev Open: 111.214
Open: 111.322
% chg. over the last day: +0.09
Day`s range: 111.312 – 111.367
52 wk range: 104.56 – 114.74
The technical pattern on the USD/JPY currency pair is ambiguous. The USD/JPY quotes are in a sideways trend. Investors expect additional drivers. Local support and resistance levels are 111.200 and 111.450, respectively. The positions should be opened from these marks.
The news feed on the economy of Japan is calm.
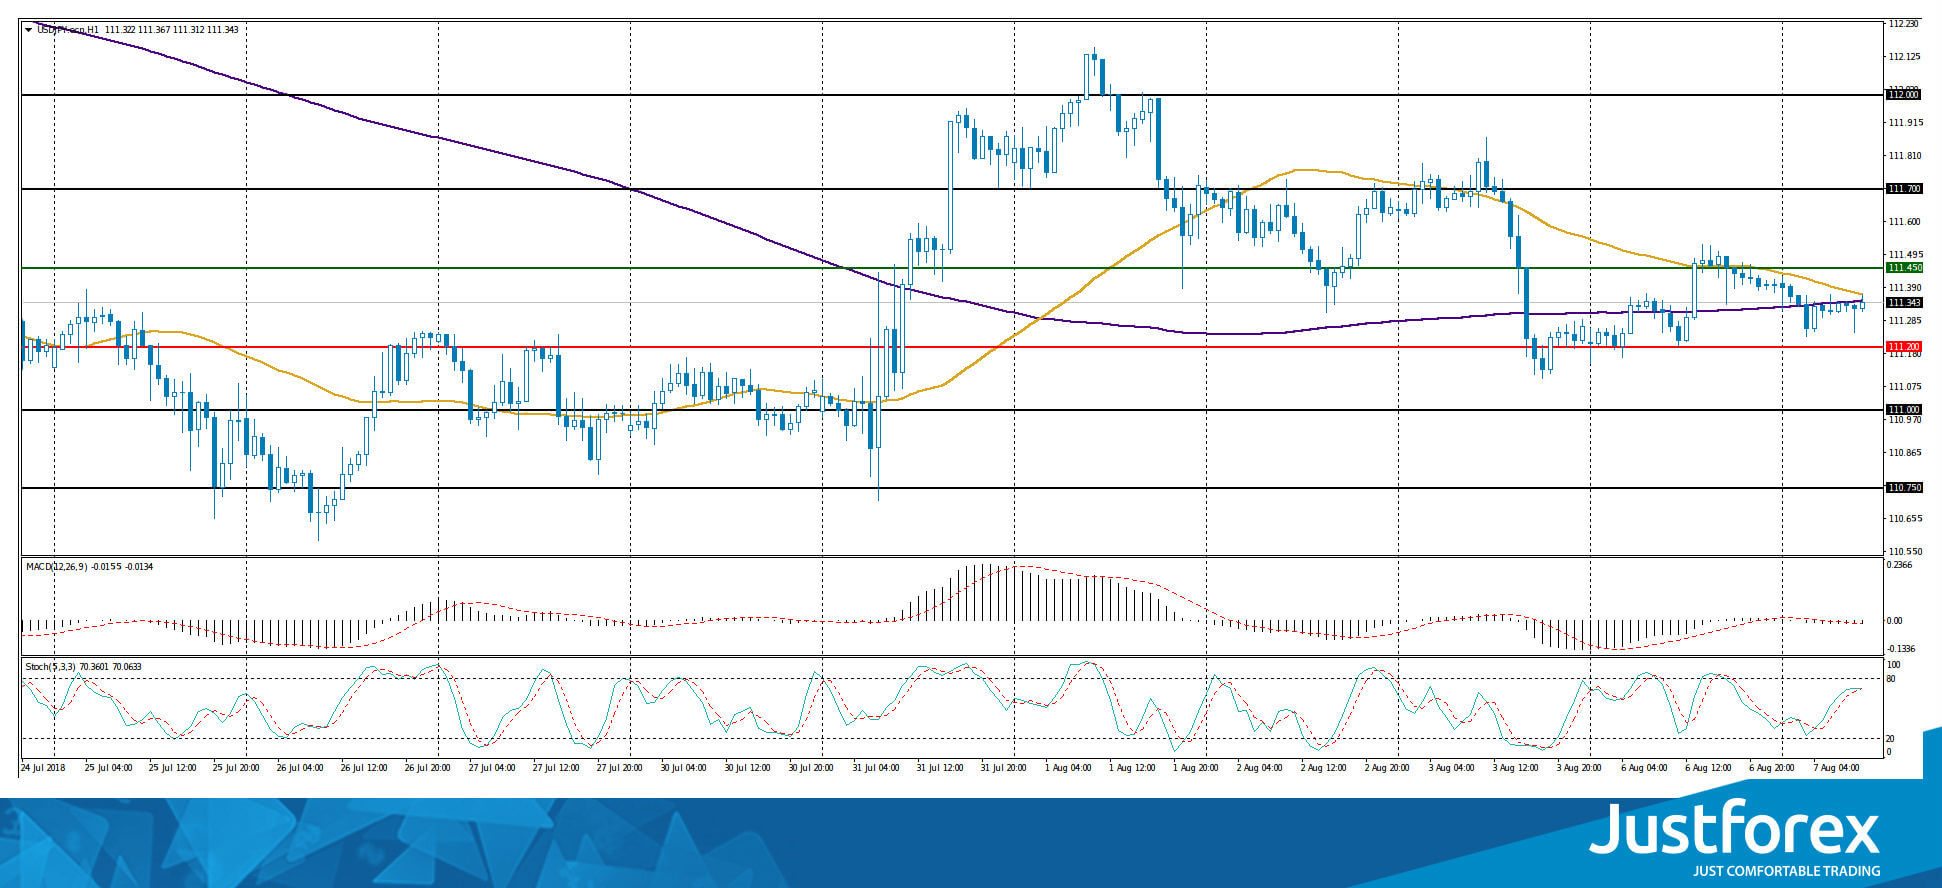
Indicators do not send accurate signals. 50 MA has crossed 200 MA.
The MACD histogram is near the 0 mark.
Stochastic Oscillator is located in the neutral zone, the %K line is crossing the %D line. There are no accurate signals.
Trading recommendations
Support levels: 111.200, 111.000, 110.750
Resistance levels: 111.450, 111.700, 112.000
If the price fixes below 111.200, the USD/JPY quotes are expected to decline. The movement is tending to 111.000-110.750.
Alternative option. If the price fixes above the level of 111.450, it is necessary to consider purchases of USD/JPY. The movement is tending to 111.700-112.000.
RBA Keeps Policy Rate at Record Low for Two Years; Might Downgrade 2018 Inflation Forecast
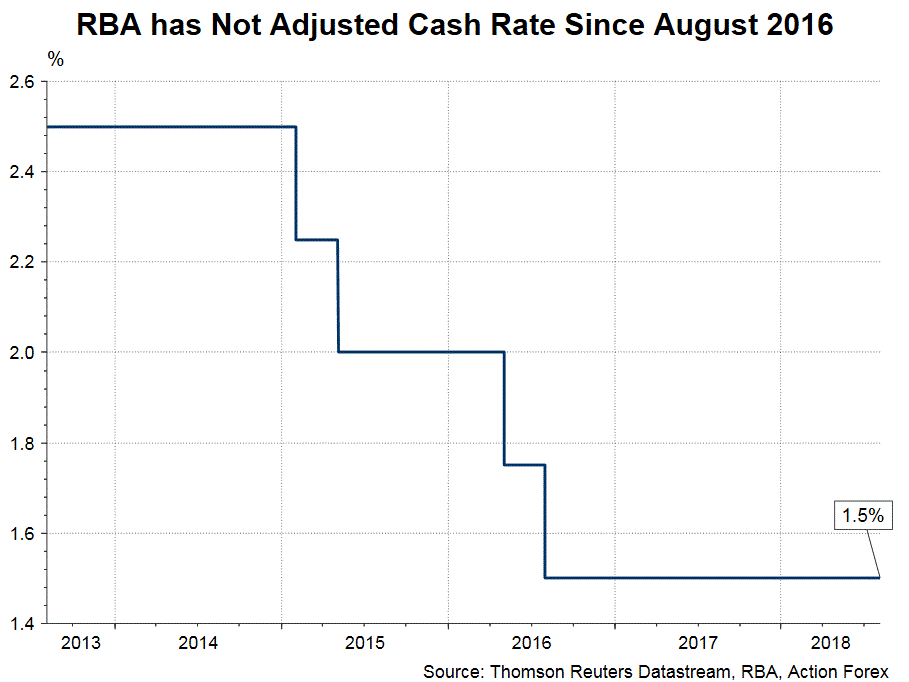
RBA left the cash rate unchanged at 1.5% for the 22nd meeting today. The accompanying statement continued to deliver a “neutral” tone on the future path of the monetary policy. Since the last meeting, domestic economic growth has stayed, and will stay, “above trend” while the job market has continued to improve. Wage growth has remained soft but the worst is likely over. Hopefully, this would help lift household consumption which has been RBA’s major concern. The statement had more coverage of inflation that the previous one. The discussion signals that RBA might downgrade its inflation forecast at the upcoming Statement of Monetary Policy.
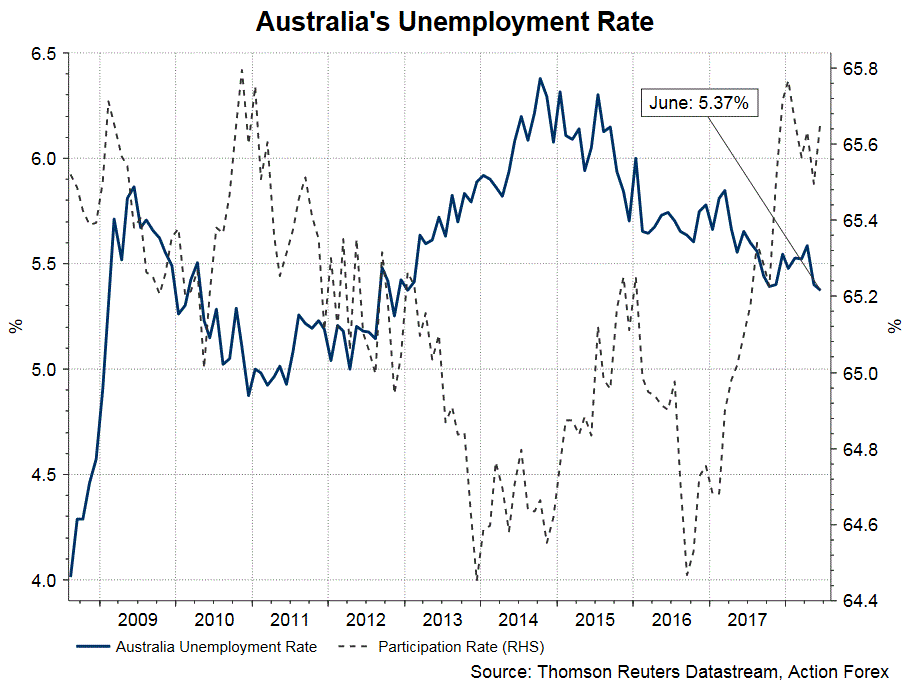
RBA maintained the estimate that Australia’s GDP growth would “average a bit above +3% in 2018 and 2019, adding that this “should see some further reduction in spare capacity”. Meanwhile, it indicated that higher levels of public infrastructure investment are supporting the economy, as well as “growth in resource exports”. The central bank reiterated that the outlook of household consumption has remained uncertain as “household income has been growing slowly and debt levels are high”. It added at this meeting that “the drought has led to difficult conditions in parts of the farm sector”. Policymakers remained “positive” over the job market, suggesting that “further gradual decline in the unemployment rate is expected over the next couple of years to around 5%. They acknowledged that wage growth remained low but maintained the view that the rate has bottomed and growth would be lifted by the improvement in the economy.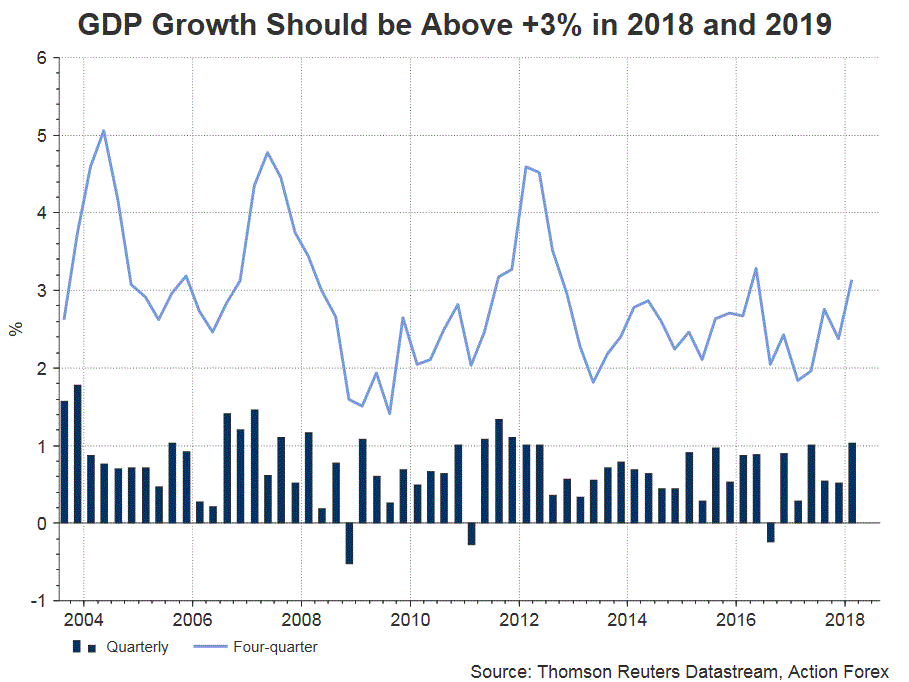
The central bank covered a bit more about inflation at the meeting. As noted in the statement, inflation has been “in line” with RBA’s expectations with headline CPI and core CPI at +2.1% and close to +2%, respectively, in the past year. It suggested that the central forecast is “for inflation to be higher in 2019 and 2020 than it is currently”. Meanwhile, it noted that “once-off declines in some administered prices in the September quarter are expected to result in headline inflation in 2018 being a little lower than earlier expected, at +1.75%”. This signals that we might see downward revision in inflation forecast at the Statement of Monetary Policy due Friday. Back in May, RBA forecast that headline inflation would run between 2-2.25% for the remainder of 2018.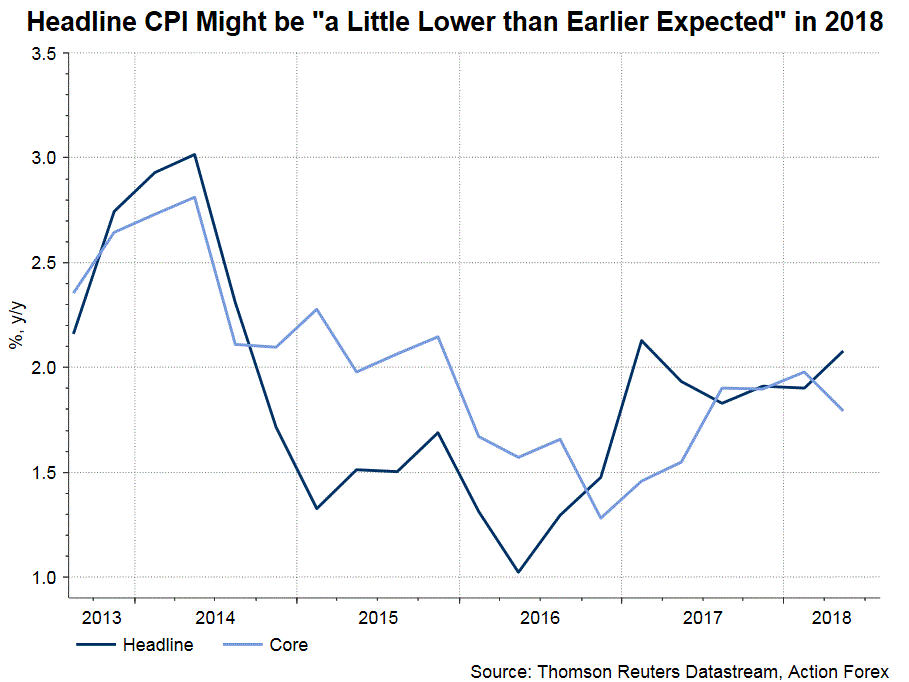
RBA affirmed that financial conditions have remained “expansionary”. It acknowledged that while money-market interest rates at home climbed higher from the start of the year, they have “declined somewhat since the end of June”. The members indicated that the higher rates have “not fed through into higher interest rates on retail deposits”. Although some banks have raised mortgage rates slightly, the average mortgage rate has actually reduced from a year ago. Nonetheless, RBA acknowledged that housing prices in Sydney and Melbourne have “continued to ease” while “nationwide measures of rent inflation remain low”, as a result of tighter lending standards and slower demand from investors.
Globally, the members acknowledged that Chinese economic growth has “slowed a little, with the authorities easing policy while continuing to pay close attention to the risks in the financial sector”. Otherwise, they maintained the view that global economy has continued to expand despite uncertainty coming from US trade policy.
Demand For The US Dollar Is Still High
Yesterday, the US currency strengthened against the basket of major currencies. The US dollar index (#DX) updated a two-week high and closed in the positive zone (+0.24%). Investors' expectations regarding further increase in the key interest rate support the dollar. Last week, the US published mixed data on the labor market. At the same time, the Fed officials note that labor market conditions are good and expect a stable growth in the US economy.
The British pound has updated annual lows after a Secretary of State for International Trade Liam Fox announced that the UK is more likely to exit from the European Union without signing any agreements. The official also accused the European Commission that it did not make concessions and did not seek to achieve economic prosperity.
Today, during the Asian trading session, the Reserve Bank of Australia has decided on the key interest rate. The regulator, as expected, kept the interest rate at the previous level of 1.50%.
The "black gold" prices are rising. At the moment, futures for the WTI crude oil are testing a mark of $69.2 per barrel. At 23:30 (GMT+3:00), a report on the API weekly crude oil stock will be published.
Market Indicators
Yesterday, the bullish sentiment was observed in the US stock market: #SPY (+0.37%), #DIA (+0.18%), #QQQ (+0.59%).
At the moment, the 10-year US government bonds yield is at the level of 2.94-2.95%.
The news feed on 2018.08.07:
JOLTS job openings in the US at 17:00 (GMT+3:00);
The index of economic activity in Canada from Ivey at 17:00 (GMT+3:00).
China foreign exchange reserves rose 0.19% in July
The Chinese State Administration of Foreign Exchange said in its website that at the end of July this year, the country was holding USD 3.1179T in foreign exchange reserves, up USD 5.8B, or 0.19% from end of June.
SAFE said that cross-border capital flows were generally stable. And, supply and demand in the foreign exchange markets was balanced. The jump in FX reserve was primarily due to non-US dollar currency exchange rate conversion and asset price changes
However, SAFE also noted the volatility in global financial markets and the "double rally" in USD exchange rates and interest rates. Some emerging markets were hit hard because of that. Additionally, "external uncertainties" increased due to escalating trade conflicts.
Consolidation On USDCHF Points Above 1.007 Area
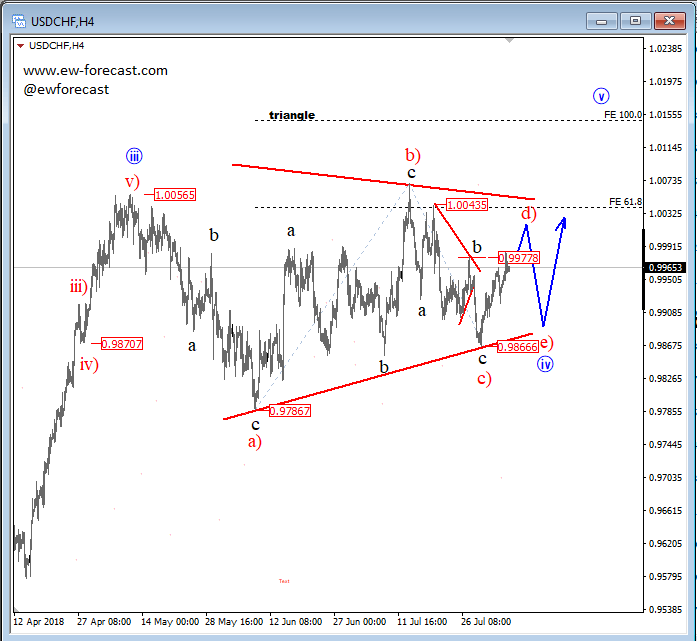
USDCHF is trading in a bigger, sideways pattern known as a Elliott wave triangle correction. We see three of the five needed waves unfolded, so leg d) can now be in play from the 0.9866 level with three of its own minor waves, which can later look for resistance and a bearish turn into wave e) at the 0.9978 level or maybe from the 1.000 psychological price. That said, we will have to wait more time before we may see a strong break to the upside.
USDCHF, 4h
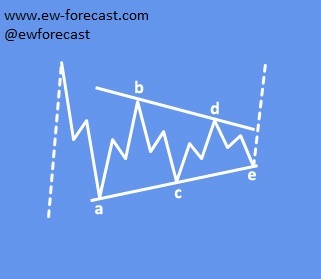
A Triangle is a common 5-wave pattern labeled A-B-C-D-E that moves counter-trend and is corrective in nature. Triangles move within two channel lines drawn from waves A to C, and from waves B to D. A Triangle is either contracting or expanding depending on whether the channel lines are converging or expanding. Triangles are overlapping five wave affairs that subdivide 3-3-3-3-3.
Triangles can occur in wave 4, wave B, wave X position or in some very rare cases also in wave Y of a combination.
EUR/USD Consolidates
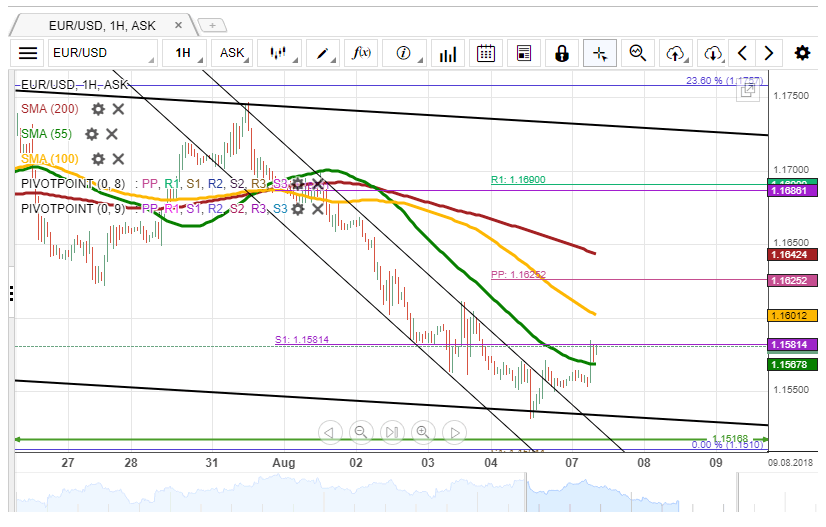
Due to the lack of outside pressure, Monday's trading session was relatively calm for the EUR/USD exchange rate, as it remained fluctuating between the 55-hour SMA and a senior channel line. A breakout from this moving average is necessary to consider going long on the pair.
Given that technical indicators on the 1H and 4H time-frames are starting to show signs of a possible recovery, this confirmation is expected to occur in the nearest time. The most likely upside target during the following days is the 100– and 200-period (4H) SMAs near 1.1665.
Meanwhile, the Euro might be reluctant to move past the weekly S1 located at 1.1540, as this is the pair's lowest position in a year. Thus, even if a surge does not occur today, losses should likewise be limited.
GBP/USD Supported By Monthly S1
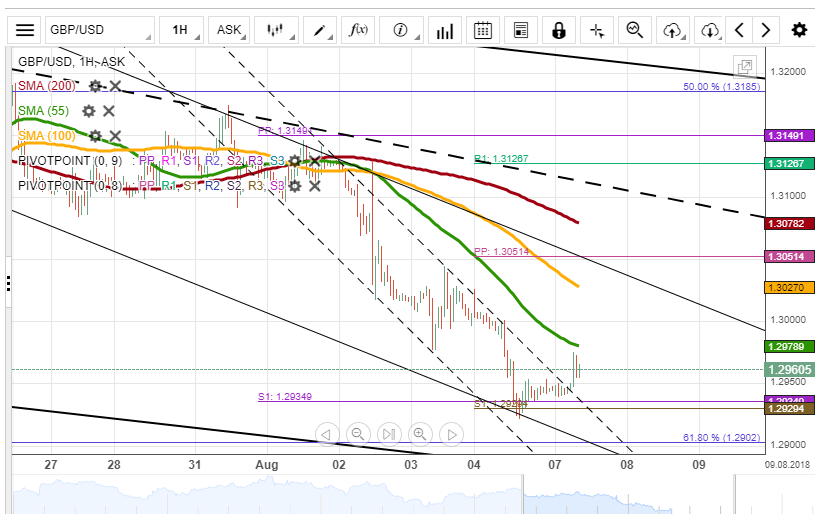
The Pound was pressured lower against the US Dollar early on Monday. This decline was limited, as the strong support of the monthly and weekly S1s at 1.2930 stopped any attempts to push the rate significantly lower. The pair subsequently remained trading in a narrow range above this cluster and remained there on Tuesday morning, as well.
Technical indicators flash bearish signals, suggesting that this fall should continue today. However, it is rather unlikely that significant bearish pressure is put on the pair, especially if no important data releases are scheduled for today. In addition, the 61.80% Fibonacci retracement and a senior channel line are located nearby to support the Sterling.
If the 55-hour SMA is breached, the next target is the weekly PP and the 100-hour SMA.
USD/JPY Fails To Accelerate
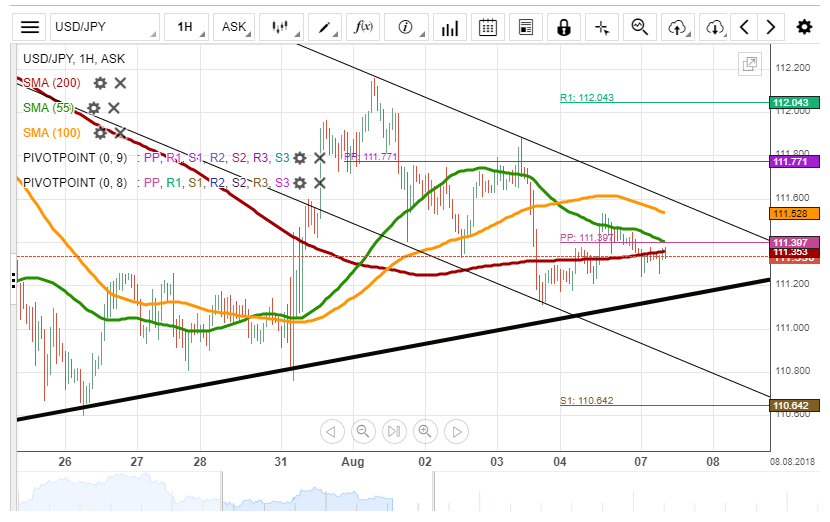
Monday's trading session has not introduced any changes to USD/JPY's positioning which was mainly due to the 55–hour and 200-period (4H) SMAs surrounding the rate. As a result, the expected test of the upper boundary of the junior channel did not occur.
It is likely that the 200-period SMA proves to be stronger than its 55-hour counterpart, thus putting more weighting on the bullish scenario. The 55– and 100-hour SMAs and the weekly PP must be surpassed for the Greenback to fully accelerate towards the monthly PP at 111.80.
In case the 200-period SMA is stronger, the pair is likely to aim for the psychological 111.00 level and later for the weekly S1 at 110.65.
XAU/USD Halts At One-Year Low
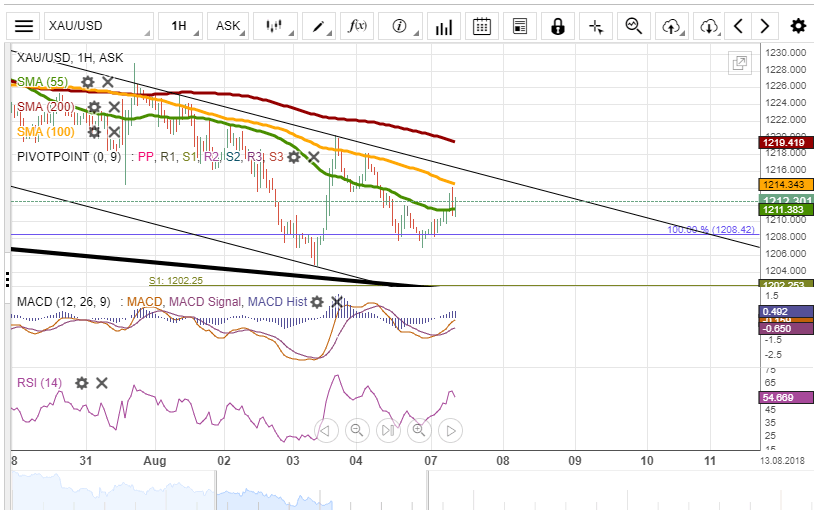
Downside momentum dominated the yellow metal on Monday, as it fell 0.80% mid-session. This fall was stopped by the 100.00% Fibonacci retracement which represents the pair's lowest position since July 2017.
Gold has since recovered, surpassed the 55-hour SMA and was testing the 100-hour moving average early on Tuesday. The pair has already halted two times near this yearly low, so it is likely that a decline below this level does not occur. Thus, traders could look towards the bullish scenario.
The nearest resistance is the aforementioned 100-hour SMA, with the 200-hour and 200-period (4H) ones being located nearby.
GBP/JPY Daily Outlook
Daily Pivots: (S1) 143.90; (P) 144.32; (R1) 144.59; More...
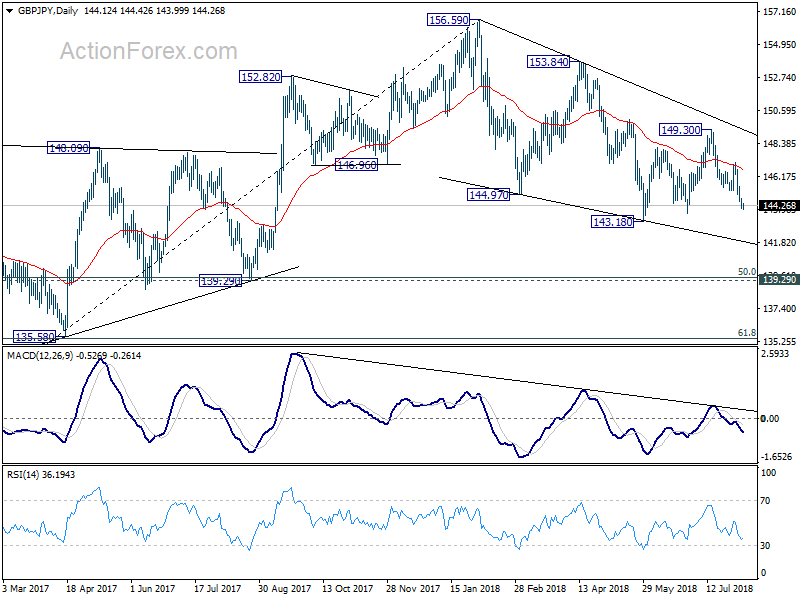
Intraday bias in GBP/JPY stays on the downside for 143.18 key support. Deceive break there will resume larger decline from 156.59 and target 139.29/47 key support level next. On the upside, 144.72 minor resistance will turn intraday bias neutral first. But outlook will stay mildly bearish as long as 147.13 resistance holds.
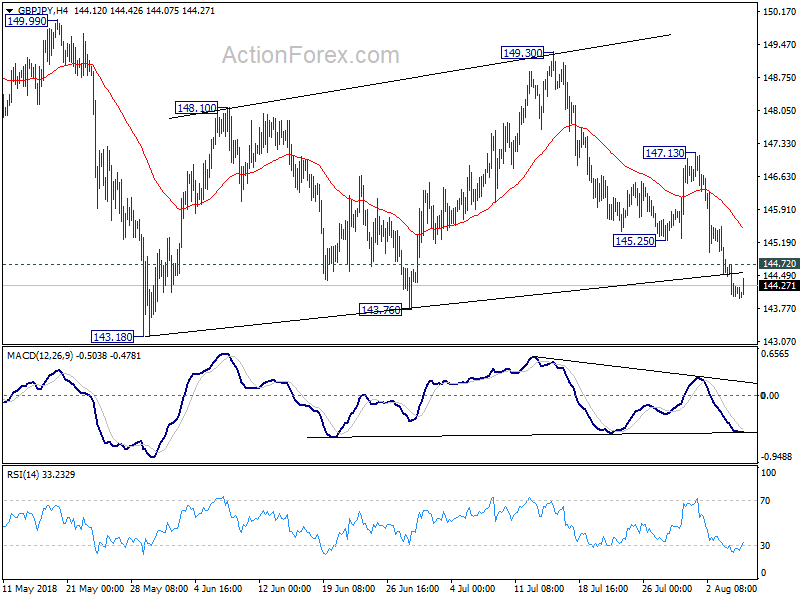
In the bigger picture, decline from 156.59 is seen as a corrective move. In case of another fall, strong support should be seen above 139.29 cluster support (50% retracement of 122.36 to 156.59 at 139.47) to contain downside and bring rebound. Meanwhile, break of 153.84 should confirm that the correction is completed and target 156.59 and above to resume the medium term up trend.