

Sample Category Title
GBPUSD Yet To Reach Extreme Oversold Conditions
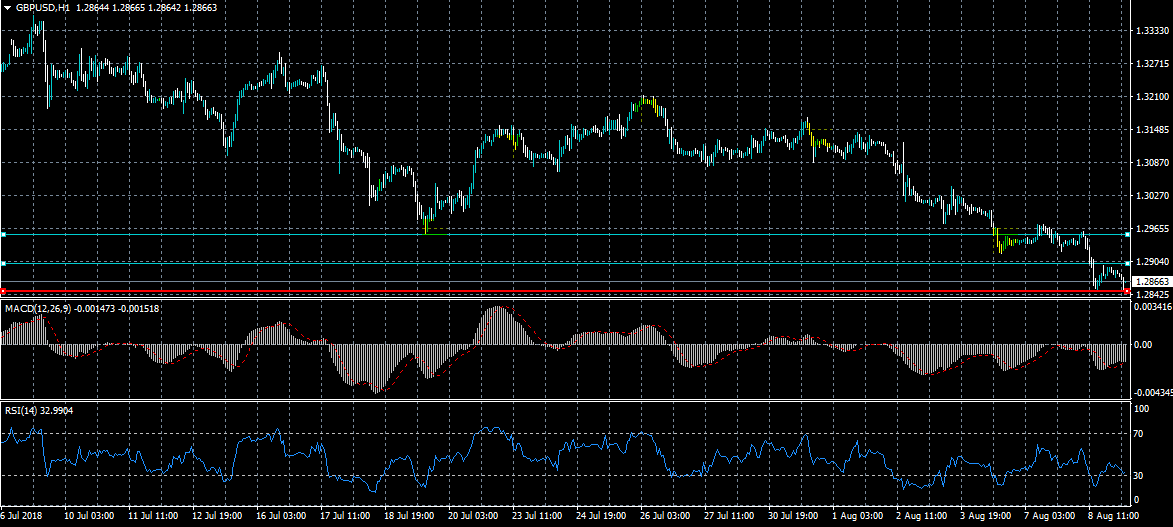
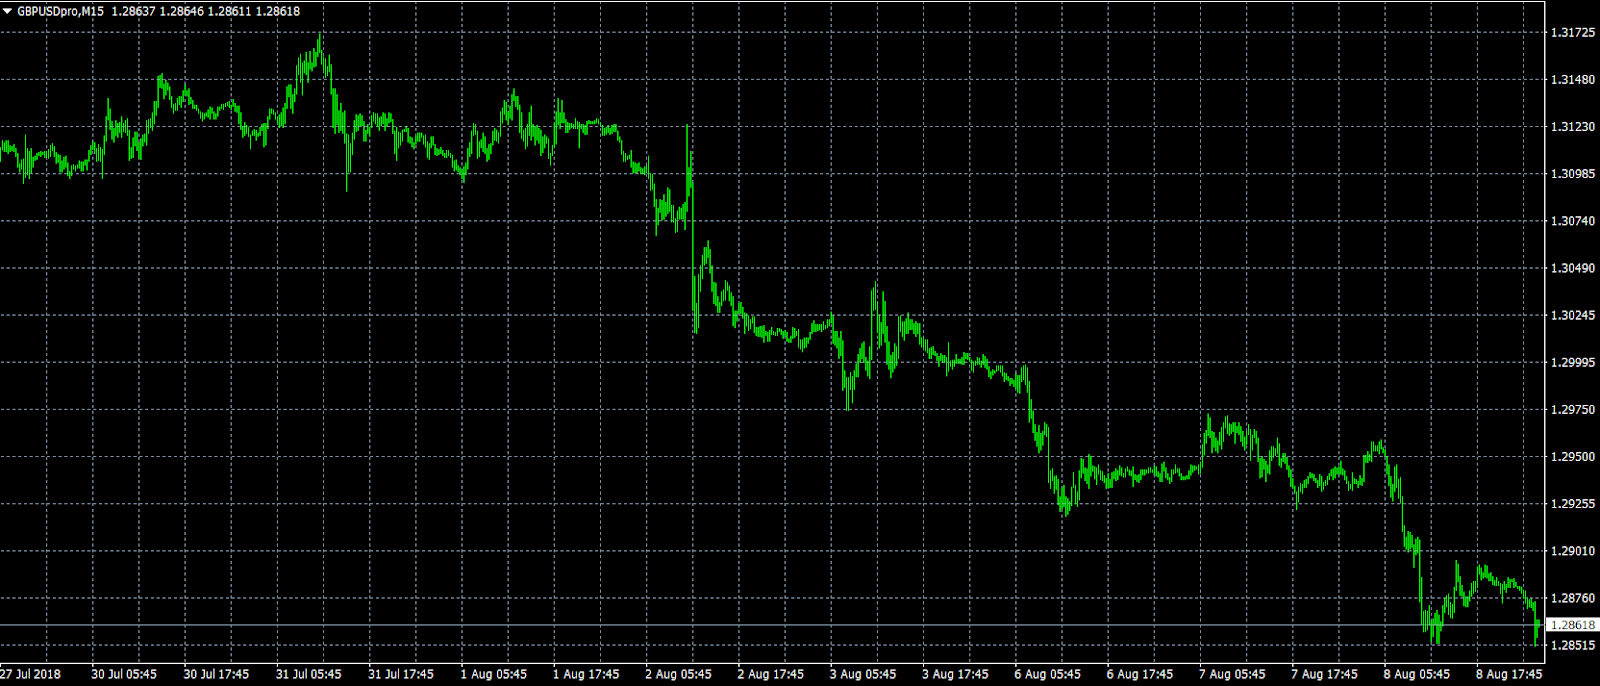
The British pound continues to slump lower against the US Dollar on Thursday, as the fundamentals and technicals surrounding sterling become more bearish. The GBPUSD pair still has scope to fall below the 1.2800 level as the bearish head and shoulders pattern plays-out. The MACD and RSI indicators across the lower-time frames have still not reached extreme oversold conditions.
The GBPUSD pair remains strongly bearish while trading below the 1.2955 level, key support is found at the 1.2810 and 1.2750 levels.
If the GBPUSD pair moves above the 1.2900 resistance level, key intraday resistance is now found at the 1.2922 and 1.2955 levels
Crypto Free Fall Continues After Sec Delays Etf Decision
After weeks of sustained gains, cryptocurrency prices fell after the U.S. Securities and Exchange Commission (SEC) announced on Tuesday that it would delay making a decision on a proposed Bitcoin exchange-traded fund (ETF) by VanEck. Over the past five days, Bitcoin, Ethereum, Ripple, and Litecoin have declined by 14.5%, 13%, 22%, and 19% respectively with the crypto market cap dropping by more than $30 billion.
An ETF is a financial product that tracks the price of an asset and is listed on an exchange. The proposed ETF by VanEck was set to be the first financial product of its kind. VanEck is a leading ETF and mutual funds provider with more than $47 billion in assets under management. It has hundreds of ETFs in almost all sectors and regions, which raises the likelihood that the SEC will eventually accept its proposal although the delay has had a somewhat negative effect on the crypto sector.
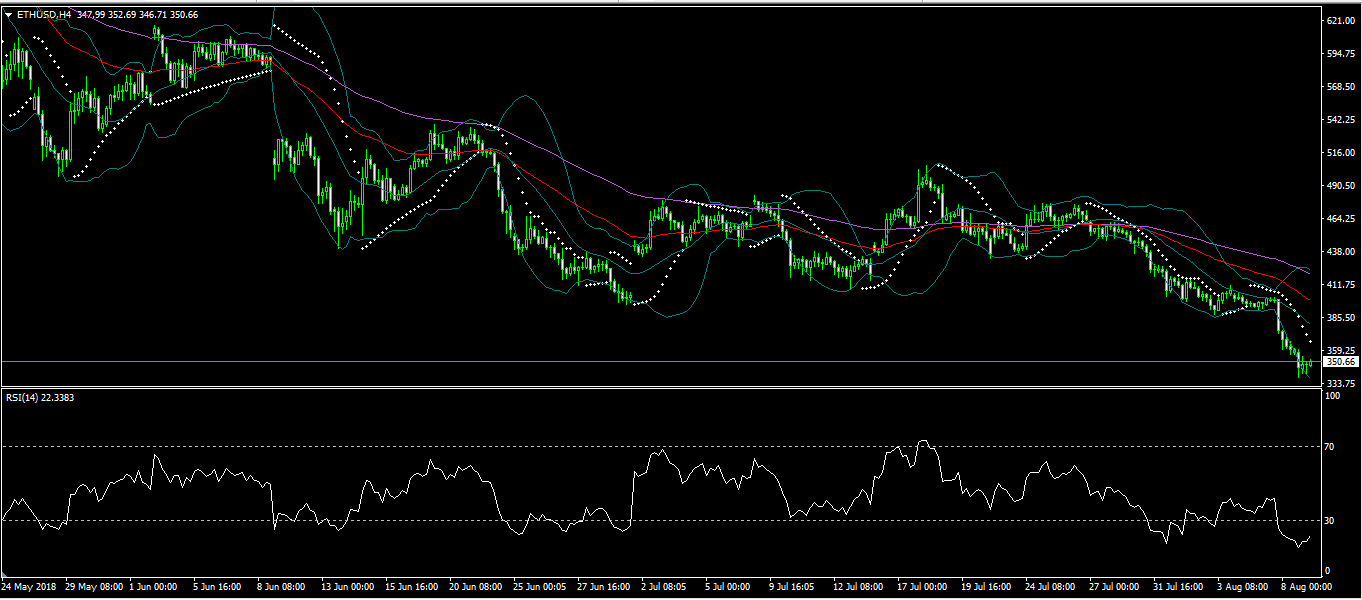
Ethereum is now trading at $350. This is the lowest level since November last year. The price is below the 100 and 200-day exponential moving averages. Its RSI is currently at 21 on the four-hour chart; the lowest level in weeks. The parabolic SAR points to a sustained downward movement as the pair trades at the lower Bollinger Band level. There is a likelihood that the pair will continue moving lower to test the $300 level unless it is supported by positive news.
US Inflation Data In The Headlines On Thursday
US economic data returns to the spotlight on Thursday with inflation and jobless claims making the rounds early in North American trade. The inflation scorecard will dominate the headlines in the latter half of the week as traders eye US consumer prices on Friday.
Following a downbeat European session, North American trade begins with a report on Canadian housing starts at 12:15 GMT. Housing starts are projected to fall sharply to an annual pace of 219,500 in July compared with 248,100 the previous month.
Canada will report on new house prices at 12:30 GMT. The new house price index is forecast to creep up 0.1% in June.
In the United States, the Department of Labor will report on producer inflation at 12:30 GMT. The producer price index (PPI) is projected to rise 0.2% compared with June and 3.4% annually.
Labor will also report on weekly jobless claims at 12:30 GMT. The number of Americans filing for first-time unemployment benefits likely rose to 220,000 in the week ended 31 July compared with 218,000 during the previous period.
The Commerce Department will report on wholesale inventories at 14:00 GMT. The dataset, which is a key component of GDP, is forecast to flat-line in June.
Earlier in the day, the Chinese government reported better than expected inflation data, a sign that central bank policies were having their desired effect. China's consumer price index (CPI) strengthened 0.3% in July and 2.1% annually. Factory-gate prices, as measured by the producer price index (PPI), rose 4.6% year-over-year.
AUD/USD
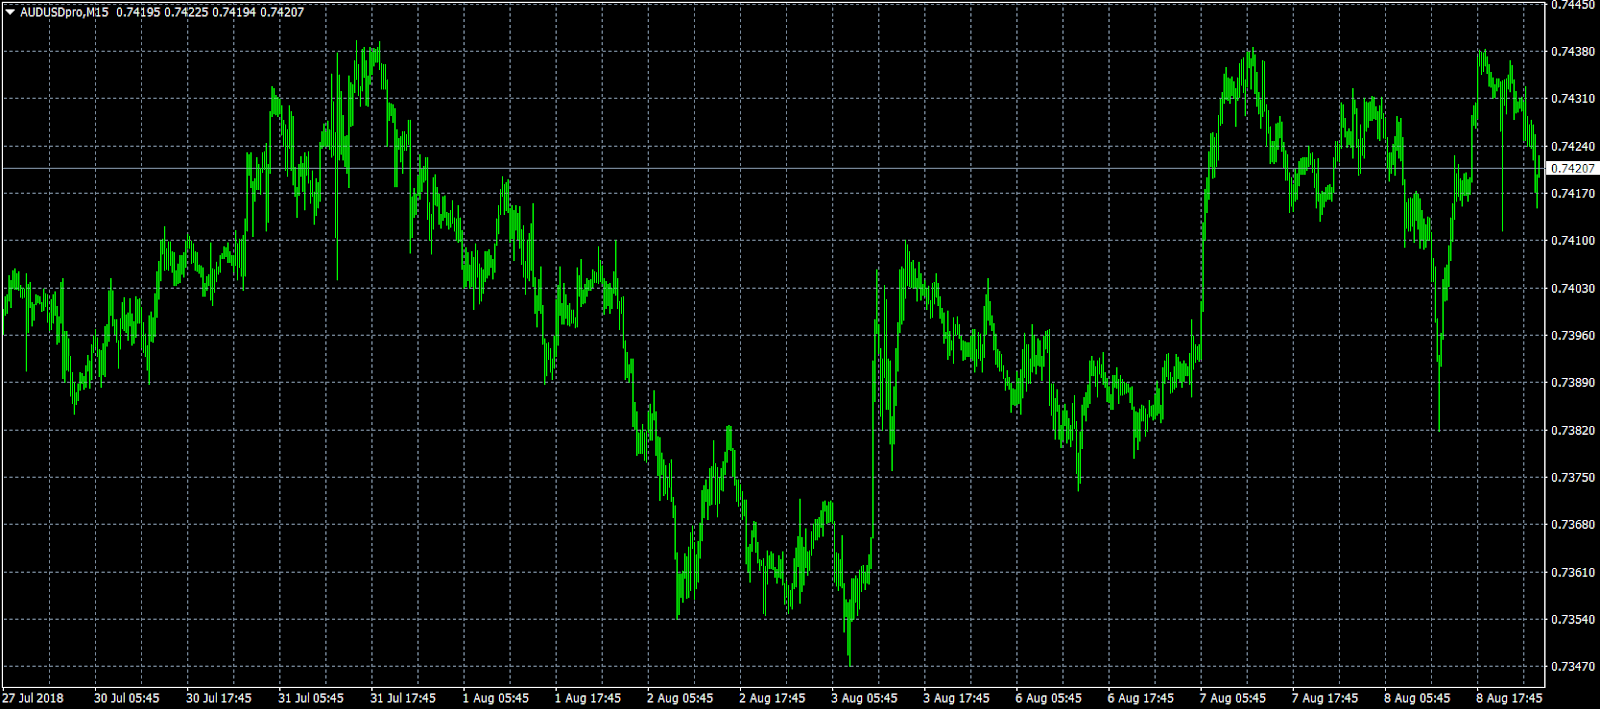
The Australian dollar drifted lower in the wake of Chinese inflation figures, though the downtrend was fairly contained. The AUD/USD exchange rate was down 0.2% at the time of writing to trade at 0.7418. In terms of technical details, the pair is eyeing immediate support at 0.7415, the session low, followed by 0.7381. On the opposite side of the spectrum, immediate resistance is located at 0.7437 followed by 0.7490.
EUR/USD
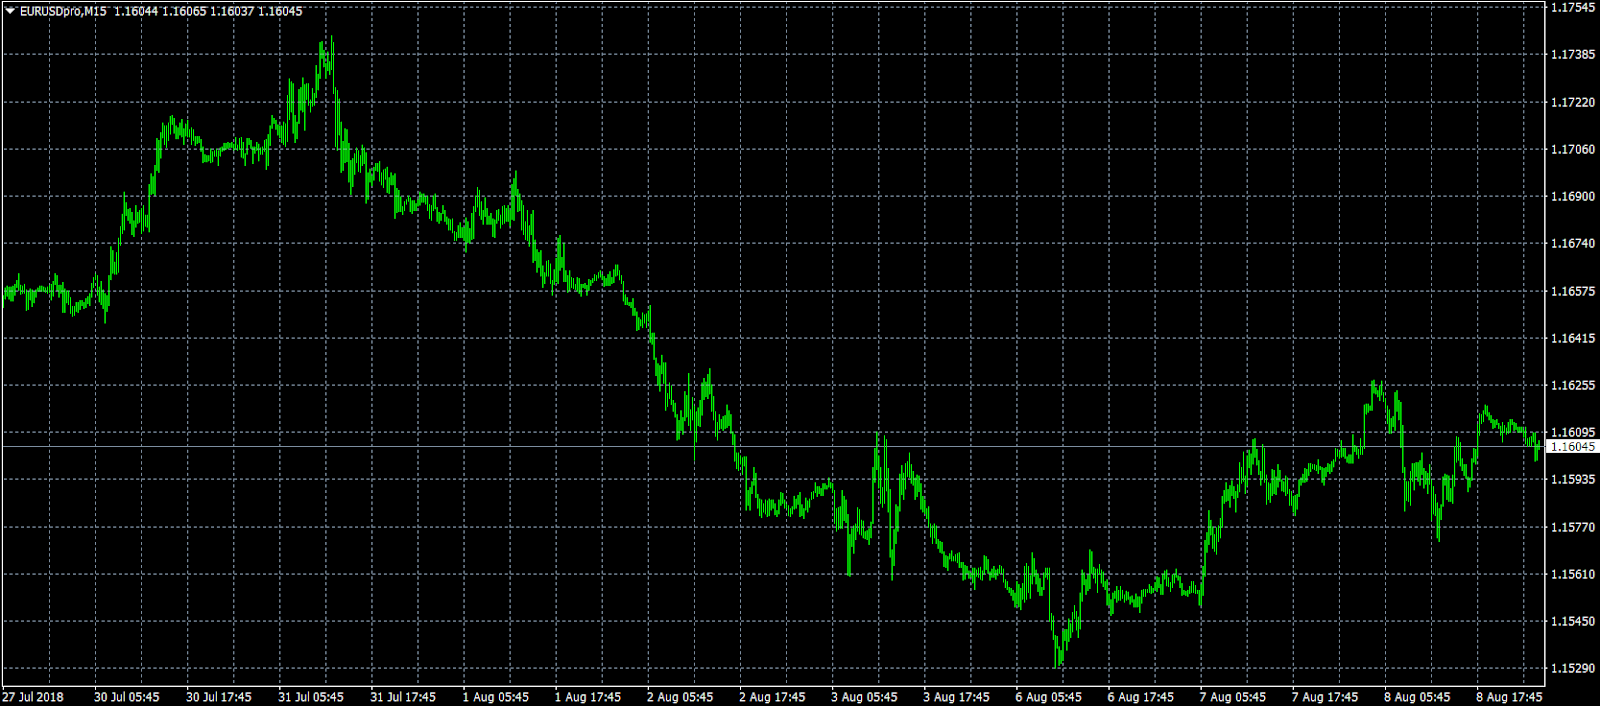
Europe's common currency successfully reclaimed the 1.1600 US handle on Tuesday but was unable to make any significant breakthroughs. EUR/USD is currently trading at 1.1607. Initial downside is located at 1.1570, the low from 19 July. On the flipside, the pair faces resistance at 1.1630, followed by 1.1665.
GBP/USD
Cable is trading near an 11-month low as Brexit uncertainty continues to haunt investors. The GBP/USD exchange posted a tepid rally on Wednesday before prices swung back in the opposite direction. The pair is down 0.2% in Asia to trade at 1.2863. With the decline, cable has fallen through the immediate support located at 1.1270, raising the specter of a bigger reversal. Any upside is likely capped at the psychological 1.3000 mark.
Elliott Wave Analysis: OIL Extending To The Downside
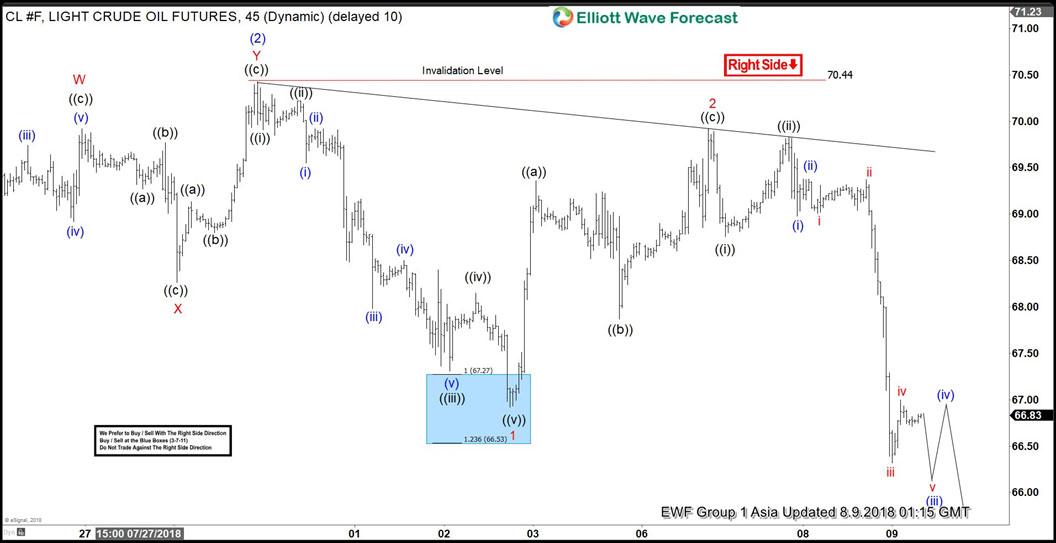
Oil ticker symbol: CL_F short-term Elliott wave analysis suggests that the bounce to $70.44 high ended intermediate wave (2). The internals of that bounce took place as Elliott wave double correction where Minor wave W ended in 3 swings at $69.92. From there, the pullback to $68.26 completed the Minor wave X in 3 swings. Then a bounce higher to $70.44 high ended Minor wave Y in another 3 swings & also completed Intermediate wave (2).
Down from there, the decline is taking place as Elliott wave impulse within intermediate wave (3) lower with the sub-division of 5 waves structure in Minor wave 1, 3 & 5. The initial decline from $70.44 high to $66.92 low ended Minor wave 1 of (3). The lesser degree cycles within that decline also unfolded in 5 waves structure & ended Minute wave ((i)) at $69.91. Minute wave ((ii)) ended at $70.22, Minute wave ((iii)) ended at $67.31 low, Minute wave ((iv)) bounce ended at $68.15 and Minute wave ((v)) of 1 ended at $66.92 low. Above from there, the bounce to $69.92 high ended Minor wave 2.
The internals of Minor wave 2 unfolded in 3 swings as Elliott wave zigzag correction where Minute wave ((a)) ended in 5 waves at $69.36. Minute wave ((b)) ended at $67.87 low and the bounce to $69.92 high ended Minute wave ((c)) of 2. Down from there, Minor wave 3 remain in progress in another 5 waves and as far as bounces fail below $69.92 high and more importantly the pivot from $70.44 high stays intact instrument is expected to see more downside. We don’t like buying it as the right side tag is lower.
OIL 1 Hour Elliott Wave Chart
China Shanghai SSE breaches 2800 as tech stocks boosted by government focus
Chinese stocks are enjoying a strong rally today. The Shanghai SSE breaches 2800 handle and is holding 2% gain. Tech stocks led the way higher as the government indicated strong focus in development in the sector. Yesterday, the State Council renewed the " National Science, Technology and Education Leading Group" to "National Science and Technology Leading Group", showing the dedication in science and technology.
The group is headed by Premier Li Keqiang with Vice-Premier Liu He as deputy. Fourteen high level officials from National Development and Reform Commission, the Ministry of Education, and the Ministry of Science and Technology are also part of the group.
The major responsibilities of the group include studying and reviewing national strategies, plans and major policies for sci-tech development; deliberating major national scientific tasks and projects, and coordinating major sci-tech affairs among ministries, departments and local authorities.
77% economists expect no BoJ stimulus exit until 2020 or later
According to a Reuters poll, 73% of economists surveyed expected that BoJ will not start unwinding stimulus until 2020 or later. That's nearly double of 37% last month. Around one third said BoJ's July announcement as a small step on crafting the exit strategy. BoJ explicitly talked about allowing 10 year JGB yield to move between -0.1% and 0.1%. 77% of economists believed that would help bond market functioning.
On the economy, economists projected core CPI, excluding sales tax hike impact, to rise 0.9% in the fiscal year to March 2019, same as the prior fiscal year. That' notably lower than BoJ's own forecasts of 1.1% in fiscal 2019 and fiscal 2019. Economists also saw Japan GDP to grow 1.1% this fiscal year and then slow to 0.8% next.
The poll was taken from Aug. 3 to 8.
US Equity Markets Was Range Bound Yesterday
Market movers today
With another quiet day on the economic data front, the market will focus on geopolitical developments around Russia and Turkey, where the US has adopted new sanctions.
On the data front, the main interest is on the US PPI headline and core numbers for July, which are assumed to remain modest at the same levels as in the previous month. The core PPI rate will then be running at 2.8% y/y. The rate has been increasing as the cost of services has been rising. The initial jobless claims will also be released.
Financial markets will also be watching the Russian reaction to yesterday's US sanctions, which were imposed due to the possible Russian involvement in the nerve gas attack on two Russians in the UK in March this year. Also yesterday, the Russian media leaked a proposal by US Congress for a new round of US sannctions against Russia in relation to claims of Russian interference with the 2016 elections.
In relation to Turkey, the meeting between the Turkish delegation and US government officials in Washington will be followed very closely given the possible impact on Turkish financial markets.
Selected market news
The 10Y US Treasury auction saw good demand despite the US Treasury department selling a record amount of 10Y bonds at the auction. The bid-to-cover was 2.5 and 10Y yields ended Wednesday 1bp lower. The 30Y government bond auction in Japan this morning drew decent investor interest. The bid-to-cover was bit a lower relative to the last 30Y auction in July, but higher than the average seen this year in the 30Y auctions.
The US equity markets was range bound yesterday. The S&P is still trading close to the highs since in January.
The Russian ruble is under pressure as the US plans more sanctions. The new sanctions come after the US determined that Russia was behind a nerve gas attack on a former Russian spy in the UK. See more in the FX section.
It is again a mixed picture for the Asian equity markets this morning. China is preparing to retaliate against the rise in US tariffs, and has announced that it will impose tariffs of 25% on USD16bn of US goods imported by China.
USD/JPY Needs To Break Support For Impulsive Wave-C
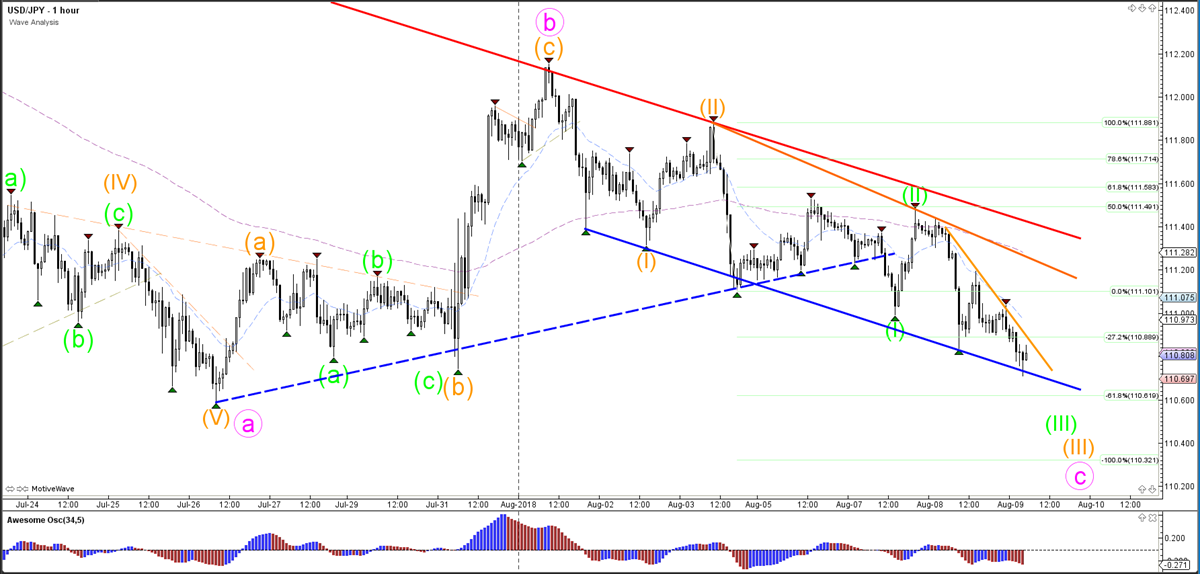
The USD/JPY downtrend channel is now challenging two key support trend lines (blue). The support zone is a critical spot for a bullish bounce or bearish break. A bullish bounce could indicate a larger and expanded wave B, whereas a bearish break could confirm the continuation of a wave C (pink).
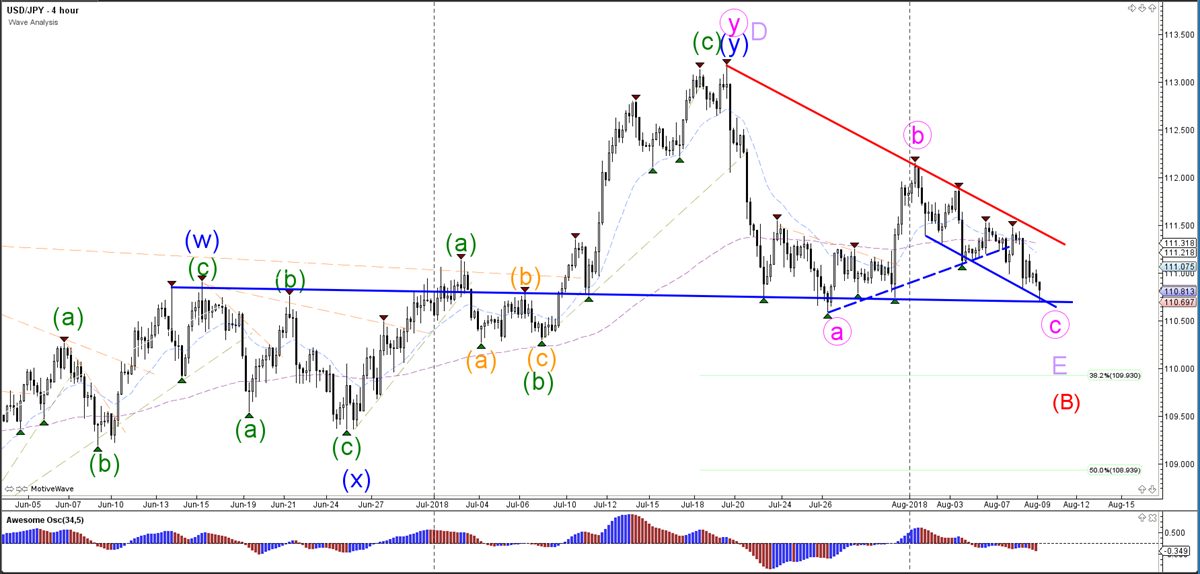
The USD/JPY needs to break below the support of the downtrend channel to confirm the potential waves 3, otherwise the bearish price action is looking quite choppy. Impulsive price action is needed to confirm the development of a wave 3.
EUR/USD Prepares For Bullish ABC Zigzag Pattern
The EUR/USD made a bearish pullback after the strong bullish rally earlier this week. What is the next wave pattern for this largest currency pair?
The EUR/USD correction is complex and choppy and could unfold in numerous ways. For the moment, a larger WXY (pink) correction seems the most likely scenario. The recent bottom could have completed a wave X (pink).
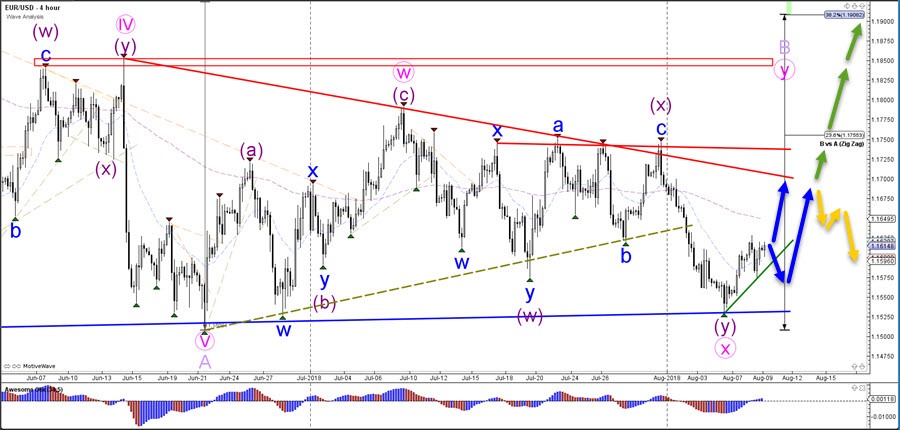
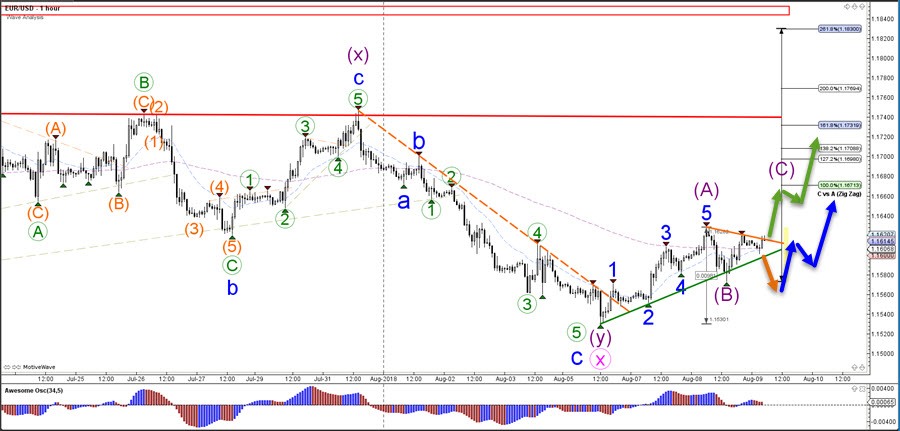
The EUR/USD seems to have completed 5 bullish waves (blue) within a larger wave A (purple). The 5-wave pattern could indicate a larger bullish ABC zigzag (purple). A bearish break below the support trend line (green) could indicate an expanded ABC correction within wave B (purple) whereas a bullish breakout above the resistance trend line could indicate a wave C (purple). The invalidation level of the ABC (purple) zigzag is if price breaks below the bottom of wave A at 1.1530.
Canadian Dollar recovers as Trudeau said tension with Saudi just diplomatic difference of opinion
Selling pressure on Canadian appears to have eased after Canadian Prime Minister Justin Trudeau tried to tone down the tension with Saudi Arabia. Trudeau referred to recent events as a matter of "diplomatic difference of opinion" only. And he emphasized that "we don't want to have poor relations with Saudi Arabia." Trudeau went further and hailed that Saudi Arabia is a "country that has great significance in the world, that is making progress in the area of human rights."
Nonetheless, Trudeau also stood firm on Canada's position. He noted that "Canadians have always expected our government to speak strongly, firmly, clearly and politely about the need to respect human rights at home and around the world. We will continue to do that, we will continue to stand up for Canadian values and indeed for universal values and human rights at any occasion,"
The tension started last Friday when Canada expressed concerns over arrests of women rights activist in Saudi Arabia. The latter responded to the criticism by freezing new trade with Canada and expelled Canadian ambassador. It's reported yesterday by the Financial Times that Saudi central bank and state pensions ordered their overseas asset managers to sell their Canadian assets, including equities, bonds and cash holdings "no matter the cost". Saudi Arabia's foreign minister also said there is "nothing to mediate" with Canada.
USD/CAD spiked higher to 1.3119 yesterday but it's now back pressing 1.3000.