

Sample Category Title
USD/JPY Awaiting Break Of S&R Trend Lines
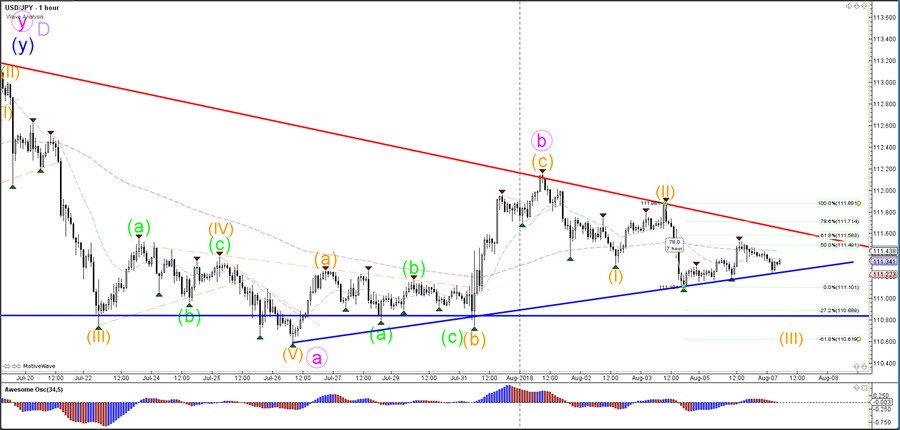
The USD/JPY is showing a consolidation pattern as price is respecting the support (blue) and resistance (red) trend lines. A bearish ABC zigzag seems the most likely pattern at the moment.
The USD/JPY bearish breakout could confirm the expected ABC (pink) within wave E (light purple). A bullish breakout could still be an expanded wave B (pink) unless price breaks above the previous top of wave D (purple).
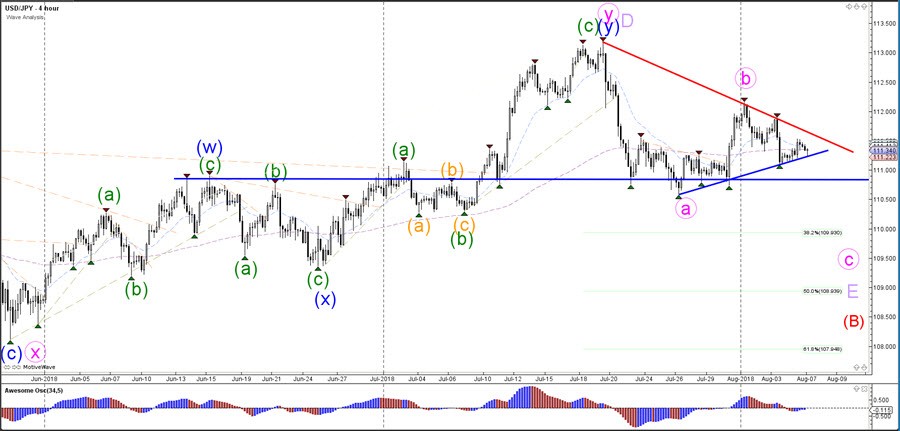
The USD/JPY is awaiting a breakout before a larger push up or down is possible.
USD/CHF Daily Outlook
Daily Pivots: (S1) 0.9935; (P) 0.9960; (R1) 0.9991; More...
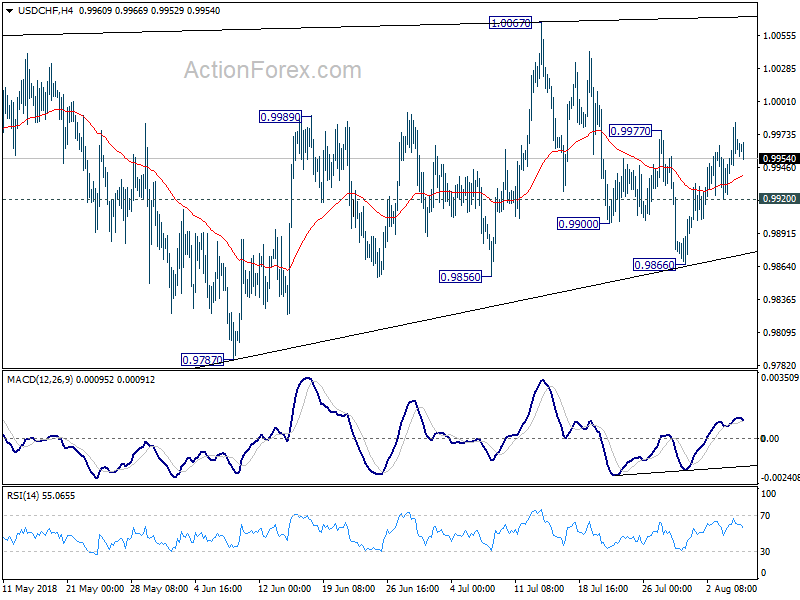
Intraday bias in USD/CHF remains mildly on the upside for the moment. Prior break of 0.9977 resistance suggests that pull back from 1.0067 has completed at 0.9866 already. Further rise would be seen back to retest 1.0067 high first. Decisive break there will resume larger rally from 0.9186. However, break of 0.9920 minor support will turn bias to the downside, to bring another decline to extend the consolidation pattern from 1.0056.
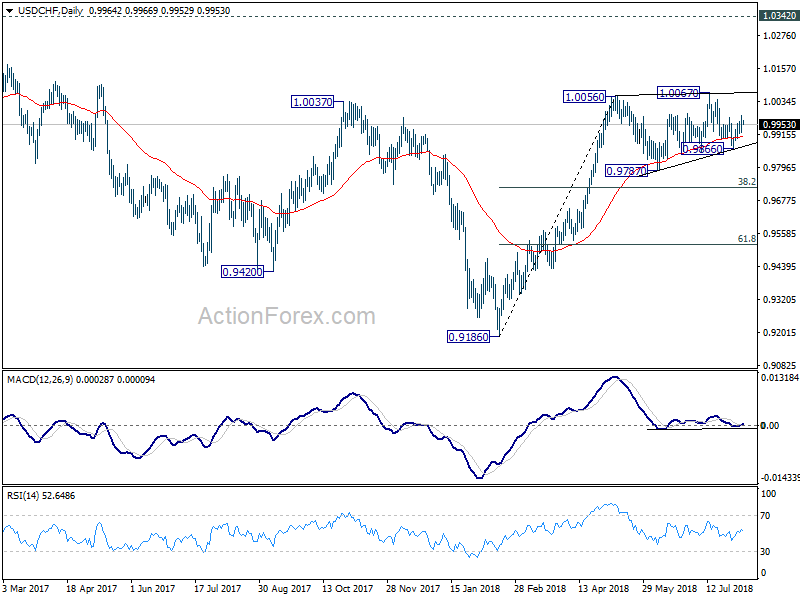
In the bigger picture, current development suggests that the consolidation pattern from 1.0056 is extending with another leg. As long as 38.2% retracement of 0.9186 to 1.0056 at 0.9724 holds, we'd expect rise from 0.9186 to resume at a later stage to retest 1.0342 key resistance (2016 high). However, sustained break of 0.9724 fibonacci level will bring deeper fall, as another declining leg in the long term range pattern.
Dow Futures (YM_F) Elliott Wave View: Reacting Higher From Blue box
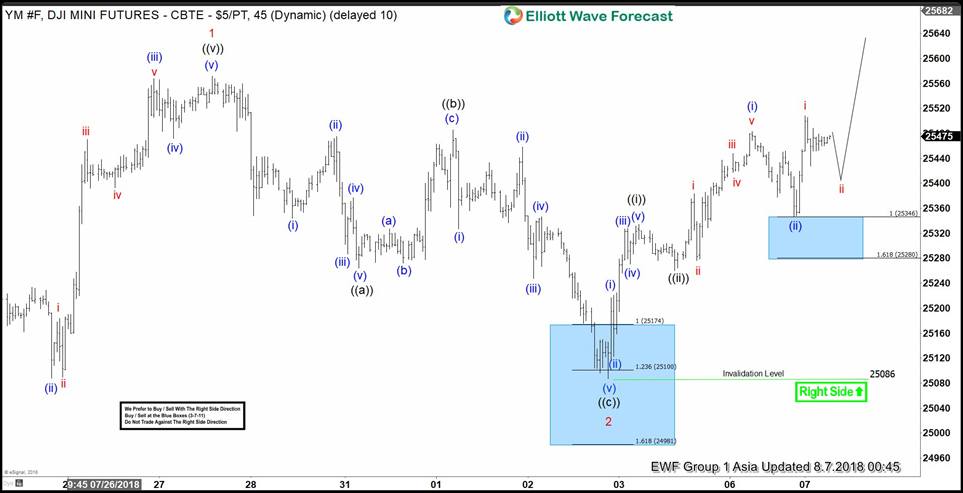
Dow Futures ticker symbol: YM_F short-term Elliott wave view suggests that the rally from 6/28/2018 low cycle to 25572 high on 7/27/2018 peak ended Minor wave 1. The internals of that rally higher took place as an impulse structure with sub-division of 5 waves structure in each leg higher. Down from there, the index corrected the 6/28/2018 cycle in 3 swings pullback & ended Minor wave 2 at 25086 low.
The internals of that pullback unfolded as Elliott wave Zigzag correction with the sub-division of 5-3-5 structure in Minute wave ((a)), ((b)), ((c)). Down from 7/27 peak, the decline to 25264 low ended Minute wave ((a)) in 5 waves structure. From there, the rally to 25486 high ended Minute wave ((b)) and the subsequent move lower to 25086 low ended Minute wave ((c)) of 2 in 5 waves structure. Minor wave 2 ended within the 25174 – 25100 area, which is 100%-123.6% Fibonacci extension of ((a))-((b)), as indicated by the blue box.
Up from 25086, the index is reacting higher in 3 swings so far and longs from blue box area should be risk-free (stop loss at break even) already. The right side tag, combined with the blue box, help to identify the right trading strategy. Near-term, as far as dips remain above 25086 low, the right side of the market remains to the upside. Expect the Index to resume the next extension higher in Minor wave 3, but a break above 25572 high remains to be seen for final confirmation and to avoid double correction lower in Minor wave 2 pullback. We don’t like selling it.
YM_F 1 Hour Elliott Wave Chart
USD/JPY Daily Outlook
Daily Pivots: (S1) 111.19; (P) 111.37; (R1) 111.60; More...
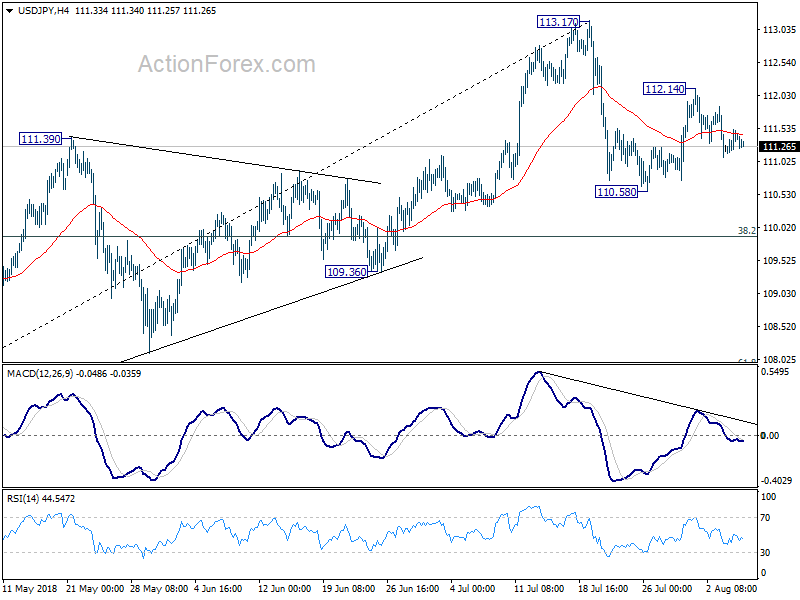
Intraday bias in USD/JPY remains neutral at this point and outlook is unchanged. Corrective fall from 113.17 could extend lower. But in case of deeper fall, we'd expect strong support from 38.2% retracement of 104.62 to 113.17 at 109.90 to bring rebound. On the upside, above 112.14 will target a test on 113.17 high.
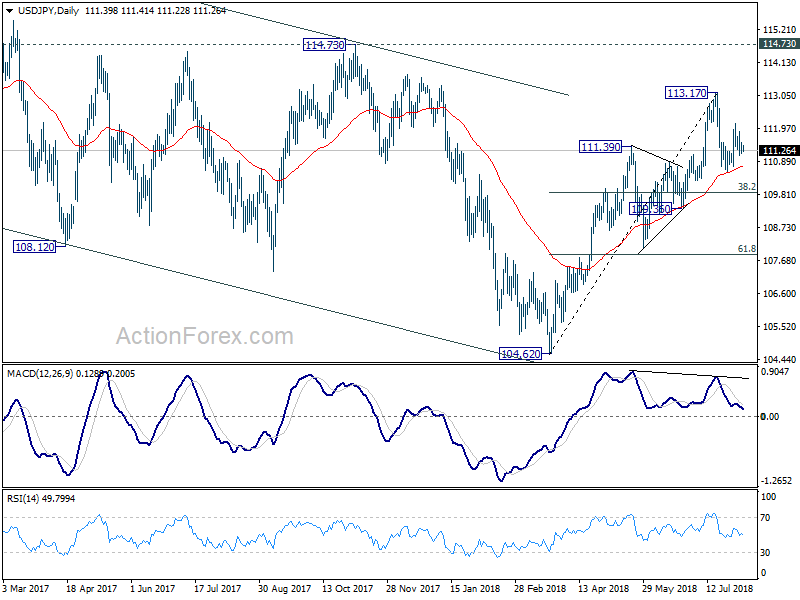
In the bigger picture, corrective fall from 118.65 (2016 high) should have completed with three waves down to 104.62. Decisive break of 114.73 resistance will likely resume whole rally from 98.97 (2016 low) to 100% projection of 98.97 to 118.65 from 104.62 at 124.30, which is reasonably close to 125.85 (2015 high). This will stay as the preferred case as long as 109.36 support holds.
USD/CAD Daily Outlook
Daily Pivots: (S1) 1.2980; (P) 1.3010; (R1) 1.3032; More...
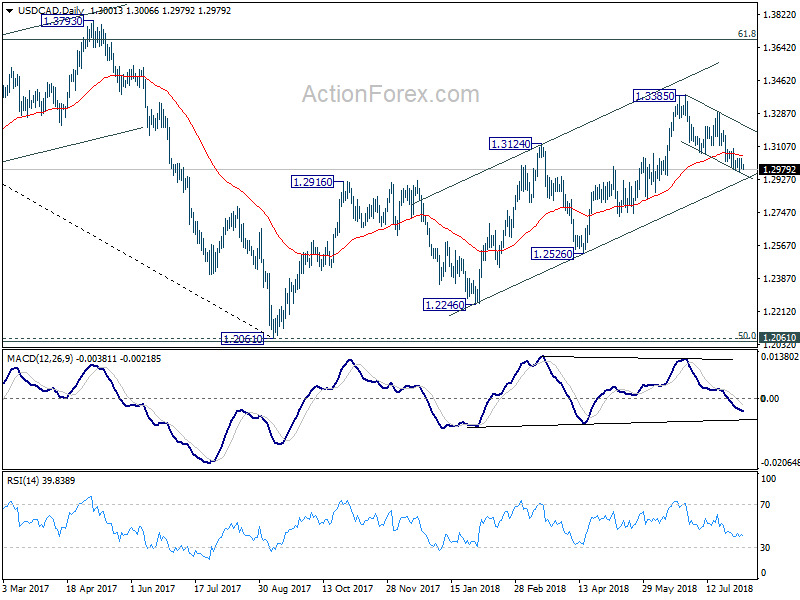
Intraday bias in USD/CAD is turned neutral with diminishing downside momentum as seen in 4 hour MACD. Further decline cannot be ruled out yet. But fall from 1.3385 is seen as a correction. We'd expect strong support from rising channel line (now at 1.2917) to contain downside to bring rebound. On the upside, above 1.3039 minor resistance will turn bias to the upside for 1.3063 support turned resistance first.
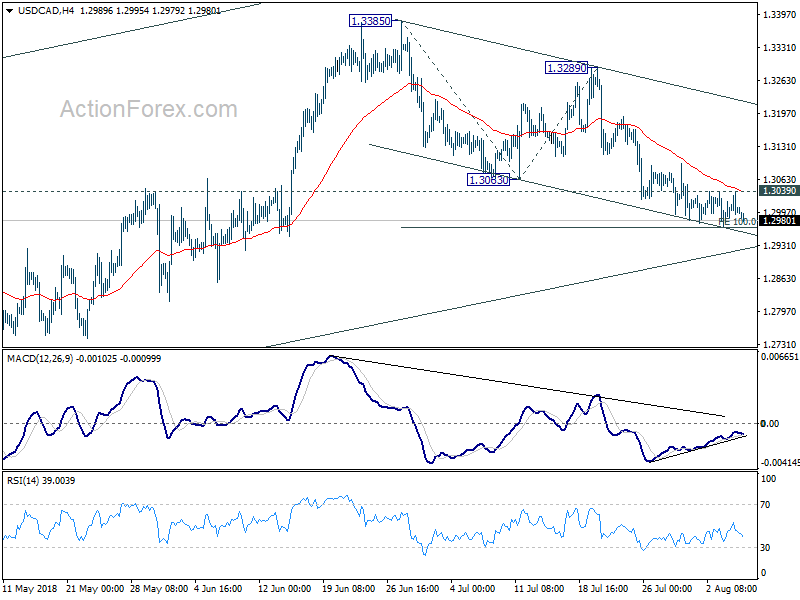
In the bigger picture, as long as channel support (now at 1.2917) holds, we're holding to the bullish view. That is, fall from 1.4689 (2015 high) has completed at 1.2061, ahead of 50% retracement of 0.9406 (2011 low) to 1.4689 (2015 high) at 1.2048. Further rally should be seen for 61.8% retracement of 1.4689 to 1.2061 at 1.3685 and above. However, sustained break of the channel support will argue that rise from 1.2061 has completed and will bring deeper fall to 1.2526 support to confirm.
June Number For Industrial Production In Germany Will Gain Some Attention
Market movers today
It is another quiet day on the data front and hence focus in the market will continue to be on political developments, notably the trade frictions between the US and China, where the official stand-off was confirmed over the weekend after an op-ed in the Chinese State media that China will not back down in the trade war.
The Chinese trade balance number, due to be released overnight, will be followed with some interest in light of the trade frictions. Export growth will also be an important gauge of the strength of the global economy.
Today, the June number for industrial production in Germany will gain some attention, especially as some of the business confidence indicators have weakened recently on the back of global trade tensions. Market consensus is for a small decline in the growth rate y/y to 3%.
In Italy, statements from political leaders on the budget for 2019 will be interesting ahead of the finalisation of the budget in September and could influence market sentiment on Italy.
In the Scandies, industrial production data in Sweden and Norway is due out.
Selected market news
The S&P 500 ended yesterday's session at its highest level since the start of 2008. The positive sentiment was driven by financials and tech firms. Hence, the market is 'ignoring' the trade conflict between the US and China. 10Y Treasuries continue to trade below 3% while we are awaiting this week's auction of some USD78bn in the 3Y, 10Y and 30Y US treasury bonds.
We have seen a mixed picture in the Asian markets again this morning with Japanese and Chinese equities drifting higher, while Australian equities are drifting lower. The earnings season continues today.
Movements in the major currencies as well as 10Y JGBs have been modest this morning. 10Y JGBs are trading at a yield of 10bp.
German Factory Orders Declined At The Fastest Pace Since Early 2017 In June, While Euro-Zone’s Sentix Confidence Index Climbed...
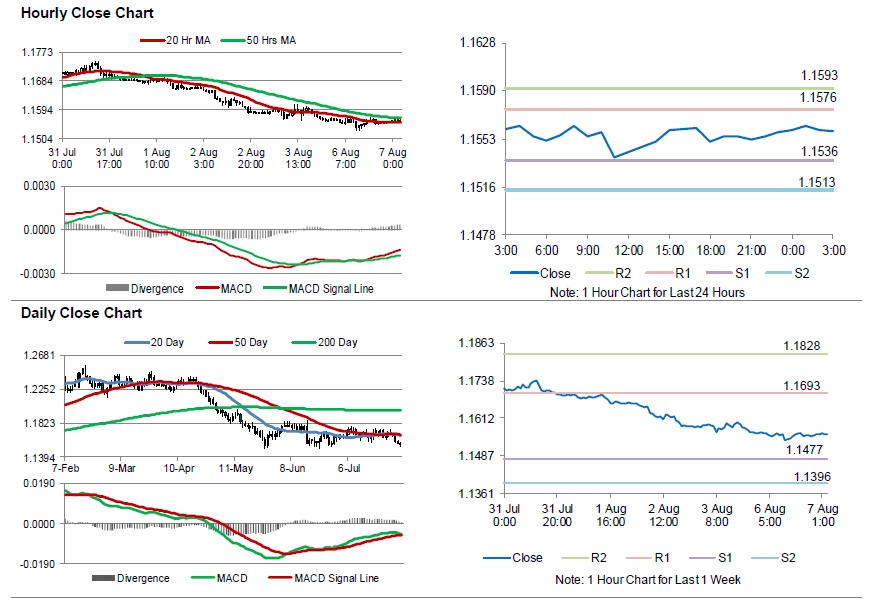
For the 24 hours to 23:00 GMT, the EUR declined 0.07% against the USD and closed at 1.1558, following disappointing German factory orders data.
Data showed that Germany's seasonally adjusted factory orders retreated 4.0% on a monthly basis in June, registering its biggest fall since January 2017 and more than market expectations for a fall of 0.5%. In the previous month, factory orders had risen 2.6%.
On the contrary, in the Euro-zone, the Sentix investor confidence index jumped to a 3-month high level of 14.7 in August, amid easing concerns over EU-US trade war. The index had registered a level of 12.1 in the prior month, while market participants had envisaged for a climb to 13.4.
In the Asian session, at GMT0300, the pair is trading at 1.1559, with the EUR trading a tad higher against the USD from yesterday's close.
The pair is expected to find support at 1.1536, and a fall through could take it to the next support level of 1.1513. The pair is expected to find its first resistance at 1.1576, and a rise through could take it to the next resistance level of 1.1593.
Looking forward, traders will closely monitor Germany's trade balance data and industrial production, both for June, set to release in a while. Later in the day, the US consumer credit data for June, will garner significant amount of investors' attention.
The currency pair is showing convergence with its 20 Hr and 50 Hr moving averages.
Pound Trading A Tad Lower In The Asian Session
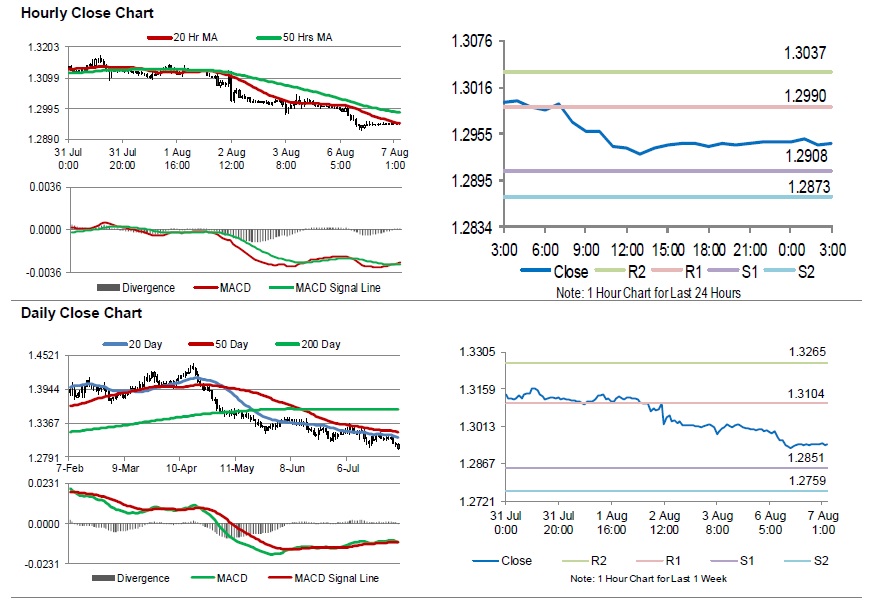
For the 24 hours to 23:00 GMT, the GBP declined 0.43% against the USD and closed at 1.2945.
In the Asian session, at GMT0300, the pair is trading at 1.2943, with the GBP trading slightly lower against the USD from yesterday’s close.
On the macro front, the BRC retail sales across all sectors advanced less-than-expected 0.5% on an annual basis in July, compared to an advance of 1.1% in the prior month.
The pair is expected to find support at 1.2908, and a fall through could take it to the next support level of 1.2873. The pair is expected to find its first resistance at 1.2990, and a rise through could take it to the next resistance level of 1.3037.
Going ahead, traders will look forward to the release of UK’s Halifax house prices data for July, set to release in a few hours.
The currency pair is showing convergence with its 20 Hr moving average and trading below its 50 Hr moving average.
Japanese Yen Trading A Tad Higher In The Asian Session
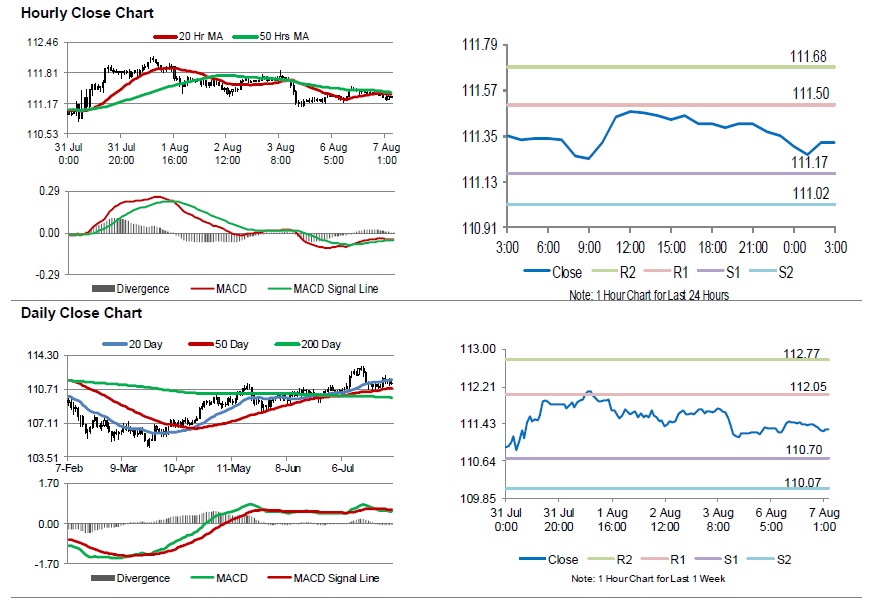
For the 24 hours to 23:00 GMT, the USD rose slightly against the JPY and closed at 111.35.
In the Asian session, at GMT0300, the pair is trading at 111.32, with the USD trading marginally lower against the JPY from yesterday’s close.
The pair is expected to find support at 111.17, and a fall through could take it to the next support level of 111.02. The pair is expected to find its first resistance at 111.50, and a rise through could take it to the next resistance level of 111.68.
Moving ahead, investors will keep an eye on Japan’s leading index and coincident index for June, scheduled to release in a while. Also, Japan’s trade balance data for June, set to release overnight, will keep traders on their toes.
The currency pair is trading below its 20 Hr and 50 Hr moving averages.
Swiss Franc Trading Flat In The Morning Session
For the 24 hours to 23:00 GMT, the USD rose 0.18% against the CHF and closed at 0.9963.
Macroeconomic data indicated that, Switzerland’s total sight deposits eased to a level of CHF575.9 billion in the week ended 03 August, from CHF576.4 billion in the previous week.
In the Asian session, at GMT0300, the pair is trading at 0.9963, with the USD trading flat against the CHF from yesterday’s close.
The pair is expected to find support at 0.9943, and a fall through could take it to the next support level of 0.9923. The pair is expected to find its first resistance at 0.9984, and a rise through could take it to the next resistance level of 1.0005.
With no macroeconomic releases in Switzerland today, investors would look forward to global macroeconomic releases for further direction.
The currency pair is showing convergence with its 20 Hr moving average and trading above its 50 Hr moving average.
