Sample Category Title
Japan real wages grew at fastest pace since 1997
Japan nominal labor cash earnings rose strongly by 3.6% yoy in June versus expectation of 1.7% yoy. Real wages grew 2.8% yoy, the fastest pace in 21 years since January 1997. Looking at the details, regular pay grew 1.5% yoy. One-off payment including bonuses jumped an impressive 7.0% yoy. Overtime pay also rose 3.5% yoy, a notable acceleration of 2.0% yoy in May. The set of data should be welcomed by BoJ. Nonetheless, persistent strength is needed to eventually change the "social mode" of deflation mind set, which suppresses inflation pressures. Also from Japan, overall household spending dropped -1.2% yoy in June, matched expectations.
Elsewhere, UK BRC retail sales monitor rose 0.5% yoy in July, below expectation of 1.3% yoy. Australia AiG performance of construction index rose to 52.0 in July, up from 50.6.
US treasury yields extended decline overnight
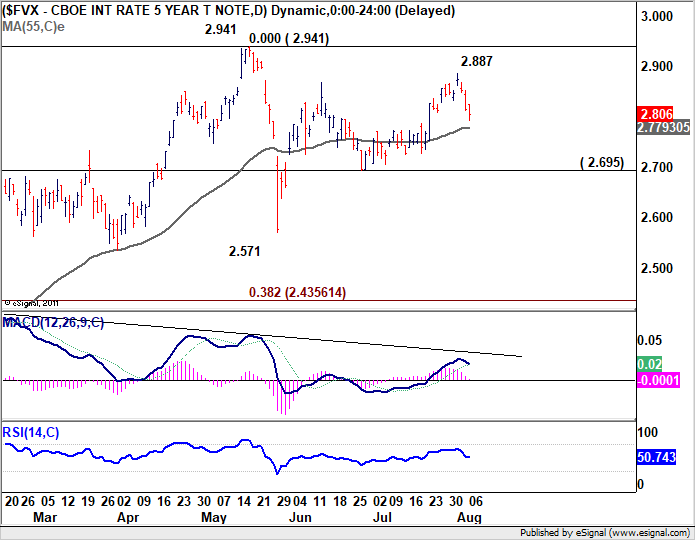
US treasury yield suffered another day of decline overnight. Five year yield closed down -0.010 at 2.806. 10 year yield also lost -0.015 to 2.938. The technical development affirmed our bearish view that FVX's rebound from 2.571 has completed at 2.887. Immediate focus in on 55 day EMA at 2.779. Break there will bring deeper fall to 2.695 support next. Firm break there will confirm there the corrective pattern from 2.941 has started the third leg targeting 2.571 and below. Such development could limit Dollar's strengthen.
Market Morning Briefing: Euro Moved Lower Yesterday, Seeing A Low Of 1.1530
STOCKS
Dow (25502.18, +0.16%) has just broken above immediate resistance near 25500. If the current rise sustains above 25500, Dow could continue to move up towards 25750 in the medium term. Dax (12598.21, -0.14%) on the other hand has dipped below 12600 and could test 12400 before again bouncing back from there
Nikkei (22562.10, +0.24%) has dipped and is ready to test the lower level of the near term range of 22400-22800 as mentioned yesterday. A break below 22400 is needed to keep the bearish momentum intact. Else, a bounce from 22400 would keep the current narrow range active for some more time.
Shanghai (2731.11, +0.96%) is almost stable. As mentioned yesterday, scope of testing 2650 on the downside remains open with equal possibility of moving up towards 2800. The index is currently trading right in the middle of the 2650-2800 zone.
Nifty (11387.10, +0.23%) traded below 11400 yesterday. A test of 11500 still looks possible in the next 2-3 sessions before coming off sharply towards 11200.
COMMODITIES
Brent (73.98) is likely to trade in the narrow range of 72.50-74.00 this week while WTI (69.09) looks bullish above 68. WTI may target 70-71 in the medium term.
Gold (1217.90) is likely to remain stuck in the 1230-1200 region for a couple of weeks. Sideways range is likely to continue majorly this month. No major movement expected just now. A test of 1210 on the downside looks possible.
Copper (2.7350) is trading above 2.70 and while that holds, a bounce back to 2.80 is possible. However, we need to be careful because there are equal chances of falling towards 2.65, if a break below 2.70 is seen.
FOREX
Euro (1.1561): As per expectation, Euro moved lower yesterday, seeing a low of 1.1530. The previous low of 1.1508 and support near 1.145 on 3 day line chart are crucial levels which could produce a bounce. A break below these levels would make Euro bearish towards lower support near 1.135-1.130 on weekly line chart.
Dollar Index (95.314): Dollar Index saw a high near 95.52 yesterday and could move higher towards resistance on daily line chart near 96.0-96.2 by next week. Having breached the 95 level last week, the weekly line chart suggests it could remain bullish in the near to medium term atleast.
Dollar Yen (111.32): Dollar Yen continues to move quietly just above support near 111 on daily candles. While above 111, an uptrend towards resistance near 113-114 is possible in the next 1-2 weeks.
Euro Yen (128.69): As mentioned yesterday, Euro Yen looks bearish towards support near 127.5 on daily line chart and could test it in 1 week’s time. EURUSD’s downmove towards 1.145 could help Euro Yen test 127.5. The crucial horizontal support near 127 on weekly line chart would have to break for Euro Yen to turn bearish below 127 in the medium term.
Pound (1.2944): As per expectation, Pound moved lower yesterday, seeing a low near 1.294. As mentioned yesterday as well, it could attempt a test of support on daily candles near 1.290-1.288 in the next 1-2 sessions.
Dollar Rupee (68.885): Dollar Rupee is likely to limit its upside at 68.90 from where a fall back towards 68.50 is possible this week.
INTEREST RATES
After having tested the 3% resistance last week, the US 10 year bond yield has again come off from there. If it moves below 2.9% again, there is crucial support near 2.82-85%, which it was not able to break below in Jun-Jul ’18.
This week is also supposed to see auctions of $26 bn of 10 year notes and $18 bn of 30 year notes by the US Treasury. Whether a greater supply of bonds reduces bond price and thereby raises yields will have to be seen.
The trade war rhetoric has again got impetus lately after China also threatened to impose $60 bn worth of retaliatory tariffs on USA. Some more of this rhetoric could lead to a ‘risk off’ sentiment amongst investors, taking the 10 year yield towards 2.8%.
US 10 year yield (2.94%), 30 Year (3.09%), 5 Year (2.81%), 2 Year (2.65%):
The Japanese 10 year yield (0.12%) continues to stay in the 0.11%-0.13% zone. A breach above 0.13% would open up levels near 0.20%. A test of 0.09% on the downside before it moves back up beyond 0.13% is possible in this week.
The German 10 year bond yield (0.39%) seems to be coming off from resistance on medium term chart near 0.4% . A downmove towards 0.3% could now be seen in the coming sessions.
GBP/USD Sets New Yearly Low, Settles Below 1.3000
Key Highlights
- The British Pound declined heavily and traded to a new yearly low below 1.2940 against the US Dollar.
- There is a major bearish trend line in place with resistance at 1.3085 on the 4-hours chart of GBP/USD.
- The Euro Zone Sentix Investor Confidence Index increased from 12.1 to 14.7 in August 2018.
- Today, the US IBD/TIPP Economic Optimism Index for August 2018 will be released, which is forecasted to increase from 56.4 to 57.2 (MoM).
GBPUSD Technical Analysis
The British Pound failed to move past the 1.3150 and 1.3200 resistance levels against the US Dollar. As a result, the GBP/USD pair declined heavily and broke the 1.3000 and 1.2980 support levels.
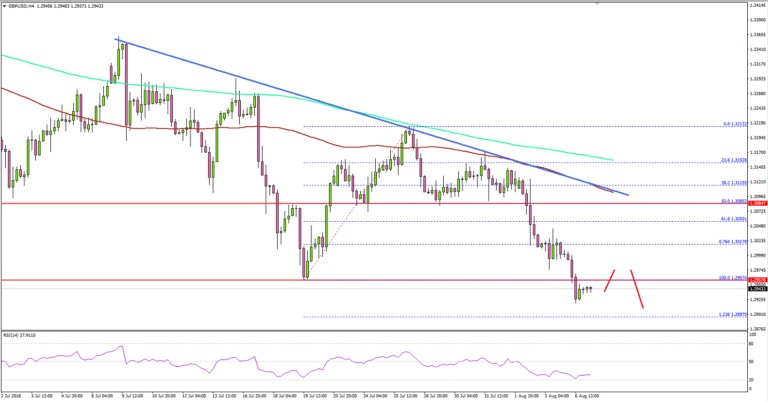
Looking at the 4-hours chart, the pair even broke the last swing low at 1.2957 and traded to a new yearly low. The next stop for sellers could be the 1.236 Fib extension level of the last wave from the 1.2957 low to 1.3213 high 1.2897.
Below 1.2897 and 1.2895, the pair could decline further towards the 1.2850 and 1.2800 support levels. On the upside, an initial resistance awaits near the 1.3000 level.
More importantly, there is a major bearish trend line in place with resistance at 1.3085 on the same chart. The trend line and the 1.3080 resistance are close to the 100 simple moving average (red, 4-hours).
Therefore, any major recoveries above 1.3000 are likely to face a lot of selling interest near 1.3080-85. Overall, the past few sessions were super bullish for the US Dollar as EUR/USD also fell sharply and tested the 1.1520 support area.
Moreover, dips in USD/JPY remained well bid and the pair may perhaps break the 111.80 and 112.00 resistances in the coming days.
Economic Releases to Watch Today
- Germany’s Industrial Production for June 2018 (MoM) – Forecast -0.5%, versus +2.6% previous.
- Germany’s Trade Balance for June 2018 – Forecast €20.1B, versus €20.3B previous.
- Germany’s Imports of goods and services June 2018 – Forecast +0.2%, versus +0.7% previous.
- Germany’s Exports of goods and services June 2018 – Forecast -0.4%, versus +1.8% previous.
- US IBD/TIPP Economic Optimism Index for August 2018 (MoM) – Forecast 57.2, versus 56.4 previous.
- Canada’s Ivey PMI July 2018 – Forecast 64.2, versus 63.1 previous.
Eco Data 8/7/18
[php_everywhere instance="1"]
Pivot Points: Are They a Worthy Addition to Your Toolbox?
For one to say that support and resistance (S/R) is important would be a huge understatement. It’s absolutely crucial!
We would even go as far to say that without sound knowledge of S/R, your odds of success (particularly for technical traders) are significantly diminished.
The good news is that S/R comes in all shapes and sizes, with some even calculated for you. Much like psychological numbers, Pivot Point levels are, for the most part, objective.
Initially employed by pit traders on the floors of equity and futures exchanges, Pivot Point levels have, for most technicians, proven useful in the currency markets.
How Pivot Points are displayed
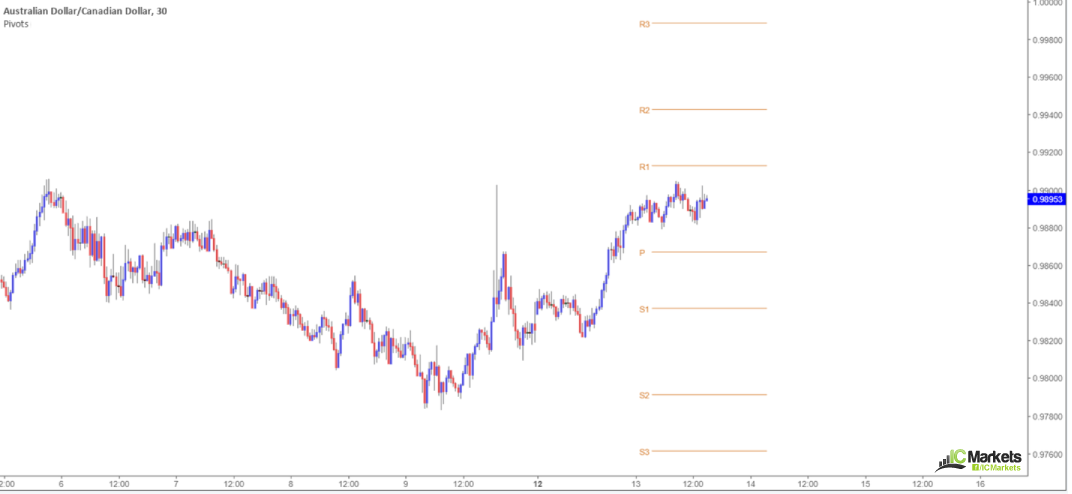
As you can see from the chart above, the arrangement consists of seven levels:
- The ‘P’ represents the Pivot Point.
- R1, 2 and 3 are corresponding resistances.
- S1, 2 and 3 are corresponding supports.
Assembled in daily (as above), weekly, monthly and yearly format, Just about any type of trader can find use in this tool.
Different types of Pivot Points
Although generally most technicians tend to favour the standard/classic method of calculating Pivot Points (like the one depicted on the chart above) there are other calculation techniques sometimes employed, such as:
- Camarilla Pivot Points.
- Fibonacci Pivot points.
- Woodie Pivot Points.
- DeMark Pivot Points.
In order to calculate Standard, Camarilla and Fibonacci Pivot Points you must have the previous period's high, low and close prices. For Woodie Pivot Points you need to have the previous period's high and low prices, as well as the open price for the current period. And finally for DeMark Pivot points you’ll require the previous period's open, high, low and close prices.
Another essential point to consider is that closing times will affect calculations. As the currency market effectively has no open and closing times throughout the week, one must select a session close. Typically, traders tend to hone in on the London midnight closing price or the 17.00pm New York close.
There are additional calculations required in order to generate the corresponding support and resistances. Luckily though, most platforms will calculate the whole process for you so you can focus on what’s important: trading the markets.
Using Pivot Points
Like most technical tools, relying exclusively on one metric to base a trading decision on is not likely the best path to take. However, when price converges at a point in which multiple technical tools come together, this is where the high-probability trading setups are found i.e. points of confluence.
Points of confluence are, from a technical standpoint, the Holy Grail. There’s not really much that compares!
Below is an example of such confluence at work:
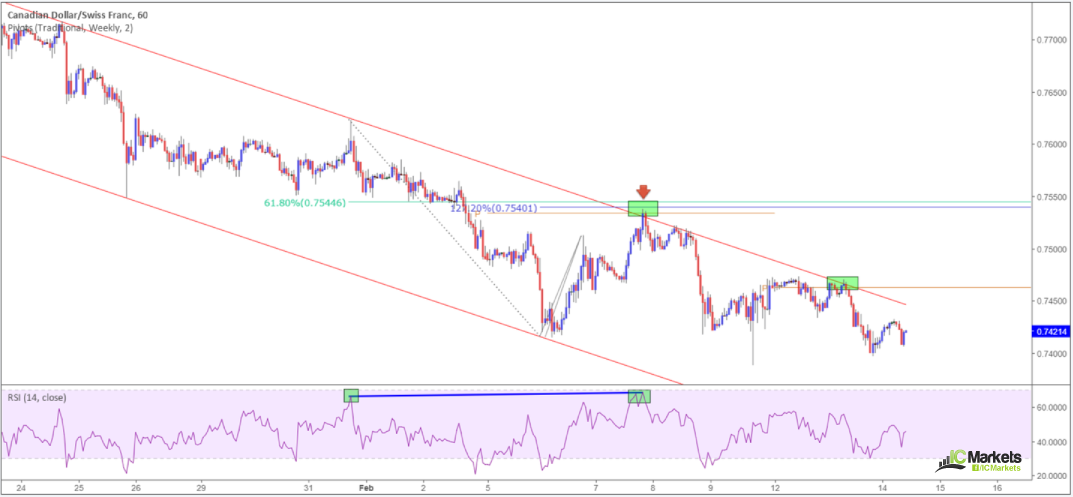
This is quite a detailed setup, and therefore will likely be a good example for beginners to learn from. Notice we have the following tools merging around the 0.7540ish area for a short (upper green box):
- H1 descending channel resistance.
- A H1 61.8% Fib resistance at 0.7544.
- A H1 127.2% Fib ext. point at 0.7540.
- A weekly Pivot Point (granted, for some traders the pivot (P) isn’t considered S/R, but rather a mid-point with which the corresponding S/R levels can be calculated).
- RSI nearing its overbought value and also showing divergence.
That’s five reasons here using the above example, to short the Canadian dollar, which, as you can see, takes into account that there’s a weekly Pivot Point present.
Pivot points are most certainly a worthy addition to one’s trading arsenal
Nevertheless, while Pivot Points are a notable tool, it should NEVER take precedence over market structure. What we mean by market structure is price action: supply and demand, support and resistance, trendlines, channels etc. Once you have a good feel for structure, you can then set about confirming the areas with additional tools, such as Pivot Points, Fibonacci studies, RSI movement etc.
A few take-away points:
- Pivot Points are horizontal support and resistance lines that are usually calculated directly on the platform’s chart.
- Pivot Points can be traded in the same way as traditional S/R levels.
- Pivot points, when combined with other tools, are high-probability points of reversal. Used alone, the odds of a reaction being seen are diminished.
- Each corresponding S/R is calculated from the main Pivot Point. Remember, though, this is done for you on the majority of platforms.
- Levels above the main Pivot Points are resistances, whereas levels below are supports.
If calculating manually, remain cognizant of market closing times.
Trading the Gartley harmonic pattern
The harmonic domain is a bizarre, yet intriguing, phenomenon for most traders.
While some dismiss the approach entirely, others are unable to trade without it.
Despite this separation, don’t let it discourage you from its teachings as it could prove to be a real game changer!
Harmonic patterns
Harmonic patterns are defined by specific price structures, operating on the premise that Fibonacci sequences can be used to build orderly structures. Together, these areas provide traders a base in which to initiate high-probability trades from.
And this is where the Gartley harmonic formation comes in…
The Gartley harmonic pattern
Roots of harmonic trading can be tracked down to the Gartley pattern, or sometimes referred to as ‘Gartley 222’. Introduced by H.M. Gartley in his book Profits in the Stock Market in 1932, the 5-point retracement structure is the oldest and most documented harmonic pattern. Larry Pesavento later applied Fibonacci ratios to the pattern in his book Fibonacci Ratios with Pattern Recognition.
It is suggested that the Gartley harmonic formation, on average, has a success ratio of about 70%. While this sounds absolutely fantastic, it is a tad presumptuous to state any success percentage without specifying money management rules, instruments traded, tested period, trading experience and applied confirmation methods. Therefore, conduct thorough research before risking your life savings!
Breaking it down
In the beginning, the Gartley harmonic pattern can be tricky to spot. It can also quickly get confusing when you overload the charts with Fibonacci measurements. The key to avoiding this is to take it one step at a time:
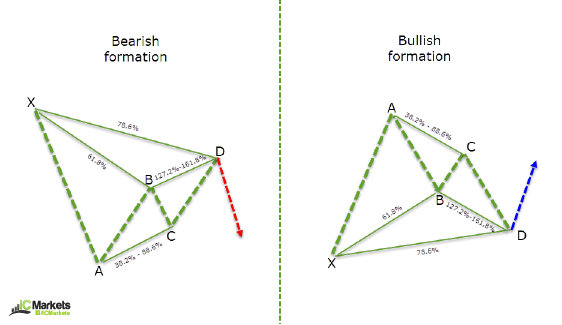
Step 1: Locate the impulse leg. This is a strong move in either direction. It can be a mixture of both bullish and bearish candles, but must still be a defined move. The beginning of the impulse move is labelled as X and the tip of the move as A.
Step 2: At this point, you’re looking for a retracement to occur: the B leg. Using your Fibonacci retracement tool, measure from the X leg to the A leg. The Fibonacci support you should be targeting is a 61.8% retracement value.
Step 3: Using your Fibonacci retracement tool again measure from the A leg to the B leg. The termination point here is somewhat flexible. As long as price concludes movement between 38.2%-88.6% you’re good to go. This is your C leg.
Step 4: Here you’ll look for the final leg to form: the D leg. This is where you will be looking to formulate your potential reversal zone (PRZ). Ideally, you should be targeting a symmetrically sized AB=CD completion that converges with a 127.2% Fibonacci extension point (measured from the A leg to the B leg and then back to the A leg), and a 78.6% Fibonacci retracement measured from the X leg to the A leg.
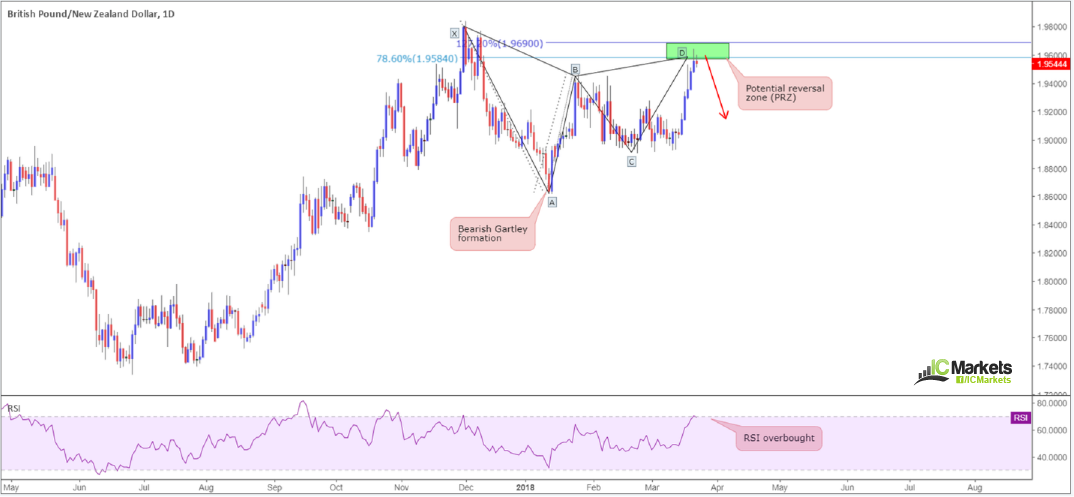
Here is a bearish Gartley harmonic pattern currently in play on the weekly chart of the GBP/NZD:
Trade management
Stop placement: 2-5 pips beyond the 161.8% Fibonacci extension of the A/B leg measurement. Some, however, prefer to use structure if this value poses too big of a stop distance. In the case of the setup posted above, stops placed above the X point of the Gartley formation would suffice, in our view.
Take-profit target 1: 38.2% Fibonacci retracement of legs A-D. When this level has been hit, you are encouraged to reduce risk to breakeven.
Take-profit target 2: 61.8% Fibonacci retracement of legs A-D. When this level has been hit, you are encouraged to take partial profits and trail stops using market structure (support and resistance).
One final point
While some solely trade this pattern in isolation, we feel they perform best when combined with additional tools.
Should the pattern’s PRZ converge with a notable trendline or support/resistance hurdle, for example, this will add weight to the trade moving in favour. Another essential point to consider is the trend direction. Trading this method against the trend is likely why many fail to achieve success using this formation.
An example of uniting other tools can be found on the GBP/NZD setup posted above where we utilized the RSI’s overbought reading along with the Gartley’s PRZ.
In closing
Do yourself a huge favour and start logging down historical setups. After the first ten you may begin seeing just how accurate these patterns truly are!
RBA Monetary Policy Meeting: More of the Same Story
On Tuesday the Reserve Bank of Australia is scheduled to announce its monetary policy decision at 0430 GMT and markets are almost certain that the central bank will maintain interest rates at record lows as it did over the past two years. A rate statement will accompany the decision as usually, with fears over a growing global trade war and debt risks in Australia probably being once again the main catalysts feeding the Bank’s accommodative strategy.
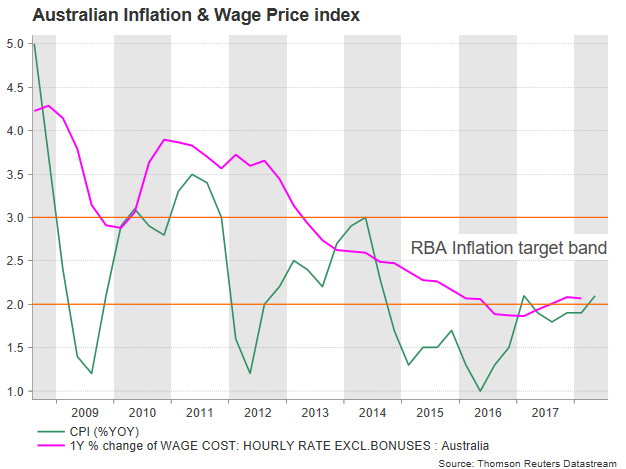
Headline inflation managed to just break into the RBA’s target range of 2-3.0% in the second quarter, coming in 0.2 percentage points higher at 2.1% year-on-year (y/y). While this seems to be good news for RBA policymakers, latest data out of the labour market showed that real wages stagnated as earnings and prices grew at the same pace of 2.1% y/y, a piece of evidence hinting that interest rates should not move higher yet at a time when consumers have no sufficient economic strength to meet their tremendous debt obligations. Therefore, policymakers could refrain from raising rates unless they see wages rising substantially above inflation.
Trade developments could be another source of uncertainty given the nonstop escalation in the US-Sino trade relations. Although Australia is one of the countries exempted from US import tariffs on steel and aluminum, US trade measures on those metals as well as on other potential products in target could indirectly affect the country’s welfare given that China is Australia’s top trade partner both in terms of exports and imports. Should US trade barriers squeeze China’s business activities and hence put breaks on the country’s economic growth, demand for Australian products could go downhill. Something not evident so far as last week’s figures published by the Australian Bureau of Statistics showed that goods exported to China including iron ore and manufactured items reached the second strongest growth in record.
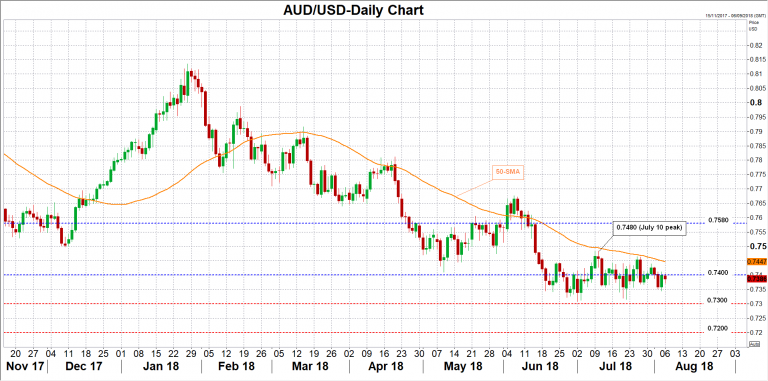
Turning to forex markets, aussie/dollar has been trading sideways around one-year lows since the end of June, with trade concerns, weak Australian wages and growing expectations of further monetary tightening by the Fed later this year making the pair less attractive to buy. Investors, who currently see no change in RBA’s monetary strategy until late 2019, could reduce their exposure on the aussie if the rate statement uses a stronger language to highlight risks arising from the US-Sino trade conflicts that could end up to a full-blown global trade war. In this case, the sell-off could drive aussie/dollar down to the 0.7300 key level where a floor has been created over the past two months. Steeper declines could also find support at the 0.7200 round level which could be of psychological significance.
Alternatively, if policymakers put more weight on local economic developments, cheering the signs of strength in the labour market and rising inflationary pressures, the aussie/dollar could move to the upside on speculation that despite growing trade risks, the Bank could feel more comfortable to raise rates if the data continues to impress. In this case, aussie could return back above 0.7400, with scope to break July’s 10 high of 0.7480. A stronger bullish move could also target the area around 0.7580 where the market stopped several times in May.
GBPUSD: Weakens, Resumes Its Broader Bearishness
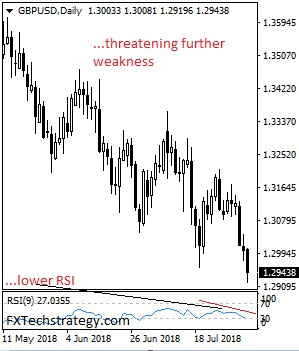
GBPUSD: The pair continues to retain its downside pressure leaving risk of more weakness on the cards in the days ahead. Support lies at the 1.2900 level where a break will turn attention to the 1.2850 level. Further down, support lies at the 1.2800 level. Below here will set the stage for more weakness towards the 1.2750 level. Conversely, resistance stands at the 1.3000 levels with a turn above here allowing more strength to build up towards the 1.3050 level. Further out, resistance resides at the 1.3100 level followed by the 1.3150 level. On the whole, GBPUSD remains biased to the downside medium term.
RBA to stand pat, a look at AUD/NZD, AUD/CAD and AUD/JPY
RBA rate decision is a focus in the upcoming Asian session. It's generally expected to keep the overnight cash rate unchanged at 1.50%. There shouldn't be any chance of any surprise in the decision. Meanwhile, the accompanying statement will likely be rather unchanged from the prior one.
The more interesting event could indeed be the Monetary Policy Statement to be released on Friday. There RBA will published updated growth, inflation and unemployment forecasts. Also, the forecasts horizon will extend to December 2020, from June 2020.
Currently a full 25bps rate hike is not priced in until late 2019.
Let's have a look at some Australian Dollar crosses.
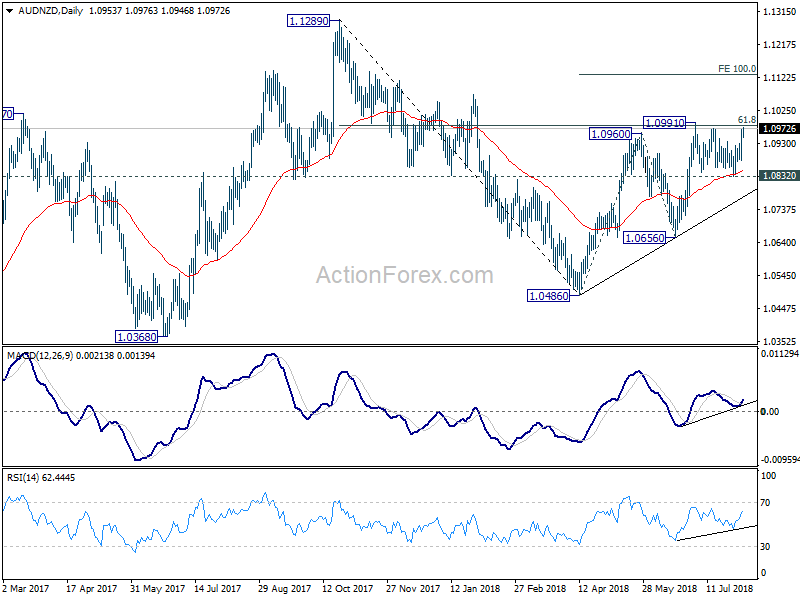
AUD/NZD is clearly in consolidation since 1.0991. Support was seen from the slightly rising 55 day EMA. Daily MACD an RSI also suggest building up of upside momentum. The current development favors an eventual upside break out. Fundamentally, it's also consistent with the respective central bank's stance. RBA maintains a tightening bias. RBNZ is neutral and the next both can be up or down.
Given that RBNZ will also meet this week, the immediate focus is on 1.0991 resistance for the next few days. Decisive break of 1.0991 will resume whole rise from 1.0486 and target 100% projection of 1.0486 to 1.0960 from 1.0656 at 1.1130. And in any case, near term outlook will remain bullish as long as 1.0832 support holds.
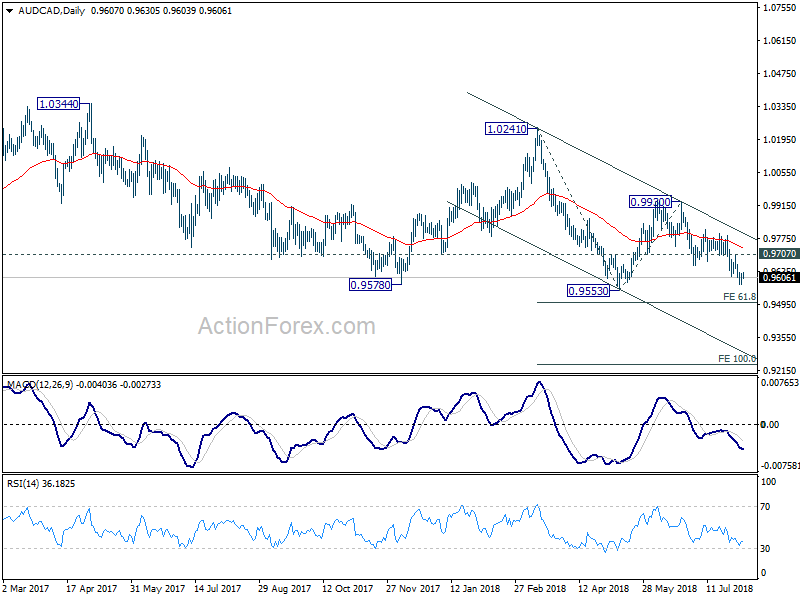
On the other hand, AUD/CAD has been in clear down trend. It's primarily due to expectation that BoC is possibly on track for another rate hike in October. This week's focus will be on 0.9553 low. Break there will extend the fall from 1.0241 to 61.8% projection 1.0241 to 0.9553 from 0.9930 at 0.9505 and then 100% projection at 0.9242 in medium term. ON the upside, though, above 0.9707 resistance will extend the consolidation pattern from 0.9553 with another rebound first.
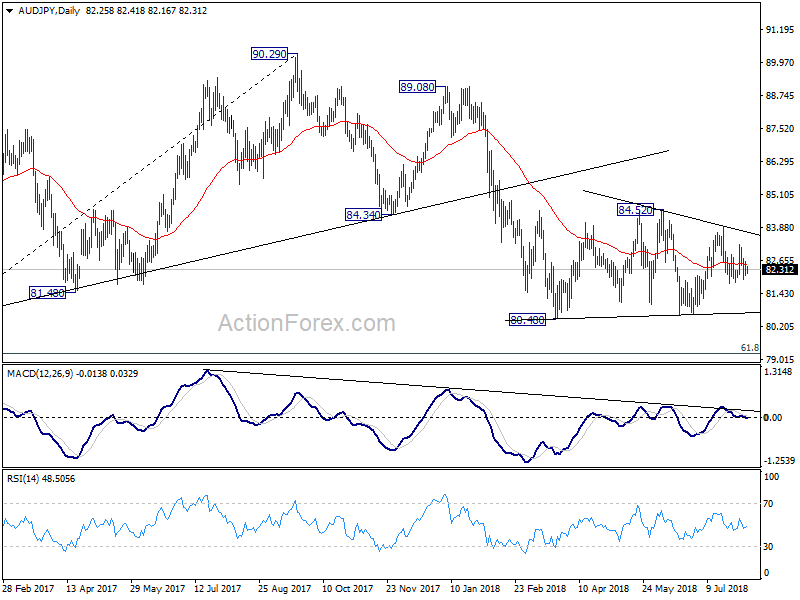
AUD/JPY is trading near to the mid-point of converging range from 80.48. There is no clear sign of a breakout yet. But outlook will stay bearish as long as 84.52 resistance holds. The downside from 90.29 is expected to resume eventually with a downside breakout. And break of 80.48 will target 61.8% retracement of 72.39 (2016 low) to 90.29 (2017 high) at 79.22.