

Sample Category Title
Forex Technical Analysis: EUR/USD, USD/JPY, GBP/USD
EUR/USD
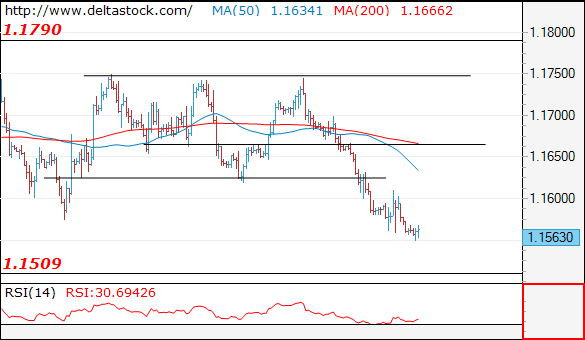
Current level - 1.1563
The intraday outlook remains bearish, for a test of 1.1509 low. A violation of the latter will clear the way for a dip to 1.1300 area. Crucial on the upside is 1.1610 high.
| Resistance | Support | ||
| intraday | intraweek | intraday | intraweek |
| 1.1610 | 1.1750 | 1.1510 | 1.1510 |
| 1.1750 | 1.1830 | 1.1510 | 1.1300 |
USD/JPY
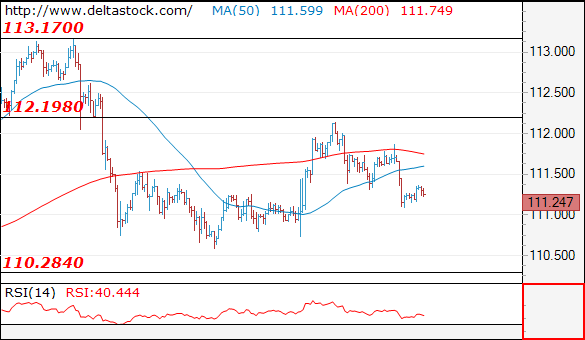
Current level - 111.24
The slide though 111.25 static support shows a bearish bias, for a continuation towards 110.25 zone. Crucial on the upside is 111.90.
| Resistance | Support | ||
| intraday | intraweek | intraday | intraweek |
| 111.80 | 114.50 | 110.25 | 110.25 |
| 113.20 | 114.50 | 110.25 | 109.30 |
GBP/USD
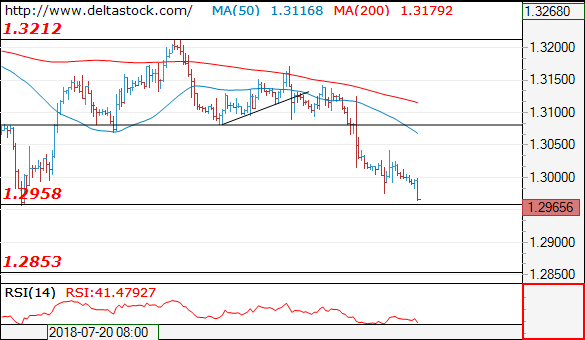
Current level - 1.2965
I favor a break through 1.2960 to trigger a sell-ff towards 1.2850 zone. Crucial on the upside is 1.3040 peak.
| Resistance | Support | ||
| intraday | intraweek | intraday | intraweek |
| 1.3040 | 1.3210 | 1.2960 | 1.2960 |
| 1.3080 | 1.3460 | 1.2840 | 1.2770 |
EUR/USD Extends Losses
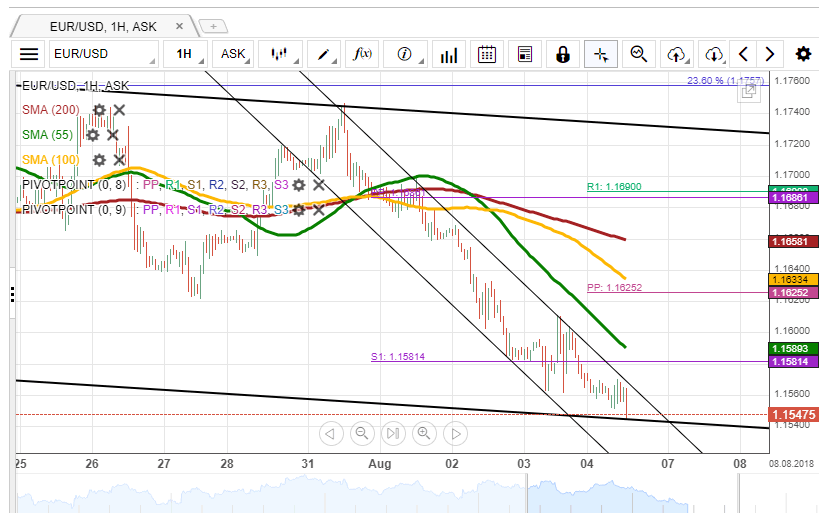
Downside risks continue to prevail with the EUR/USD exchange rate, thus pushing it lower for the third consecutive session. This short-term depreciation has sent the Euro to a new one-month low at 1.1560. This mark is likewise close to a one-year low located near 1.15.
Friday's trading session shows that this weekly decline is starting to allay. This means that a recovery is expected either today or tomorrow. The Euro has to overcome the strong resistance of the 55-hour SMA near 1.16 to fully accelerate against the US Dollar. In this case upside potential is apparent until the weekly R1 at 1.17.
Given that this session is calm in terms of fundamental data releases, the pair may lack the necessary upside momentum to breach the given moving average. Thus, it could fluctuate in the 1.1510/1.1600 range today.
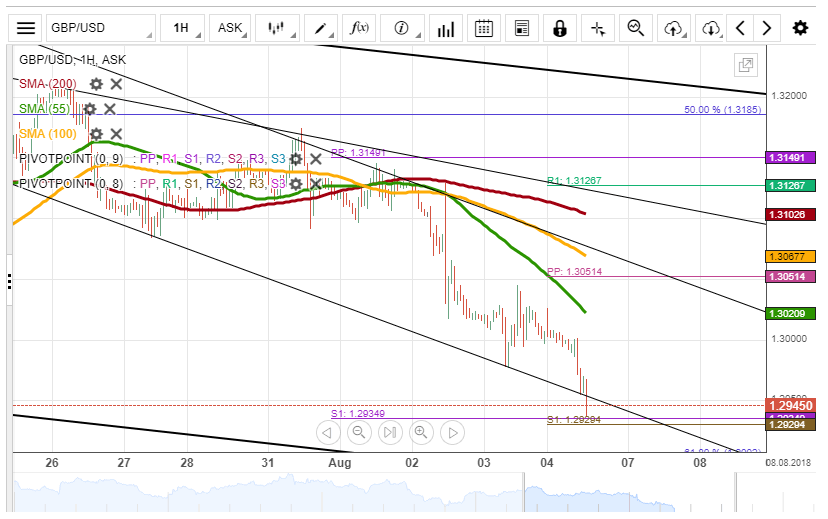
GBP/USD Remains Near 1.30
It is apparent on the chart that bears who were guiding GBP/USD on Thursday have lost some of their positions, thus leaving the rate rather stable during the last week's final trading session. A fresh channel down was drawn to show the rate's movement during the previous week. Its bottom boundary was tested on Friday.
Technical indicators on the hourly time-frame are starting to recover even though the price has not still picked up this trend. In general, it seems that the Pound may still be pushed lower in this session, pressured from above by the 55-hour SMA and the weekly PP. The nearest resistance that should stop significant losses is the weekly and monthly S1s at 1.2930.
This day is likely to be calm with no significant volatility, as no major data releases are scheduled for today.
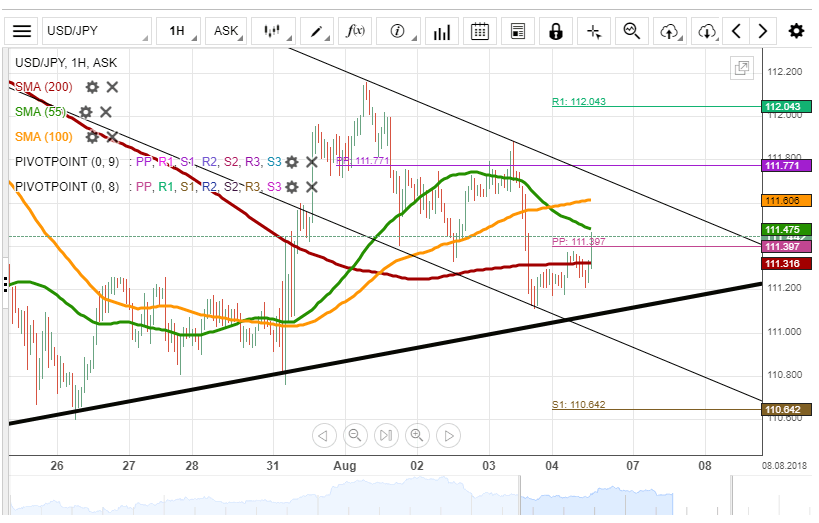
USD/JPY Finds Support At 200-Period SMA
USD/JPY extended losses on Friday, driven by rather strong bearish momentum mid-session. It pushed the rate past the 55-, 100– and 200-hour SMAs down to the senior channel near 111.00.
This line is supported by the 200-period SMA on the 4H chart. Thus, it is likely that the given cluster allows the rate to accelerate and aim for the upper boundary of a junior channel circa 111.60 today. The 55– and 100-hour SMAs are also located there. A breakout from this level would pave the way for a test of 113.00 this week.
By and large, the pair is likely not to show big leaps today and consequently remain stranded in between the senior channel and the aforementioned hourly SMAs.
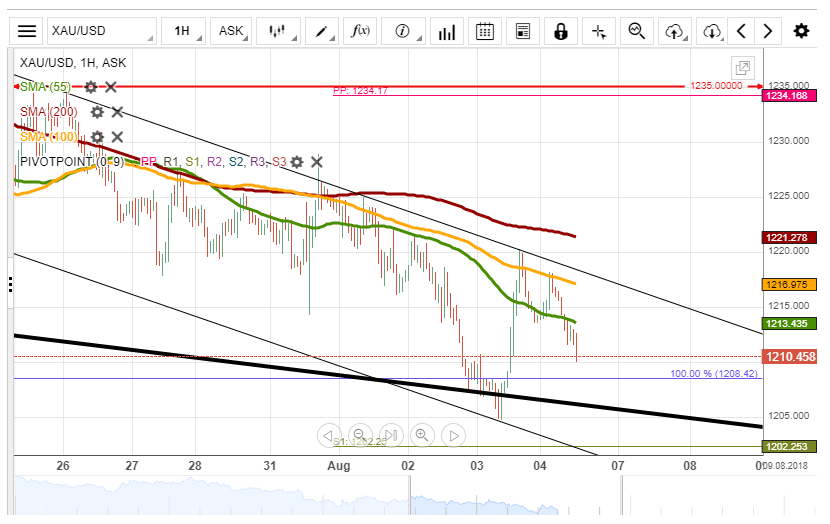
XAU/USD Stops At 1,220.00
Bears guided Gold to a new one-year low on Friday morning. The yellow metal managed to reverse its three-day decline mid-session and consequently gain 1.20% against the US Dollar. This advance was stopped by the 100-hour SMA and a channel line at 1,220.00.
It seems that bulls have not still gained the necessary strength to breach this resistance cluster, so it is more likely that the pair remains under the bearish pressure today. Today's low should be the senior line and the monthly S1 at 1,202.00. Technical indicators support this scenario.
Traders should look out for the 200-hour SMA at 1,222.00. If this line is breached, a surge up to the monthly PP is very likely.
USD Better Bid, PBoC In Motion
Stay long USD
USD continued to dominate the FX markets. The greenback has been benefit from aggravated stress points in other currencies. Whether is trade tensions, sanctions, Brexit concerns, European politics, exposure to oil prices or interest rates etc, the USD look to be the safe haven of choice. Even within the US-China trade battle markets are biased towards a positive US outcome. While domestically, the US continues to provide investors reasons to be satisfied with the USD outlook. Fridays US labor report was solid with unemployment fell to 3.9% and wages growth rose 2.7%. US 10- year yields jumped towards 3% providing yields seekers a meaningful spread within the G10 (although sharp retracements was seen today). Elsewhere US data has reported as expected with embeds further economic accelerations. In addition, July manufacturing employment indicated no negative effect from the USA protectionist activities. While the Fed continued to reiterate its message of gradual rate increase there is a growing case for a more aggressive hiking cycle. Especially considering that sizable upwards adjustment in personal income should support higher consumption. Jamie Dimon JPMorgan Chase & Co CEO over the weekend suggested that US 10-year bond yields could reach 5%. We continues to remain optimistic on the short-term USD outlook as other G10 currencies struggle with idiosyncratic issues. Our most negative view is on the cable as Brexit outlook remains extremely clouded. It’s hard to image after last week’s Carney comments that the BoE would tighten aggressively with risk surrounding Brexit mounting.
PBoC introduces reserve requirement amid strong Yuan depreciation
Trade tensions are intensifying, as China takes retaliatory measures, announcing additional tariffs on USD 60 billion of US imports ranging from 5% – 20% following latest threats from US side to implement a 25% tariff on USD 200 billion Chinese imports. But despite further US trade balance deficit, Asian markets pay the costs, with Shenzhen and Shanghai Composites closing at -2.08% and -1.29% respectively, Shanghai CSI 300 given at -1.27% and South Korean Kosdaq decreasing by -0.94%. Additionally, the CNY depreciation rally seems far from finished.
Accordingly, in an attempt to stabilize the currency, the PboC introduced a new measure imposing a 20% reserve requirement ratio on CNY in the forward market. Similar measures were undertaken in 3Q 2015 when the yuan went under pressure, but the relief was short-lived, as selling pressures rekindled a few weeks later.
Therefore, despite continued trade tensions, it is expected that the USD/CNY depreciation will stabilize at some point. The PBoC will be taking the necessary actions to maintain the currency below psychological level at 7. Currently trading at 6.8455, USD/CNY is showing further strength for now. We would however expect the pair to weaken slightly in the short-term, heading along 6.8220.
Bye Bye TRY
The Turkish lira remains the primary FX casualty in this risk-off environment. We are not seeing blind, unbridled EM selling, but rather the select liquidation of currencies with reveal clear faults. Turkey with a heavy USD dominated debt load has failed to play by international investors rules and are now facing the devastating consequence. The Turkish lira dropped to its weakest level as the White House indicated the US would impose sanctions on two minister of the Turkish government who were involved with the false detention of Pastor Andrew Brunson. Turkish authorities indicated Mr. Brunson is being held on terrorism charges. The violent reaction to the economically immaterial sanctions indicates just how on-edge investors are. The Turkish stock markets is the world’s worst performer in local currency, bond yields have hit a record high and the lira has dropped around 25% against the greenback this year. Last weeks sanctions aggregated a situation were President Erdogan has suggested the removal of the central banks independence. Without policy control the CBT has been unable to address surging inflation. The CBT decision not to hike rates on July 24th ,despite market expectations, is evidence of the lack of freedom. The failure of correct governance in the eyes of investors has triggers the sustained rush to the exits.
The deadly combination of a puppet central bank and out of control inflation, sent USDTRY above 5 for the first time ever. Perhaps the lira’s only saving-grace was the July inflation came in slightly lower than expected at 15.85% verse 16.30% (yet still above Junes read). However, Erdogans meddling in the CBT policy setting has prevents the bank from taking critical action to slow accelerating prices. Ergdogan has sacrificed price stability by stopping the central banks from raising rates in order to stimulate economic growth. Incredibly, Turkish interest rates at 17.75% has been too low to halt the mass exodus (real rate a paltry 1.9%). Staggering interest rate rise considering Turkey started 2018 with one-week repo rate at just 8%.
Is the lira collapse over? In our view not likely. The CBT would have to raise rates right now (not at September meeting) with a substantial hike of 300-500bp. This would incentives investors but more importantly highlight the CBT control of policy setting. However, interest rates at 20% would all but kill the Turkish economy. Erdogan is unlikely to let that happen.
USDJPY Intraday Bearish Below 111.37 Level
The US dollar trades under pressure against the Japanese currency on Monday after the Chinese government imposed more trade tariffs on American agricultural goods. The USDJPY pair has a bearish intraday bias while trading below the 111.37 level. USDJPY sellers will need to break the 111.00 support level over the coming sessions or risk losing the current bearish trading momentum.
The USDJPY pair is intraday bearish while trading below the 111.37 level, key support is found at the 111.00 and 110.55 levels.
If the USDJPY pair trades above the 111.37 level, buyers will likely test towards the 112.05 and 112.80 resistance levels.
GBPUSD Drops To Fresh 2018 Trading Low
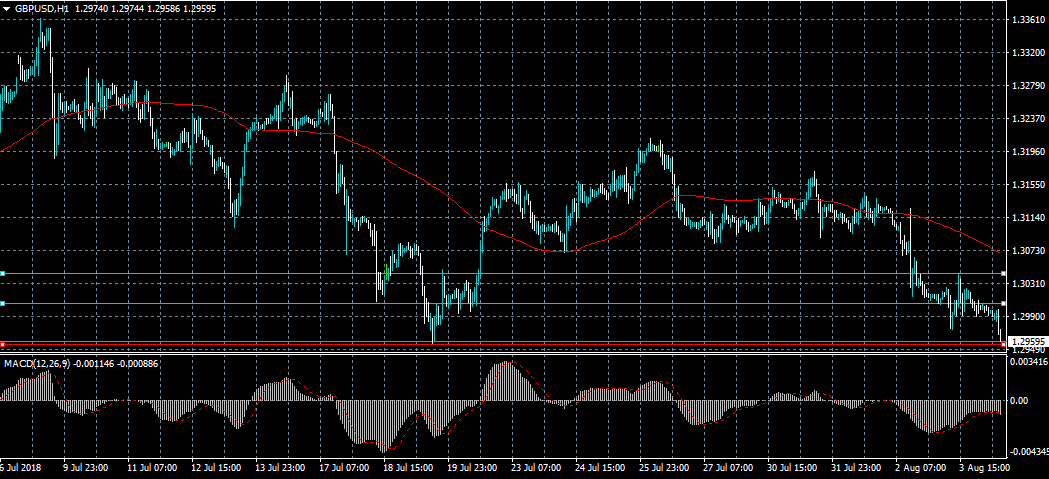
The British pound has dropped to a fresh 2018 trading-low against the US Dollar during the European trading sessions, as concerns over a Brexit no-deal for the United Kingdom grow. The GBPUSD pair risks falling below the 1.2900 level while price continues to trade below the 1.2957 technical level. Traders should also note the bearish head and shoulders pattern that has developed across the lower- time frames.
The GBPUSD pair is strongly bearish while trading below the 1.2957 level, key support is now found at the 1.2800 and 1.2840 levels.
If the GBPUSD pair moves above the 1.3000 level, buyers are likely to test towards the 1.3130 and 1.3170 resistance levels.
Gold Holds Above 17-Month Low, Could Weaken Further In Near Term
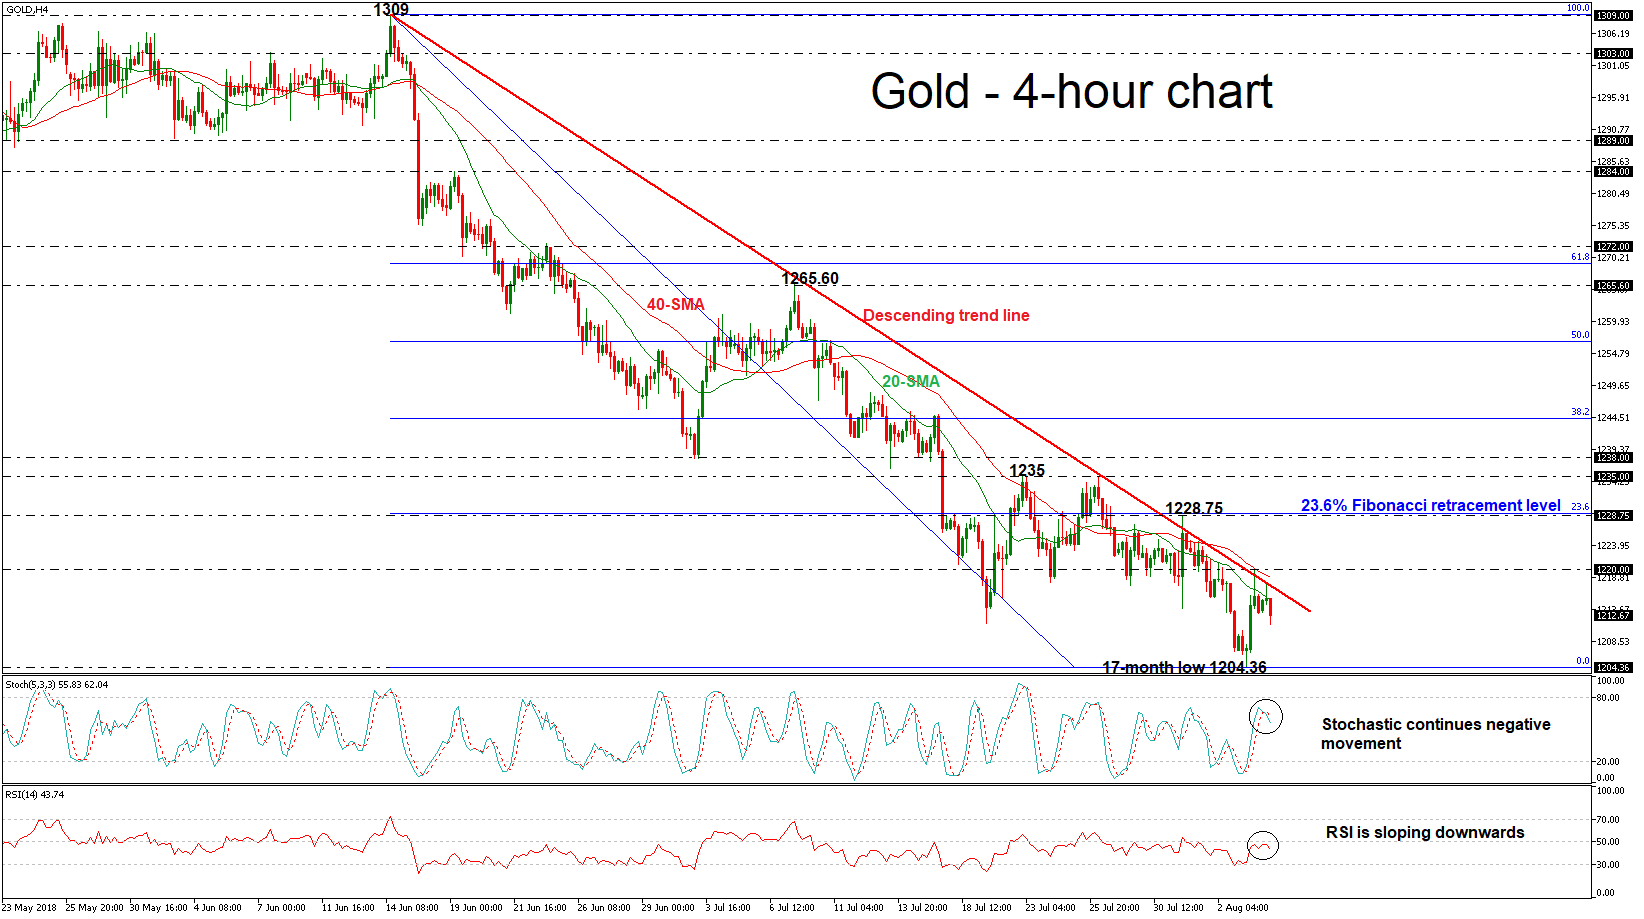
Gold posted a fresh 17-month low of 1204.36 last Friday, but now it is trading slightly higher from this bottom. The aggressive sell-off continues after the bounce off the short-term falling trend line and the 20- and 40-simple moving averages in the 4-hour chart.
From a technical point of view, the RSI is currently increasing negative momentum and is heading to the downside, while the %K line of the stochastic oscillator completed a bearish crossover with the %D line.
Should prices decline further, immediate support could be found around last week’s 17-month low (1204.36). In case of steeper losses, the precious metal could meet support around 1180.00, the lowest level reached since January 2017.
However, if the market manages to pick up speed, the 1220.00 hurdle could offer nearby resistance ahead of the 23.6% Fibonacci retracement level of the downleg from 1309.00 to 1204.36, around the 1228.75 key level. A significant close above the latter could drive the price until 1235.00, identified by the high on July 26.
In the medium-term, the outlook remains negative since prices hold below the moving average lines and the descending trend line.
The Analytical Overview Of The Main Currency Pairs
The EUR/USD currency pair
Technical indicators of the currency pair:
Prev Open: 1.15835
Open: 1.15699
% chg. over the last day: -0.15
Day's range: 1.15537 – 1.15657
52 wk range: 1.0571 – 1.2557
On Friday, there was a variety of trends on the EUR/USD currency pair. Ambiguous economic reports on the US labor market were published. At the moment, the EUR/USD currency pair is consolidating. Demand for the US dollar is still high. The key support and resistance levels are 1.15500 and 1.15750, respectively. We recommend opening positions from these marks.
Today, the publication of important news from the US and the Eurozone is not expected.
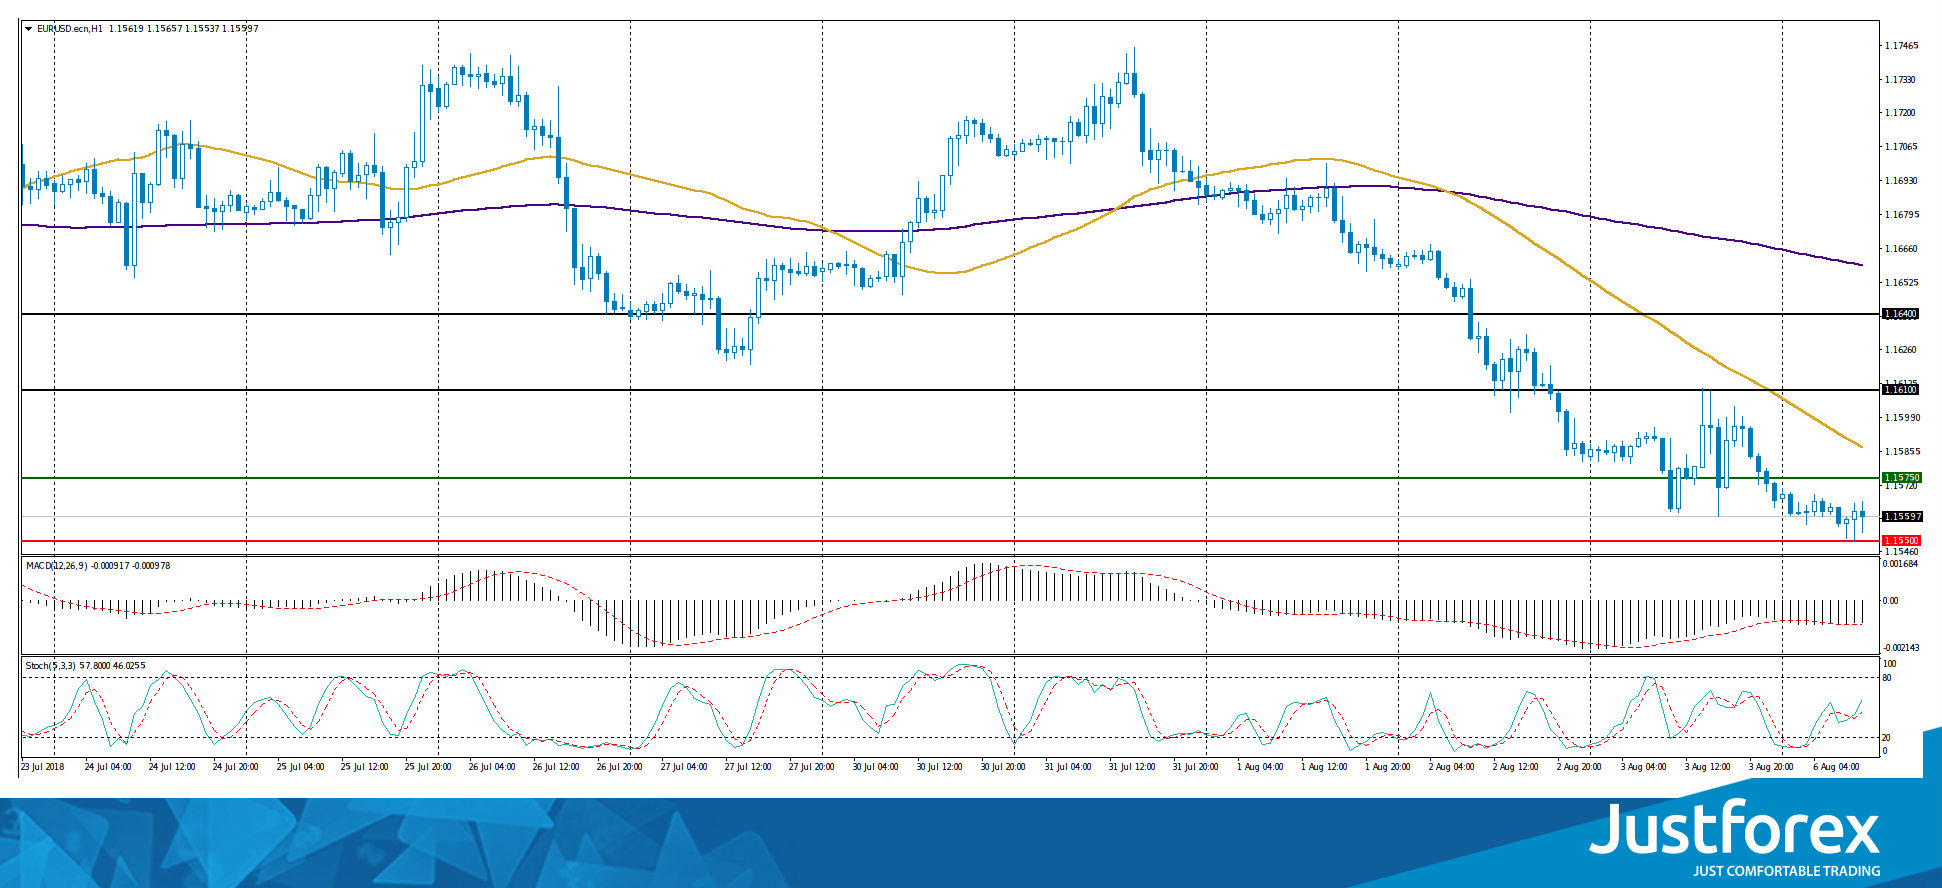
The price has fixed below 50 MA and 200 MA, which indicates the power of sellers.
The MACD histogram is located in the negative zone, but above the signal line, which gives a weak signal to sell EUR/USD.
Stochastic Oscillator is in the neutral zone, the %K is above the %D line, which indicates the bullish sentiment.
Trading recommendations
Support levels: 1.15500, 1.15000
Resistance levels: 1.15750, 1.16100, 1.16400
If the price fixes below the support level of 1.15500, the EUR/USD quotes are expected to fall. The movement is tending to 1.15100-1.14900.
Alternative option. If the price fixes above the resistance level of 1.15750, it is necessary to consider purchases of EUR/USD. The movement is tending to 1.16100-1.16400.
The GBP/USD currency pair
Technical indicators of the currency pair:
Prev Open: 1.30115
Open: 1.29952
% chg. over the last day: -0.05
Day's range: 1.29723 – 1.29996
52 wk range: 1.2361 – 1.4345
Last week, aggressive sales were observed on the GBP/USD currency pair. It should be recalled that the Bank of England raised the key interest rate by 25 basis points to 0.75%. At the same time, the regulator said that in the near future the issue of further tightening of the monetary policy would not be considered. The central bank is concerned about the consequences of Brexit. At the moment, the GBP/USD quotes are moving in the range of 1.29650-1.30000. The positions should be opened from these marks.
The news feed on the UK economy is calm.
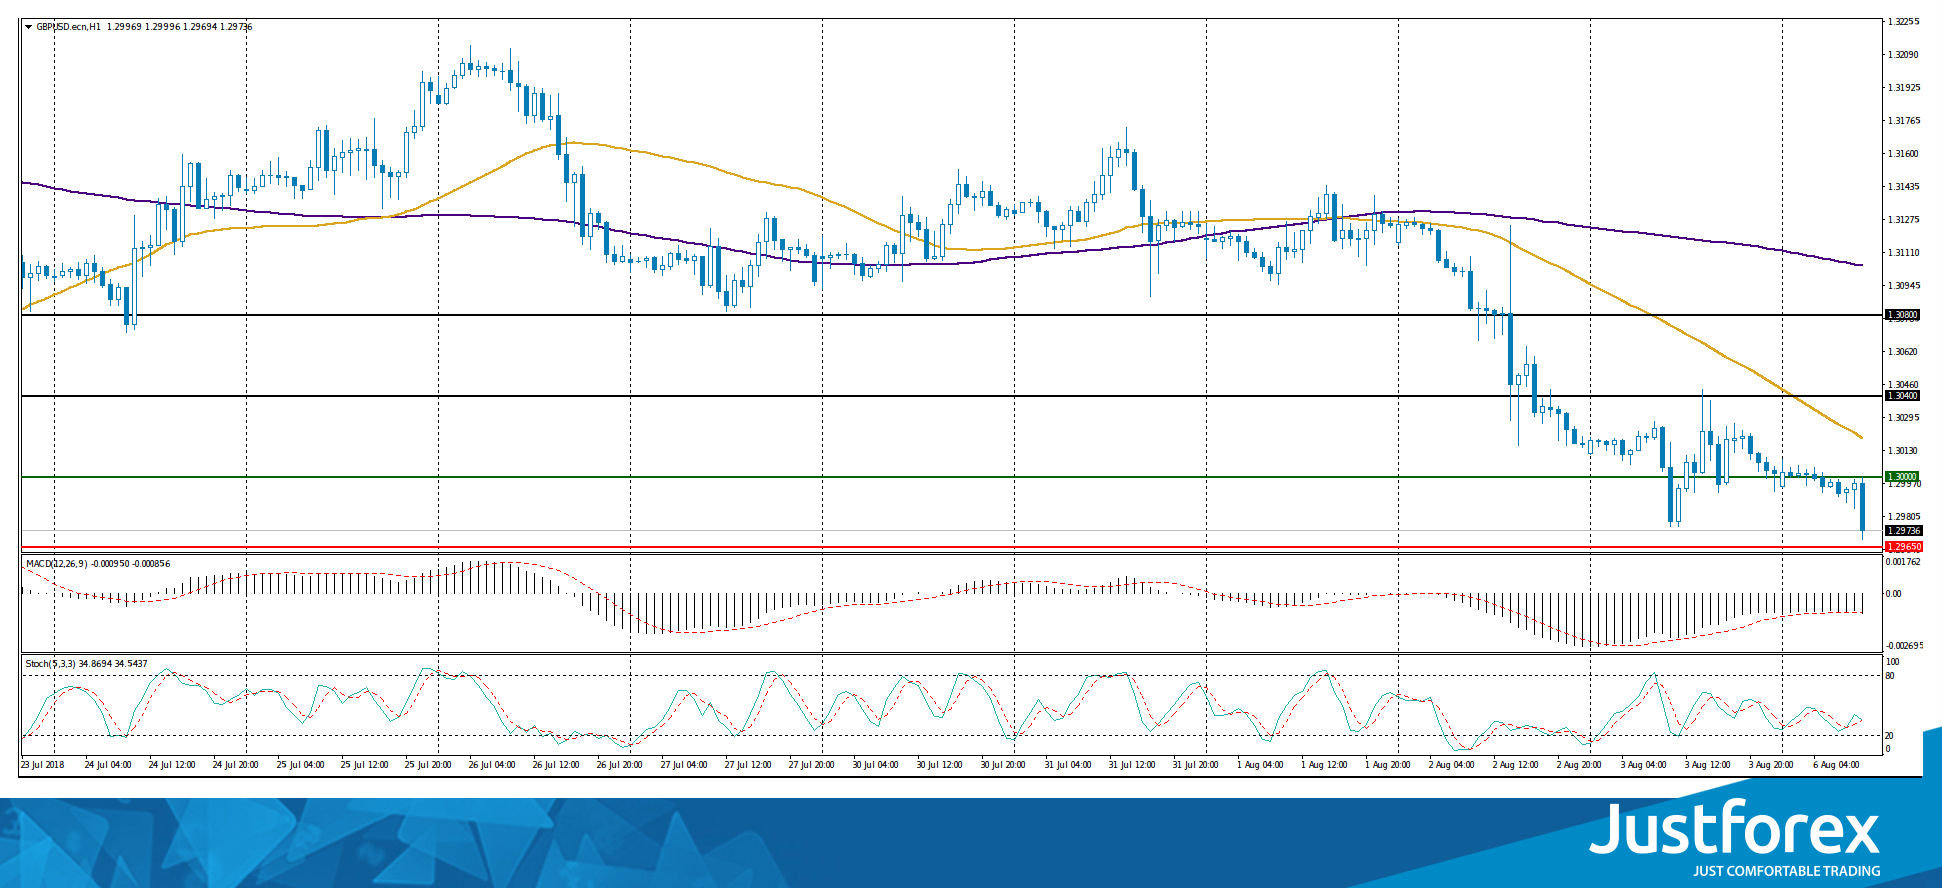
Indicators point to the power of sellers. The price has fixed below 50 MA and 200 MA.
The MACD histogram is in the negative zone, below the signal line, which gives a strong signal to sell GBP/USD.
Stochastic Oscillator is located in the neutral zone, the %K line is crossing the %D line. There are no accurate signals.
Trading recommendations
Support levels: 1.29650, 1.29300
Resistance levels: 1.30000, 1.30400, 1.30800
If the price fixes below 1.29650, it is necessary to look for entry points to the market to open short positions. The movement is tending to 1.29300-1.29000.
Alternative option. If the price fixes above the already "mirror" resistance of 1.30000, the GBP/USD quotes are expected to rise. The movement is tending to 1.30400-1.30600.
The USD/CAD currency pair
Technical indicators of the currency pair:
Prev Open: 1.30187
Open: 1.29925
% chg. over the last day: +0.18
Day's range: 1.30013 – 1.30103
52 wk range: 1.2059 – 1.3795
The technical pattern on the USD/CAD currency pair is still ambiguous. On Friday, a positive report on Canada's trade surplus was published. At the moment, the trading instrument is in a sideways trend. Local support and resistance levels are 1.29900 and 1.30200, respectively. We recommend opening positions from these marks.
The news feed on the economy of Canada is calm.
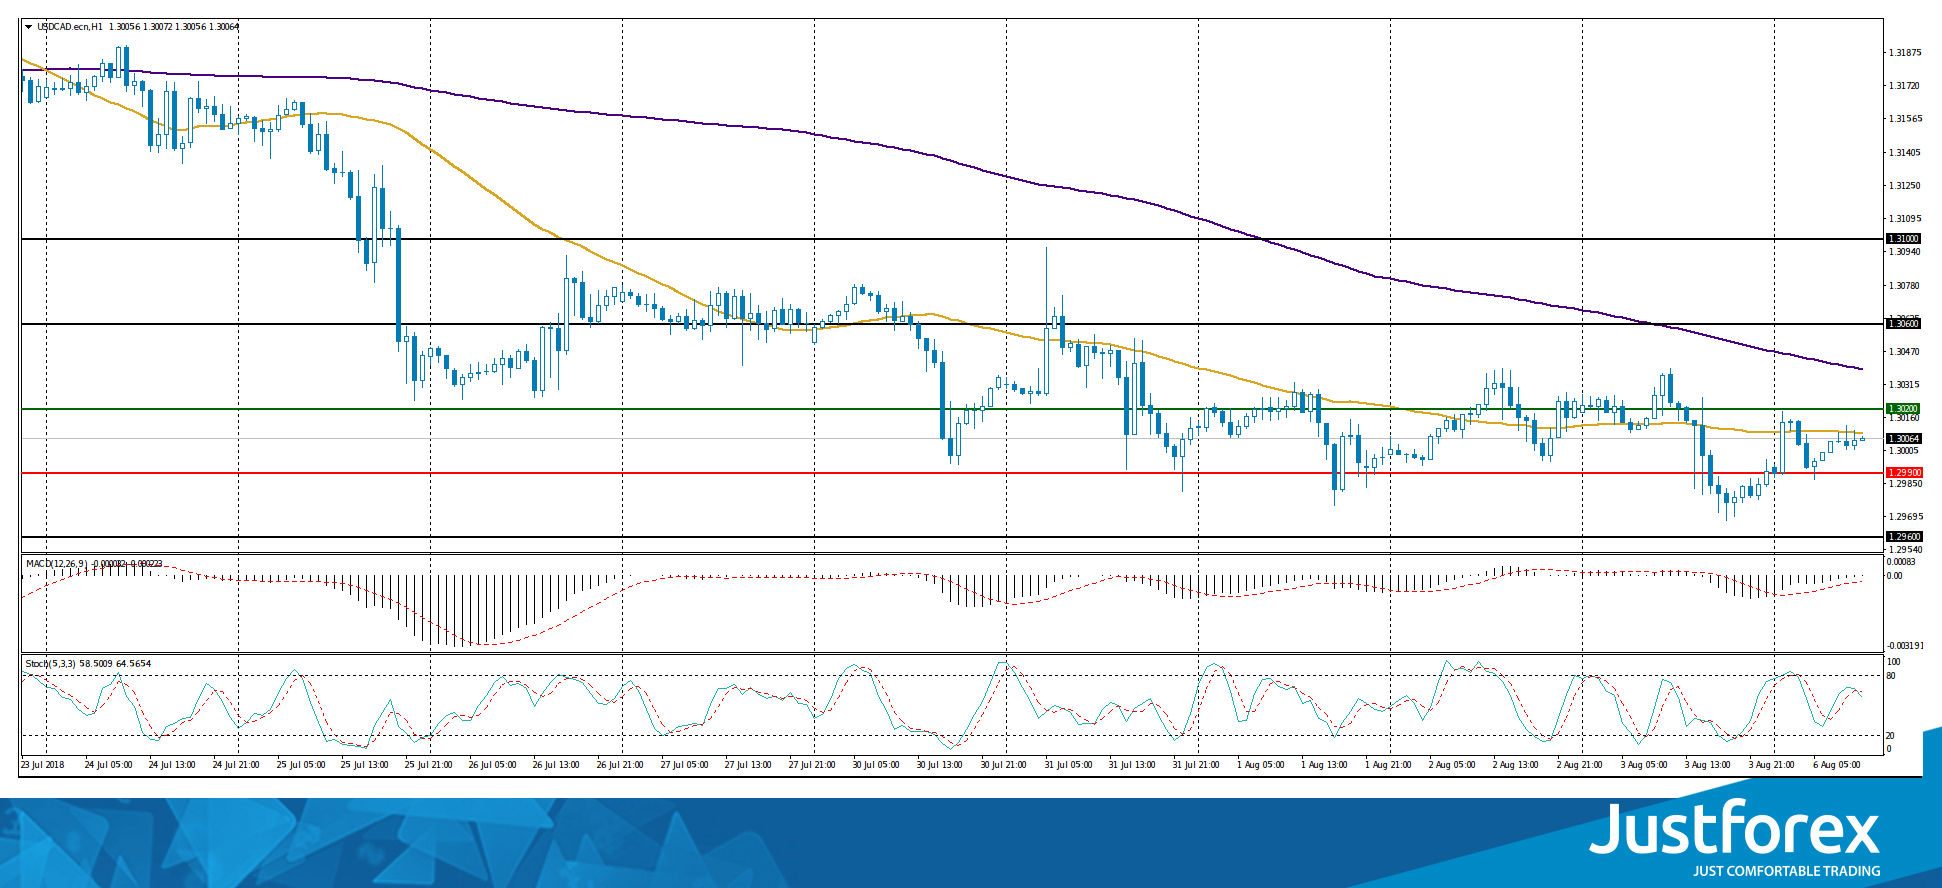
Indicators do not send accurate signals. The price is testing 50 MA.
The MACD histogram is near 0 mark.
Stochastic Oscillator is located in the neutral zone, the %K line has crossed the %D line. There are no accurate signals.
Trading recommendations
Support levels: 1.29900, 1.29600
Resistance levels: 1.30200, 1.30600, 1.31000
If the price fixes above the resistance level of 1.30200, we recommend considering purchases of USD/CAD. The target movement level is 1.30600-1.30800.
Alternative option. If the price fixes below 1.29900, the USD/CAD quotes are expected to decline. The movement is tending to 1.29600-1.29400.
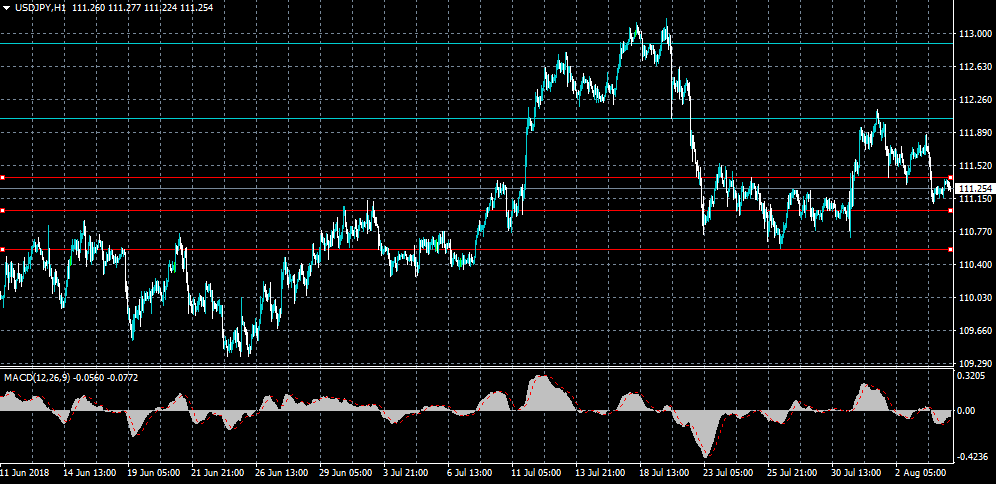
The USD/JPY currency pair
Technical indicators of the currency pair:
Prev Open: 111.634
Open: 111.214
% chg. over the last day: -0.35
Day`s range: 111.231 – 111.267
52 wk range: 104.56 – 114.74
On Friday, there were aggressive sales on the USD/JPY currency pair. The decrease in quotes exceeded 60 points. At the moment, the USD/JPY quotes are consolidating. The trading instrument has the potential for further reduce. Local support and resistance levels are 111.150 and 111.400, respectively. The positions should be opened from these marks.
The news feed on the economy of Japan is calm.
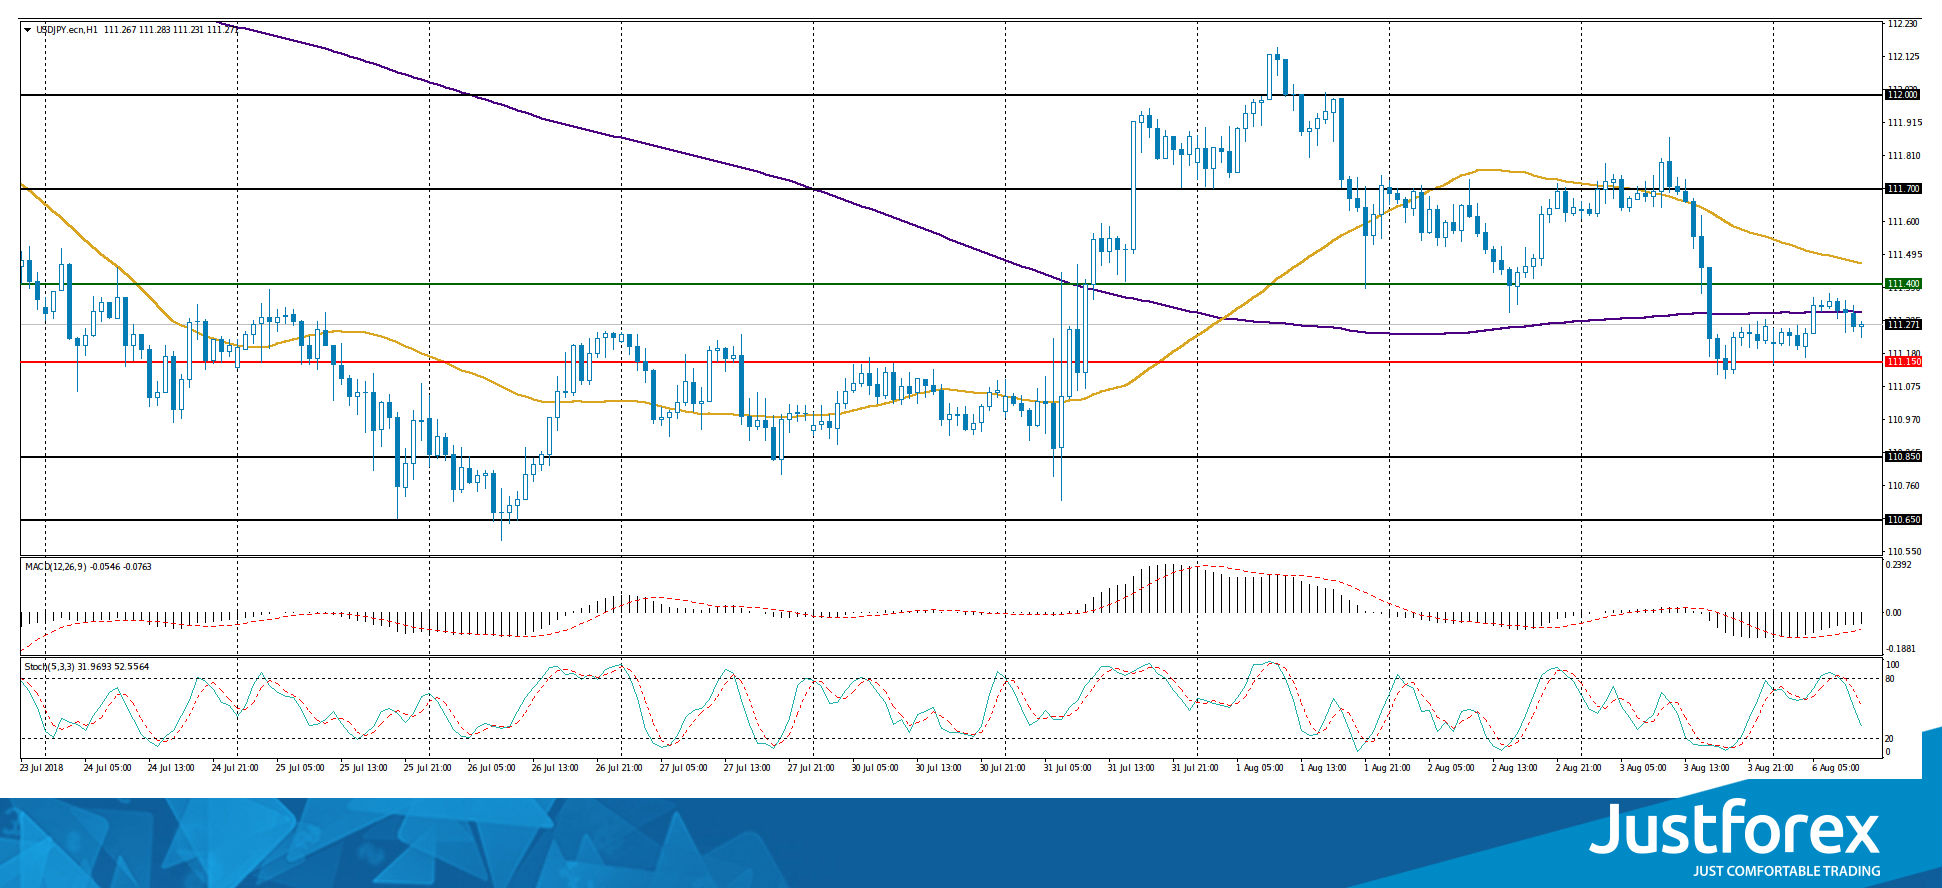
Indicators do not send accurate signals. The price has crossed 200 MA.
The MACD histogram is in the negative zone, but above the signal line, which gives a weak signal to sell USD/JPY.
Stochastic Oscillator is located in the neutral zone, the %K line is below the %D line, which also indicates a decline in quotes.
Trading recommendations
Support levels: 111.150, 110.850, 110.650
Resistance levels: 111.400, 111.700, 112.000
If the price fixes below 111.150, the USD/JPY quotes are expected to fall. The movement is tending to 110.850-110.650.
Alternative option. If the price fixes above 111.400, it is necessary to consider purchases of USD/JPY. The movement is tending to 111.700-112.000.