Sample Category Title
Eurozone Sentix Investor Confidence rose to 14.7, all-clear in trade dispute with US
Eurozone Sentix Investor Confidence rose solidly to 14.7 in August, up from 12.1 and beat expectation of 12.8. Current situation index rose from 36.8 to 33. Expectations index also improved from -10.0 to -5.8. Sentix noted that the indices "reflect less the danger of a general turnaround". Instead, they point to a "cooling of phase". Also, the data "reflect a certain all-clear in the trade dispute with the US after EU Commission President Juncker succeeded in preventing a further intensification of the conflict in negotiations with US President Trump."
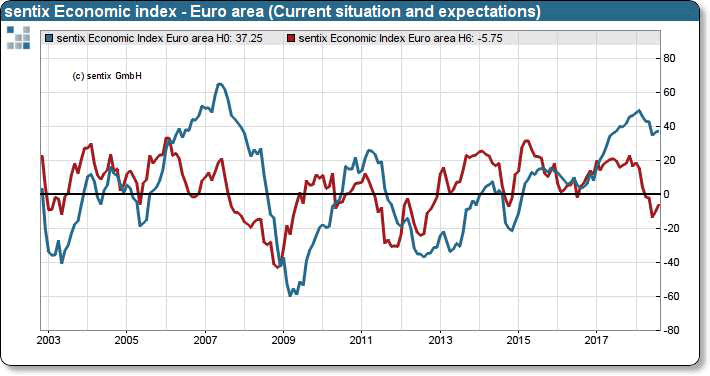
Germany is a beneficiary of the diminishing fear of a trade war. Its overall Sentix index rose from 16.2 to 20.4, with current situation index up from 51.3 to 54.8, expectations index up from -14.0 to -9.3. US overall index climbed from 18.6 to 25.6, highest since March. The US current situation index rose from 53.8 to 62.8 and hit an all time high. Expectations index also improved from -11.8 to -6.3.
Japan overall index improved from 10.9 to 13.2 but was capped below June's 14.3. Also, current situation index dropped from 30.5 to 30.3, hitting the lowest since September 2017. That's also the sixth decline in a row. Japan expectations index rose from -7.0 to -2.5.
Trade Conflict Between The US And China Is Again In The Spotlight
On Friday, economic reports on the US labor market were published. Thus, the number of people employed in the nonfarm sector slowed down to 157K in July, while experts expected 193K. At the same time, the value was revised upwards and counted to 248K in June. The unemployment rate fell to 3.9% in July, as investors forecasted. In general, demand for the US currency is still high. The US dollar index (#DX) slightly fell and closed in the negative zone (-0.03%).
The trade war between the US and China is again in the spotlight. On Thursday, the US administration decided to impose duties on Chinese goods $200 billion worth. On Friday, China announced the introduction of retaliatory duties on American goods $60 billion worth. Today, the US sanctions against Iran will also come into effect. Investors monitor the geopolitical events.
The "black gold" prices are slightly increasing. At the moment, futures for the WTI crude oil are testing a mark of $68.8 per barrel.
Market Indicators
On Friday, the major US stock indices closed in the positive zone: #SPY (+0.43%), #DIA (+0.51%), #QQQ (+0.31%).
At the moment, the 10-year US government bonds yield is at the level of 2.94-2.95%.
The news feed on 2018.08.06:
Important economic news is not expected to be published today. Financial market participants monitor political events.
The Japanese Yen Loses Its Safe-Haven Status As China-US Trade Conflict Intensifies
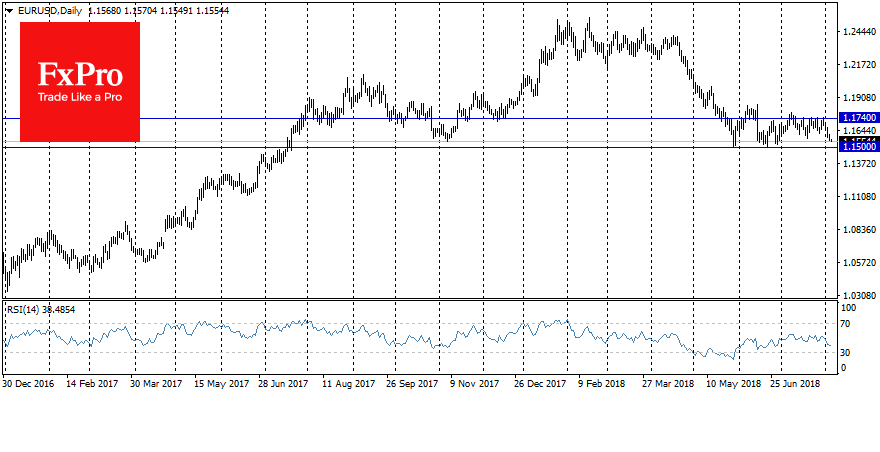
The dollar adds at the start of a new week, despite the weak employment growth in July report. The EURUSD pair is trading near the 6-weeks lows at 1.1550. Despite a poor number of jobs created, market participants felt that the Fed would maintain its commitment to the gradual tightening of the policy with two more hikes this year.
Nevertheless, the US market continues to attract investors’ interest. The strong company reporting pushes stock indices back to the January highs. A year earlier, the rally of the indices was partially supported by the dollar weakening, but now the USD is experiencing an impressive demand.
In addition to data on the labour market, the demand for the dollar is also supported by the growing trade conflict between the US and China. China proposes to expand tariffs on US goods, including such sensitive sectors with a trade volume of $ 60 billion as liquefied natural gas and aircraft.
The consequences of the trade conflict between the US and China threaten to affect the growth of the entire region, which puts pressure on the yen as well. The Japanese currency, to some extent, loses its status of a protective currency having lost almost 6.5% to the dollar for the last 4 months as the trade conflicts has been intensifying.
The British Pound fell below 1.30 on Friday and is now near this mark and near its annual lows.
Thus, the US currency demonstrates the strengthening to its largest competitors.
The EURUSD pair is trading at the low of the last three months. It is an important area of support, below which many orders are concentrated. A fall below 1.15 is capable of triggering an avalanche of stop orders and opening the way for a fairly rapid fall of the pair down to around 1.10, without encountering any serious technical support levels along the way.
GBP/JPY Daily Outlook
Daily Pivots: (S1) 144.28; (P) 144.92; (R1) 145.32; More...
Intraday bias in GBP/JPY remains on the downside as this point. The consolidation pattern from 143.18 should have completed with three waves up to 149.30 already. Deeper fall should be seen to 143.18/76 support zone. Deceive break there will resume larger decline from 156.59. On the upside, above 145.53 minor resistance will turn intraday bias neutral first. But outlook will stay mildly bearish as long as 147.13 resistance holds.
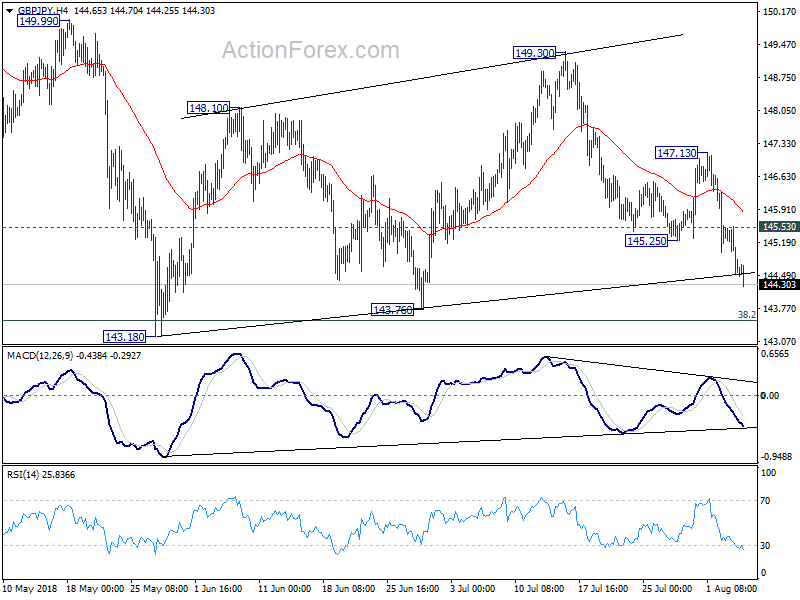
In the bigger picture, decline from 156.59 is seen as a corrective move. In case of another fall, strong support should be seen above 139.29 cluster support (50% retracement of 122.36 to 156.59 at 139.47) to contain downside and bring rebound. Meanwhile, break of 153.84 should confirm that the correction is completed and target 156.59 and above to resume the medium term up trend.
GBP/USD Double Trend Line Confluence
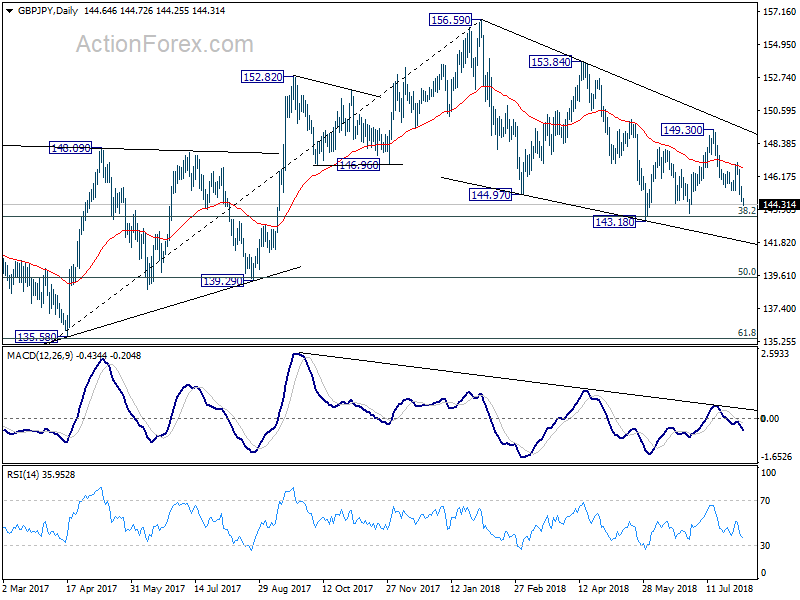
The GBP/USD has broken the bearish consolidation below 1.3070 level. A retracement within 1.3055-3085 could spark a new wave of sellers. The POC zone is marked by two descending trend lines and EMA89. If the price gets in the zone, we should see a rejection towards 1.2959 and 1.2917. A h1 or h4 close below 1.2947 without rereacement to the POC zone could also ignite selling towards 1.2917.
W L3 - Weekly Camarilla Pivot (Weekly Interim Support)
W H3 - Weekly Camarilla Pivot (Weekly Interim Resistance)
W H4 - Weekly Camarilla Pivot (Strong Weekly Resistance)
D H4 - Daily Camarilla Pivot (Very Strong Daily Resistance)
D L3 – Daily Camarilla Pivot (Daily Support)
D L4 – Daily H4 Camarilla (Very Strong Daily Support)
POC - Point Of Confluence (The zone where we expect price to react aka entry zone)
EUR/JPY Daily Outlook
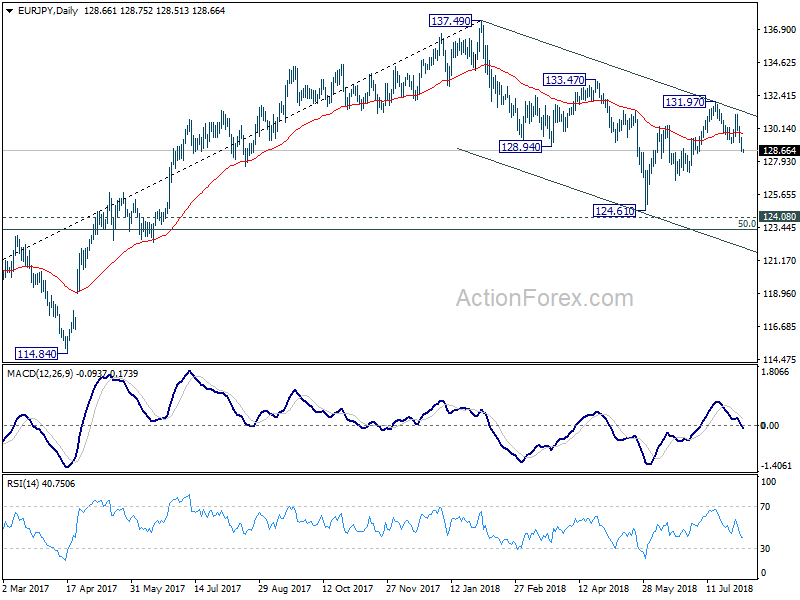
Daily Pivots: (S1) 128.39; (P) 128.98; (R1) 129.32; More....
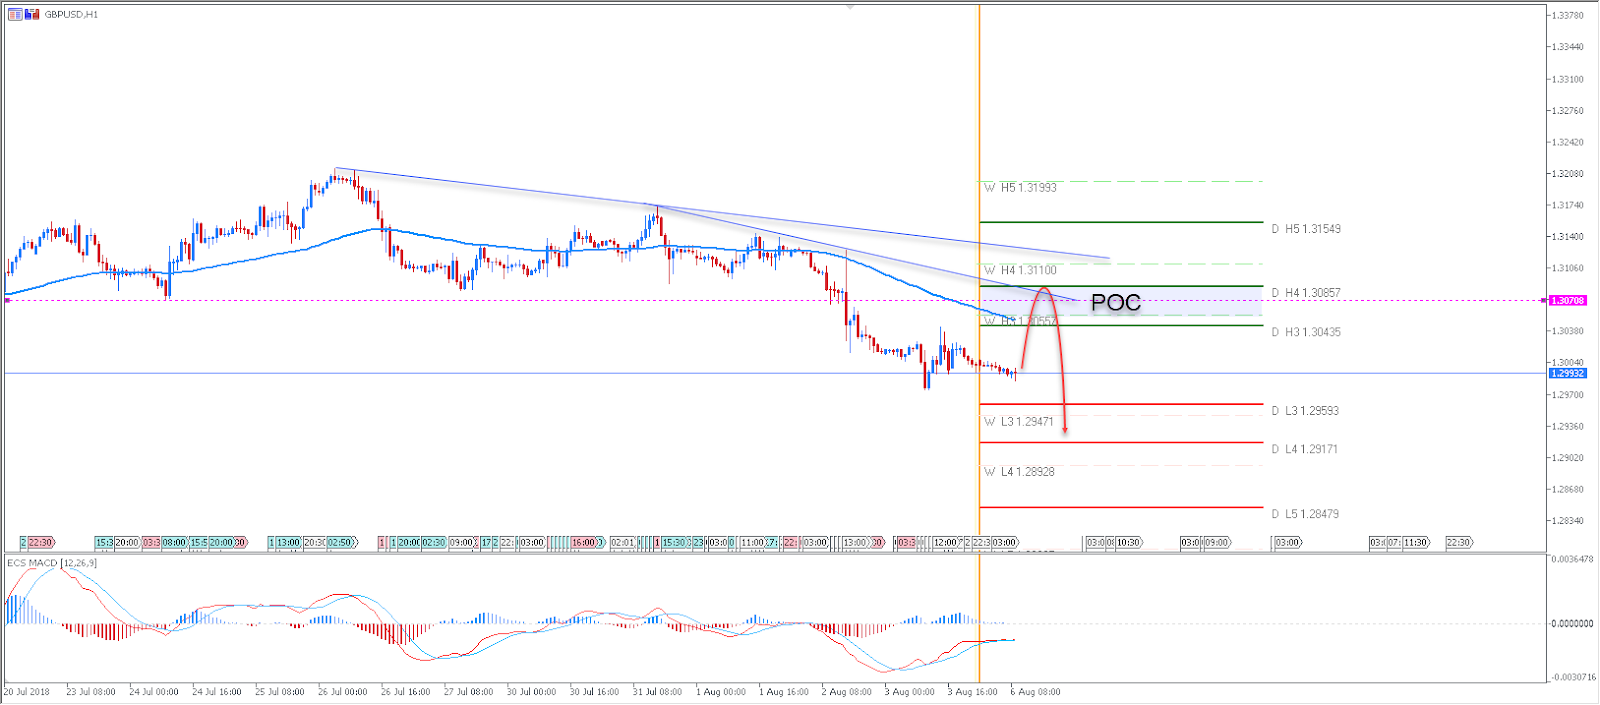
Intraday bias in EUR/JPY remains on the downside at this point. Rebound from 124.61 could have completed with three waves up to 131.97 already. Deeper fall would be seen for 127.13 support first. Decisive break there will bring retest of 124.61 low. On the upside, above 129.52 minor resistance will turn intraday bias neutral first. But near term outlook will remain cautiously bearish as long as 131.13 resistance holds.
In the bigger picture, for now, EUR/JPY is still holding above 124.08 key support turned resistance. And the larger rise from 109.03 (2016 low) mildly in favor to resume. Break of 133.47 should send the cross through 137.49 high. However, decisive break of 124.08 will confirm medium term reversal and could then pave the way back to 109.03 low and below.
PBOC Imposes FX Reserve Requirement as Renminbi Selloff Gets Alarming
PBOC announced last Friday to impose 20% reserve requirement ratio (RRR) on onshore (CNY) FX forward transactions. Despite the central bank’s denial, the move is obviously to moderate recent sharp depreciation of renminbi. Such measure was implemented on October 15, 2015, before removal on September 11, 2017, in an attempt to rescue the massive selloff of renminbi. Back in 2015, PBOC’s renminbi reform on August 11 included an abrupt announcement of one-off devaluation of renminibi by +2% against US dollar. Such move had damaged market confidence over PBOC and the currency. Since then, the central bank has included adjustment of reserve requirement on FX forward trading in its list of so-called “macro-prudential” policy, notwithstanding the underlying goal of curbing capital outflow.
“811-Reform”
On August 11, 2015, PBOC abruptly devaluated renminbi by -2%. On actual trading, CNY plunged -1.8% against USD, the biggest one-day decline since 1994. Accompanying the one-off devaluation, PBOC announced a new renminbi fixing mechanism, suggesting that the components used in setting that daily fixing rate include previous’ day’s close, FX demand and supply conditions and movement of major currencies. The market believed that the new mechanism had paved the way for renminibi to join IMF’s special drawing right (SDR). While inclusions of demand/supply conditions and movement of major currencies in the fixing mechanism might have signaled the government’s effort to make renminbi more market-oriented, the surprising devaluation had dampened market confidence on the currency and evidenced that the currency remained under manipulation to the authority despite the rhetoric of market-orientation.
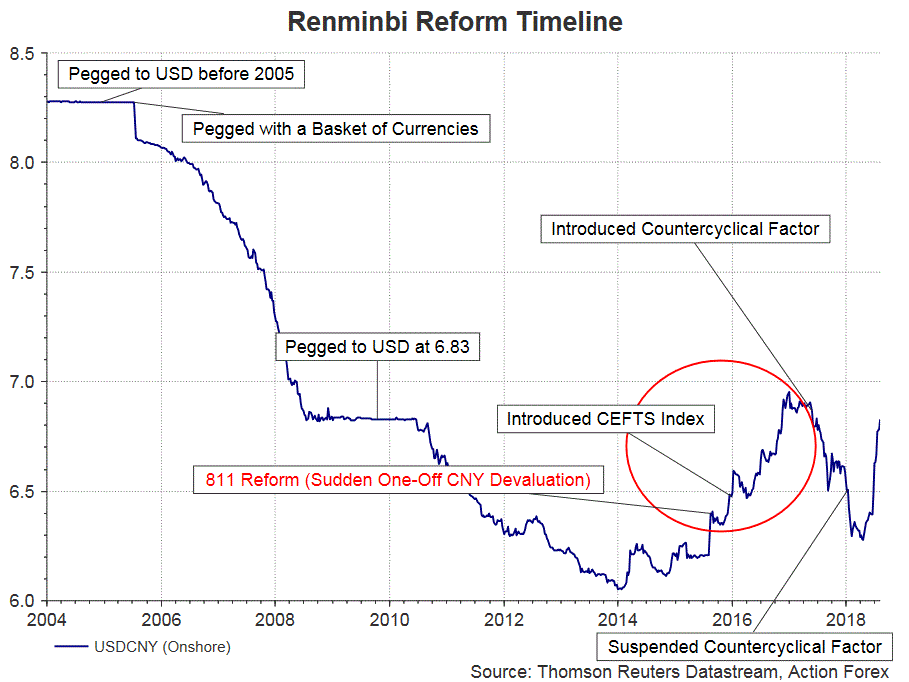
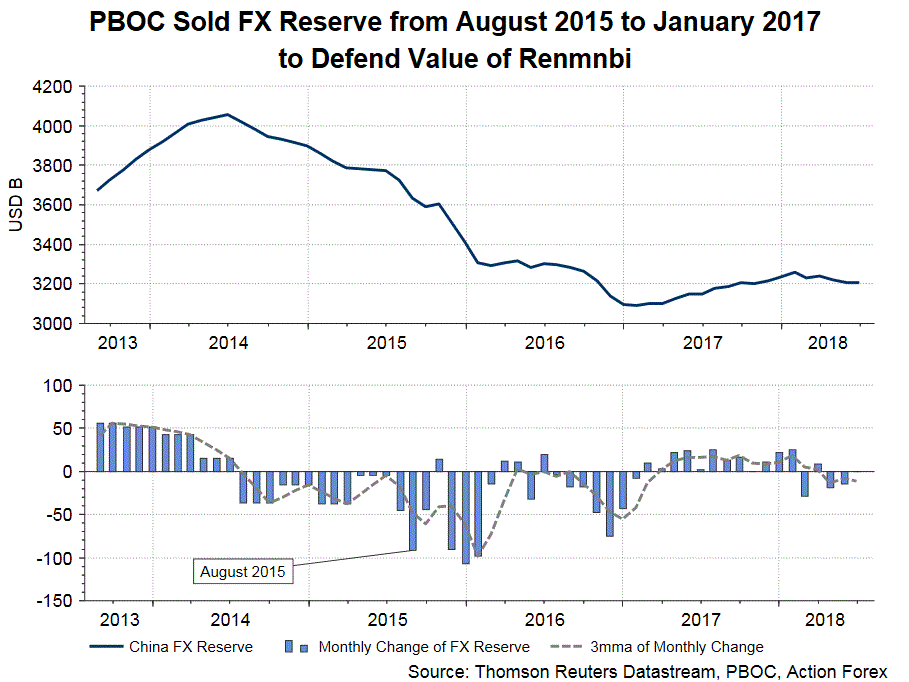
Panic selling of renminbi following the “811-reform” triggered the government to adopt a series of capital control measures, including the abovementioned 20% FX reserve ratio effective from October 2015. Other capital control measures includes strengthening supervision of foreign exchange purchases by foreign-held non-resident accounts (NRA), monitoring firms’ foreign exchange buying and tightening supervision of bank clients’ foreign exchange deals. Besides capital control measures, the government also aggressively sold FX reserve in support of renminbi. US$630B of FX reserve was evaporated from Aug-2015 to Dec-2016 and PBOC’s aggressive selling sent FX reserve below US$ 3 trillion in early 2017.
The case of 2018
Since the 811 reform, renminbi had fallen against US dollar before reaching a bottom at January 3, 2017. The currency pair slumped about 10% over the 16-month period. The recent renminbi selloff has been driven mainly by market pressure as a result of the intensification of US-China conflict. Renminbi has plunged over -7% against the greenback in just 2 months. The pace of the depreciation should justify PBOC’s concern over capital outflow. Given our view that the trade conflict would continue for some time, risk is skewed to the downside for renminbi. Therefore, we expect more capital control measures to be announced following the re-introduction of the FX reserve requirement. The FX reserve in August (to be released this week) would be closely watched. We will not be surprised to see a drop in FX reserve as the government might have intervened to defend the renminbi.
EURUSD Stands In Consolidation Mode, Further Losses Are Expected
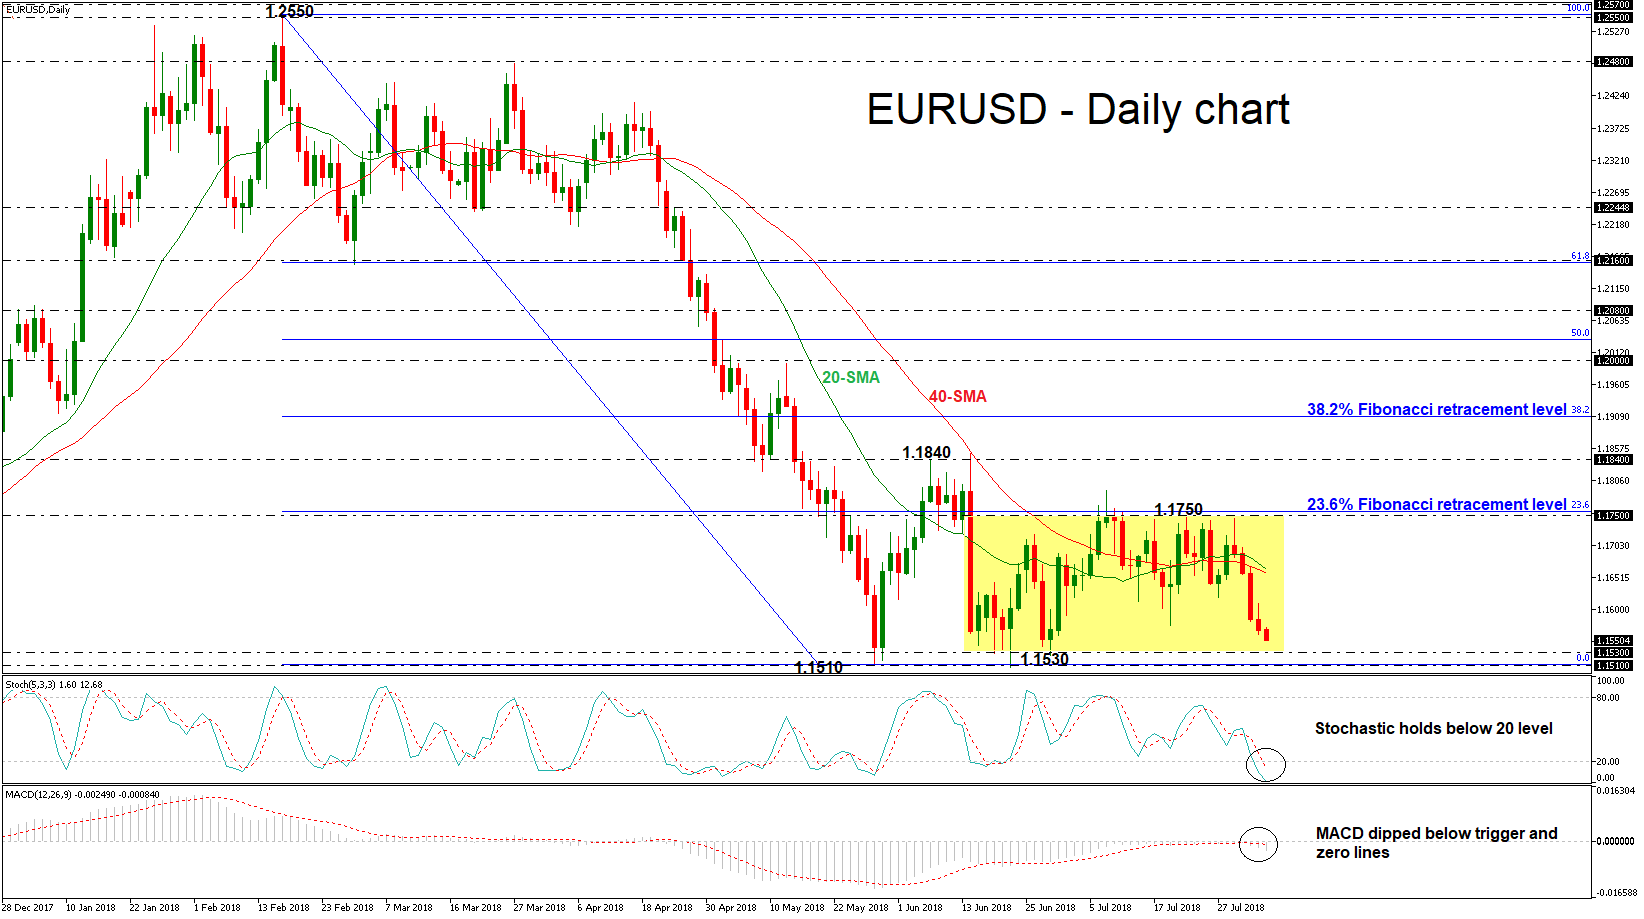
EURUSD has been underperforming in the past four days, breaking back below the 20- and 40-simple moving averages in the daily timeframe. The world’s most traded currency is ready to create a consolidation area if it touches again the 1.1510 – 1.1530 zone and reverses back up. The upper boundary of the channel is the 1.1750 resistance level, which stands near the 23.6% Fibonacci retracement level of the downleg from 1.2550 to 1.1510.
Momentum indicators are pointing to a negative bias in the short term with the stochastic oscillator holding in the oversold zone and continuing the bearish movement. Moreover, the MACD oscillator is slipping below the trigger and zero lines with strong momentum.
Further losses should see the aforementioned key area (1.1510 – 1.1530) acting as a major support. A drop below this level would reinforce the bearish structure and open the way towards the 1.1300 psychological barrier.
In the event of an upside reversal and a climb above the upper boundary of the in-progress trading range would challenge the 1.1840 resistance hurdle, taken from the high on June 7. Further gains would lead the way towards the 38.2% Fibonacci of 1.1910.
Turning to the bigger picture, the market seems to be in a bearish mode given that the price is trading below significant resistance obstacles such as the moving averages and the 23.6% Fibonacci mark.
Yen Gains Support On Trade Tensions
Here are the latest developments in global markets:
FOREX: The US dollar index is nearly 0.2% higher on Monday, in the aftermath of the US jobs report on Friday, which was slightly softer than consensus expectations, but still relatively strong overall. Meanwhile, the Japanese yen, attracted some safe-haven flows on Friday, ending the day higher across the board after China unveiled a list of $60bn worth of US goods it plans to impose tariffs on.
STOCKS: Wall Street closed higher on Friday, undeterred by the US and China exchanging another round of tariff threats. The Dow Jones gained 0.54%, while the S&P 500 and the Nasdaq Composite advanced by 0.46% and 0.32% respectively. Futures tracking the Dow, S&P, and Nasdaq 100 suggest these indices are set to open higher today as well, albeit marginally so. Asia was mixed on Monday, with Japan’s Nikkei 225 and Topix declining by 0.08% and 0.56% correspondingly, but the Hang Seng in Hong Kong climbing by 0.33%. In Europe, futures tracking the major benchmarks were mostly in the green, pointing to a higher open today. The only exception was the British FTSE 100.
COMMODITIES: Oil prices are slightly higher on Monday, recouping some of the losses they posted on Friday as fresh trade-war headlines clouded the outlook for oil demand. WTI and Brent crude are up by 0.22% and 0.17% respectively today. News on Friday that Saudi Arabia’s production likely fell by 200k bpd in July, and a small decline in the number of active US oil rigs, likely helped to offset any greater losses. In precious metals, gold prices are practically flat today around the $1,213 per troy ounce mark, after posting some modest gains in the previous session. That said, the yellow metal continues to trade within breathing distance of its lows for the year, with investors continuing to favor the Japanese yen and US bonds as safe-haven plays when trade-war headlines hit the wires.
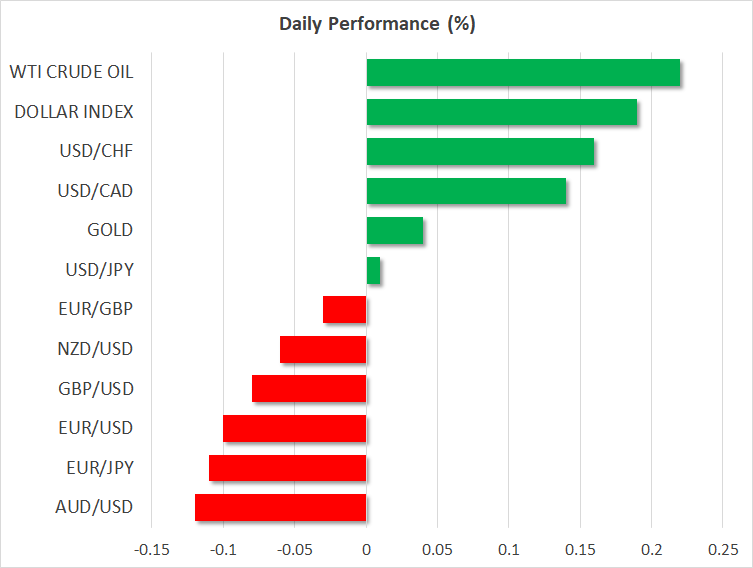
Major movers: Dollar shrugs off jobs data; yen soars on trade headlines
The dollar managed to close the day higher against the euro and pound on Friday, even despite the US employment data for July being a touch softer than projected. While wage growth and the unemployment rate were both in line with expectations, jobs growth disappointed somewhat, with nonfarm payrolls clocking in at 157k instead of the anticipated 190k. That said, last month’s print was revised notably higher, offsetting some of the disappointment. Overall, the report was still consistent with a robust US labor market, keeping in play the prospect of two more quarter-point Fed rate hikes before year-end.
Meanwhile, the trade war narrative came back to the spotlight on Friday, after China unveiled a list of $60bn US goods it plans to impose tariffs on, in retaliation to the US plan to slap levies on $200bn worth of Chinese imports. The Japanese yen – which is widely considered a haven asset – was propelled higher by the headlines, while yields on US bonds fell across the maturity spectrum as investors flocked to safety. Surprisingly though, major US stock indices managed to escape largely unscathed, implicitly signaling that the situation is not dire enough yet for investors to lower their exposure to equities amid a strong earnings season. Focus is likely to remain on any developments, particularly considering that this week is relatively light in terms of data flow.
Elsewhere, sterling/dollar continues to hover just above its 11-month lows, as a combination of cautious monetary policy signals and ever-increasing uncertainty around Brexit continues to weigh. Regarding the latter, UK international trade secretary Liam Fox said over the weekend that the chance of a no-deal Brexit is now – in his view – greater than the likelihood of reaching a deal. The pound, however, reacted little to his remarks.
Lastly, the closely watched yuan, especially in light of trade developments, reentered a path of declines versus the US currency after posting considerable gains on Friday that allowed it to move away from its lowest since May 2017. Friday’s gains came after the PBOC made it more difficult (costly) for speculators to short the Chinese currency. The offshore yuan was 0.1% weaker against the greenback on Monday.

Day ahead: Eurozone’s Sentix due; trade developments remain in the forefront
Monday’s calendar is light, featuring the Sentix index that gauges investor morale in the eurozone. Meanwhile, the Sino-US dispute over trade continues to generate attention.
The eurozone’s Sentix investor confidence index for August is due at 0830 GMT. The index is anticipated to stand at 13.5, reflecting an improvement compared to July’s 12.1; if indeed delivered, this would constitute the second straight month that morale would appear to rise in the euro area. Trade tensions have been a factor weighing on eurozone investor sentiment in the past, with the recently held constructive meeting between Juncker and Trump possibly paving the way for a rosier outlook in terms of investor confidence.
China proposing retaliatory tariffs on $60 billion worth of US goods on Friday confirmed that the world’s second largest economy does not intend on simply giving in to US demands and actions against it. Thus, it looks like the trade war saga has still room to run, with developments likely to act as catalysts for positioning in FX and other markets.
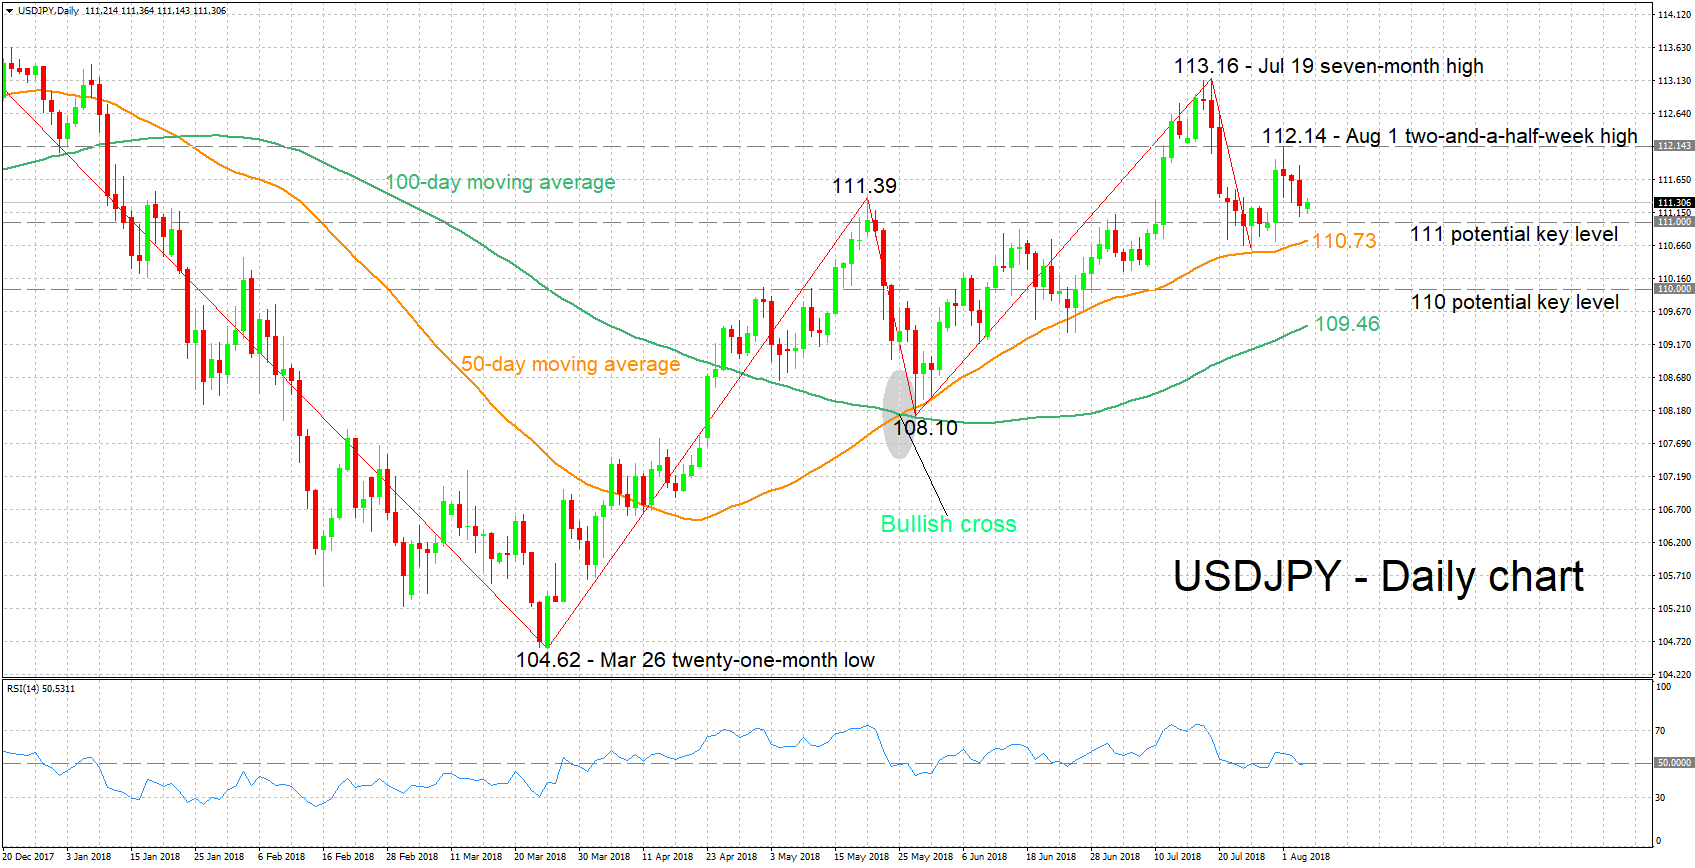
Technical Analysis: USDJPY looking neutral in the short-term
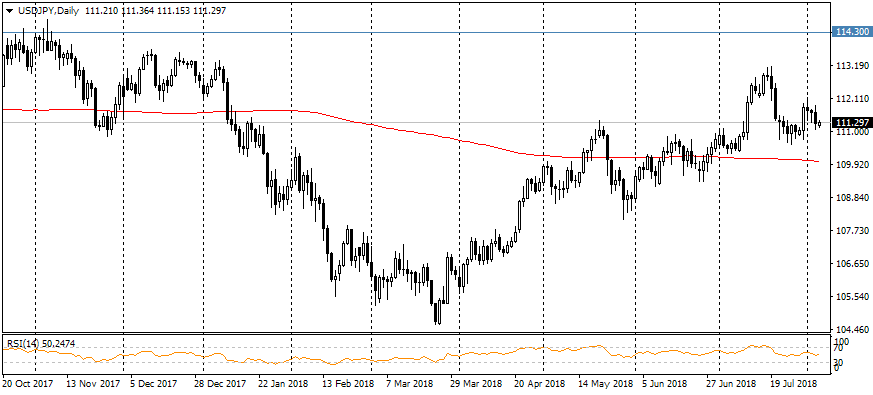
USDJPY has retreated from Wednesday’s two-and-a-half-week high of 112.14, though it continues trading within the relatively narrow range established from late August onwards. The RSI has been hovering around the 50 neutral-perceived level in recent weeks, supporting the case for a neutral short-term picture for the pair.
Intensifying US-China trade tensions may see the yen receiving safe-haven flows, hence USDJPY declining. Support to a falling pair could come around the 111 round figure; the current level of the 50-day moving average line at 110.73 lies not far below, with the one-month low of 110.58 from July 26 also being within sight in case of steeper losses. Further below, the 110 handle would increasingly come into scope.
Easing trade concerns on the other hand could see USDJPY rising. The region around last week’s two-and-a-half-week high of 112.14 – including the 112 level – might act as resistance, with the attention next falling to the seven-month high of 113.16 hit on July 19.
EUR/GBP Daily Outlook
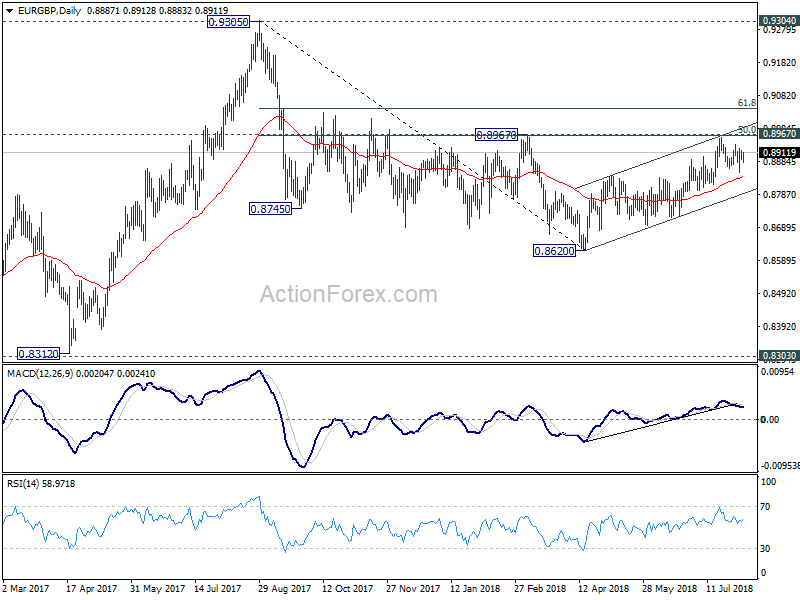
Daily Pivots: (S1) 0.8886; (P) 0.8903; (R1) 0.8915; More...
Intraday bias in EUR/GBP remains neural first. Consolidation pattern from 0.8957 might extend further. But after all, as long as 0.8815 support holds, outlook remains bearish and further rise is expected in the cross. On the upside, decisive break of 0.8967 cluster resistance (50% retracement of 0.9305 to 0.8620 at 0.8963) should confirm completion of whole decline from 0.9305. EUR/GBP should then target 61.8% retracement at 0.9043 next.
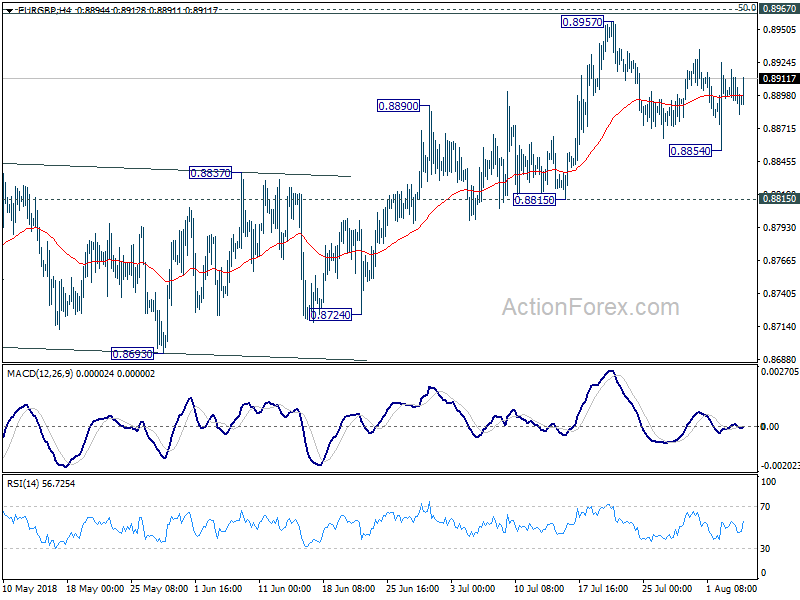
In the bigger picture, EUR/GBP is staying in long term range pattern from 0.9304 (2016 high). The corrective structure of the fall from 0.9305 to 0.8620 is raising the chance that rise from 0.8312 to 0.9305 is an impulsive move. But we're not too confident on it yet. In any case, we'd stay cautious on strong resistance from 0.9304/5 to limit upside in case of further rally. Meanwhile, if there is another medium term decline, strong support will likely be seen from 0.8303 to contain downside.