Sample Category Title
EUR/USD Analysis: Advance Continues
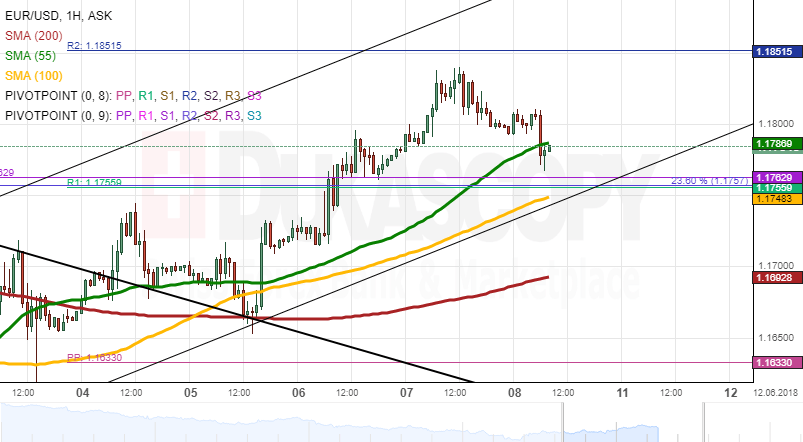
The Euro has maintained its upward tendency for the third consecutive session. Despite edging higher on Thursday morning, the Euro had lost all of its daily gains by the evening.
The pair continues to trade in an ascending channel. However, it failed to reach the upper channel line yesterday prior to returning back to the 55-hour SMA.
From technical point of view, some slight movement north should still be apparent today until the 1.1855 mark, which is limited by the 200-period (4H) SMA and the weekly R2, is reached. Meanwhile, the 55– and 100-hour SMAs are likely to restrict a fall below 1.1750.
This session should be fundamentally calm; however, some turbulence may be caused by the G7 summit which is expected to address the new US tariffs.
GBP/USD Analysis: Calm After Strong Volatility
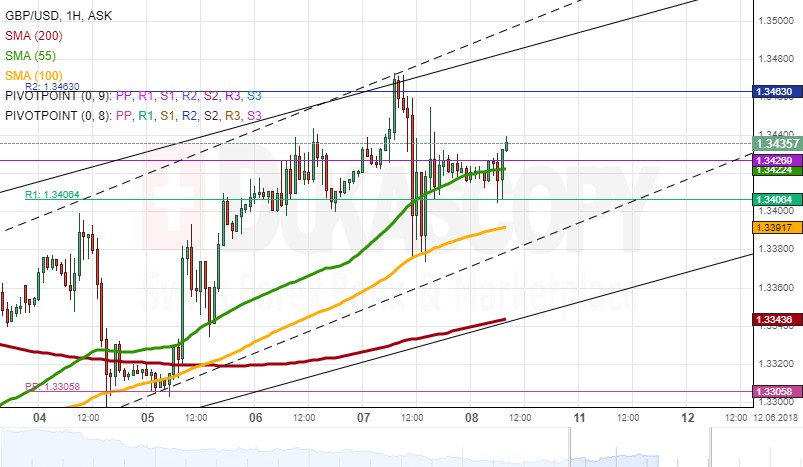
The Sterling showed significant volatility against the US Dollar on Thursday which was seemingly caused by mounting tensions around Brexit.
This weakened the British currency by 0.6% against its American counterpart, thus sending the pair as low as the 100-hour and 100-period (4H) SMAs near 1.3390. At the same time, the pair also reached a new two-week high of 1.3465 prior to this fall. The remainder of the day was very calm, as volatility eased due to the monthly PP and the 55-hour SMA being located nearby.
Technical indicators flash bearish signals for this session. In case this 55-hour moving average is breached and the pair does go lower, the it faces two strong support levels at 1.3375 and 1.3340. In terms of resistance, the 200-period (4H) SMA and the 61.80% Fibo are located at 1.3550.
USD/JPY Analysis: Trades In Narrow Range
The USD/JPY exchange rate weakened 0.4% on Thursday following a test of the 200-day SMA, weekly R1 and 61.80% Fibonacci retracement at 110.20. As a result, the pair breached two SMAs on the hourly time-frame, but has nevertheless remained stranded between the 100– and 200-period (4H) SMAs in the 109.60/85 range this morning, as well.
A breakout may occur in any direction; thus, two scenarios should be considered. The most probable daily low is the 109.40/35 mark, as the 55-period and 200-hour SMAs, the weekly PP and a channel line are located there.
Conversely, gains should be capped near the aforementioned 110.20 level due to the 200-day SMA being located there. Technical indicators are more in favour of the bullish scenario.
Gold Analysis: With No Changes
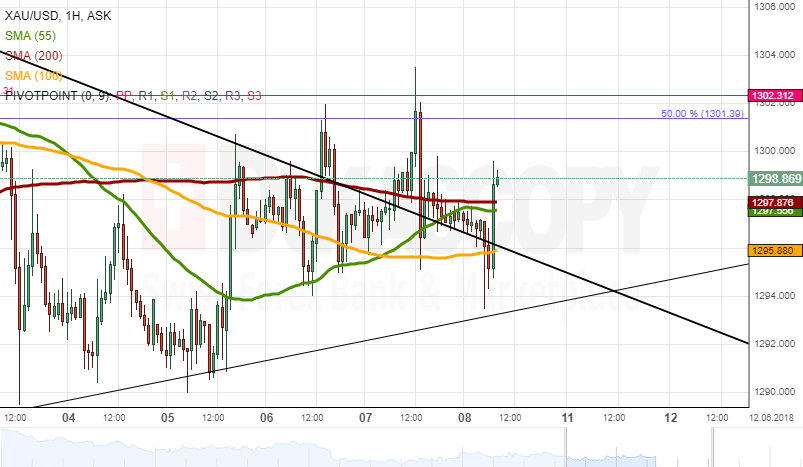
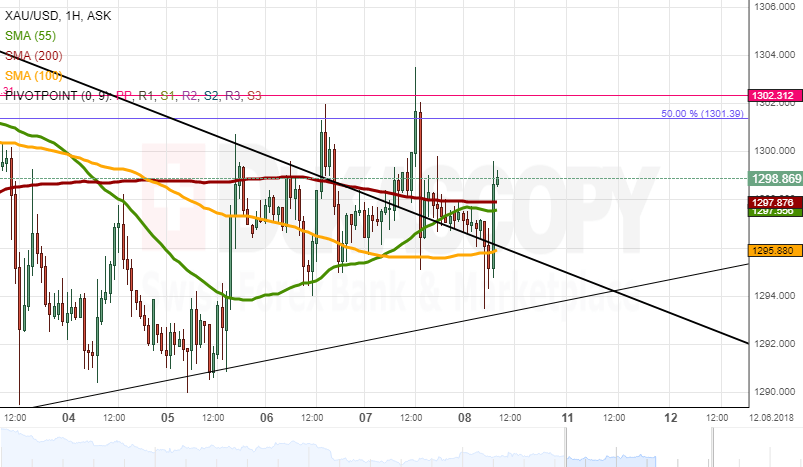
XAU/USD continues to trade sideways for the third consecutive session, as the pair has remained stranded between several notable support/resistance levels.
As apparent on the chart, it has likewise failed to accelerate from the breached two-month channel. A surge above 1,301.00 on Thursday was limited by the 50.00% Fibo retracement and the monthly PP, while a strong support cluster was set by the 100-hour and 100-period (4H) SMAs at 1,295.80.
It is likely that these levels continue to pressure the rate for the following hours. Technical indicators are bearish for this session. In case this scenario occurs, Gold should target the senior channel at 1.287.00. The daily high could be the 200-period SMA at 1,305.00.
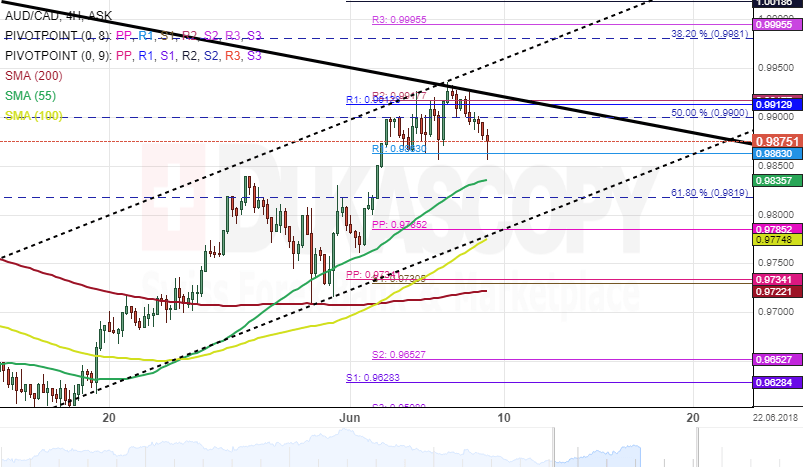
AUD/CAD 4H Chart: Reaches 50.00% Fibo
The Australian Dollar has been constrained by two opposite channels against the Canadian Dollar. The most important of which is the junior ascending pattern which was formed on May 9.
After hitting a strong resistance cluster set by the weekly and the monthly PPs near the 0.99 area and the 50.00% Fibonacci retracement level, the currency pair began to decline. However, this decline has not been significant. This retracement can be measured by connecting the high at 1.02 and the low at 0.95.
Everything being equal, the AUD/CAD currency exchange rate might decline toward the 55– or 100– hour SMAs during the following trading session.
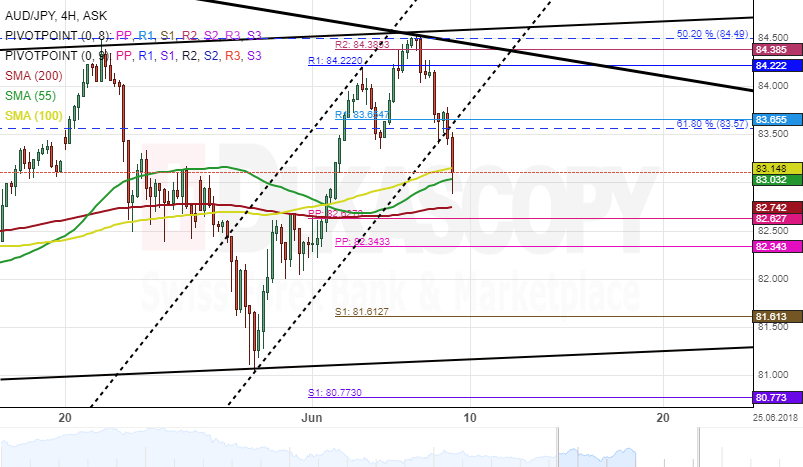
AUD/JPY 4H Chart: Breakout Alerts
Upside risks have dominated the Australian Dollar against the Japanese Yen, thus allowing the currency pair climbing 350-pips or 4.32% within a couple of days. The latest peak was yesterday when the rate made a U-turn after hitting a resistance cluster set by the weekly and the monthly PPs near 84.35.
The exchange rate has been moving along a junior ascending pattern until it reached the 50.00% Fibonacci retracement level and reversed south. This retracement can be measured by connecting the low at 80.52 and the high at 88.50.
Given that a breakout had occurred through the lower boundary of an ascending channel, the currency exchange rate is likely to decline further south until it encounters a support level formed by the combination of the 55-,100-, and 200– hour SMAs.
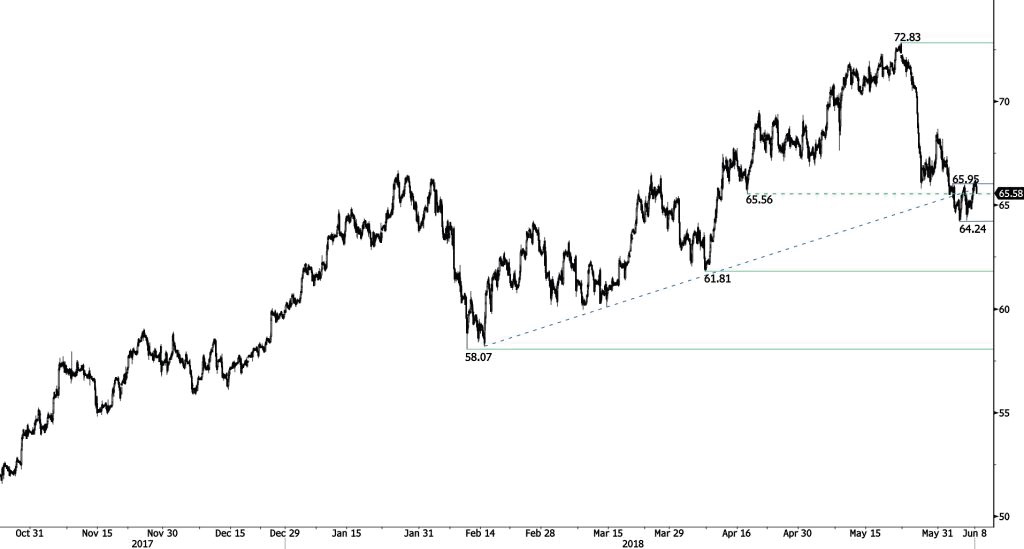
CRUDE OIL Slight Break Of Sideways Range
Crude oil bounce from 64.22 (05/06/2018 low) continues, approaching 66. Hourly support and resistance are given at 61.81 (06/04/2018 low) and 72.83 (22/05/2018 high). The technical structure suggests short-term increase.
In the long-term, crude oil has recovered after its sharp decline last year. However, we consider that further weakness is very likely. For the time being, the pair lies in an upside trend since June 2017. Support lies at 42.20 (16/11/2016) while resistance is located at 77.83 (20/11/2014). Crude oil is trading largely above its 200 DMA.
SILVER Falls Off Reaction Highs
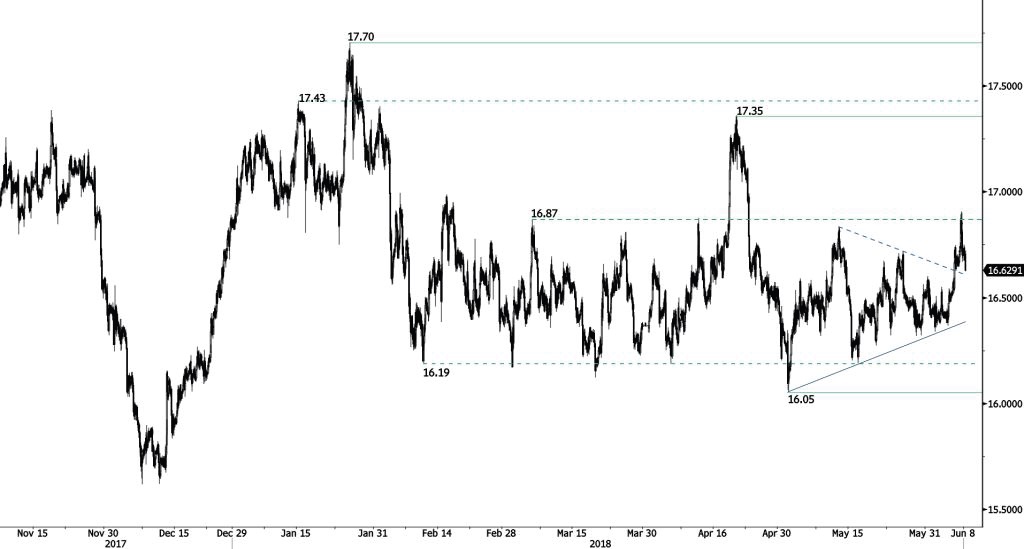
Silver buying interest has dried up preparing for test of 16.50 downtrend line support. Yet the short-term succession of higher lows continues to favour a bullish bias as long as uptrend floor holds. Hourly support and resistance are given at 16.05 (01/05/2018 low) and 17.35 (19/04/2018 high). The technical structure suggests shortterm upward moves.
In the long-term, the trend remains negative/ sideways. Further downside is very likely. Resistance is located at 21.58 (10/07/2014 high). Strong support can be found at 11.75 (20/04/2009). The pair is trading below its 200 DMA.
GOLD Bearish Pennant
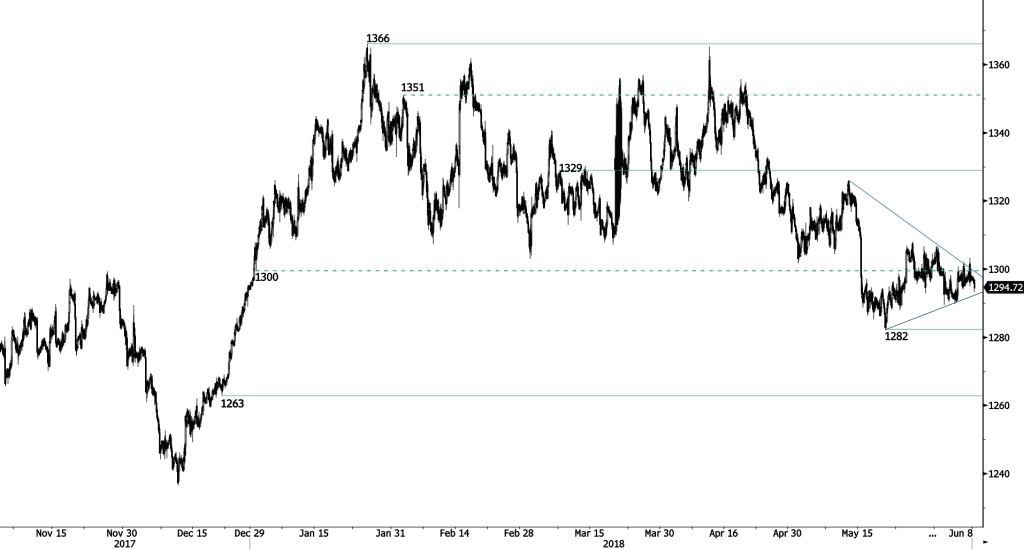
Gold bearish pattern contiuedn to build suggesting deeper downside correction. Hourly support and resistance are given at 1282 (21/05/2018 low) and 1329 (08/03/2018 high). The technical structure suggests further short-term decrease.
In the long-term, the technical structure suggests that there is a growing upside momentum. A break of 1'392 (17/03/2014) is required to confirm it. A major support can be found at 1'045 (05/02/2010 low). The pair is trading below its 200 DMA.
EUR/CHF Strong Bounce
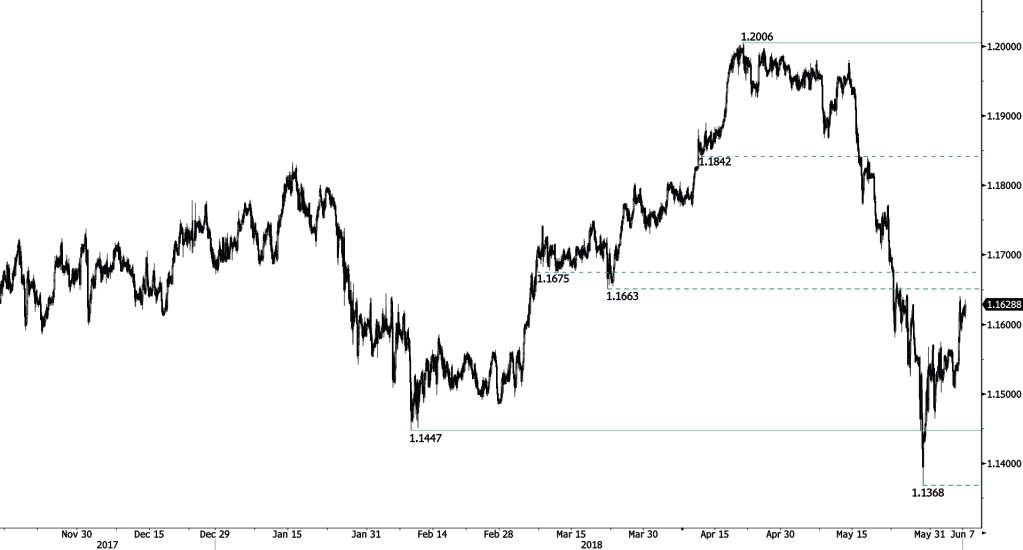
EUR/CHF has further improved on strong recovery bounce. However, the resistance at 1.1663 has yet to be tested. Hourly support and resistance are given at 1.1447 (08/02/2018 low) and 1.2006 (20/04/2018 high). The technical structure suggests short-term upward moves.
In the longer term, the technical structure has reversed. Strong resistance at 1.20 (level before the unpeg) is now at reach. The ECB's slowing QE program is likely to cause buying pressures on the euro, which should weigh in favour of the EUR/CHF. Support and resistance can be found at 1.0624 (24/06/2016 low) and 1.2097 (18/12/2014 high).