Sample Category Title
USDJPY Selling To Increase Below 109.00 Level
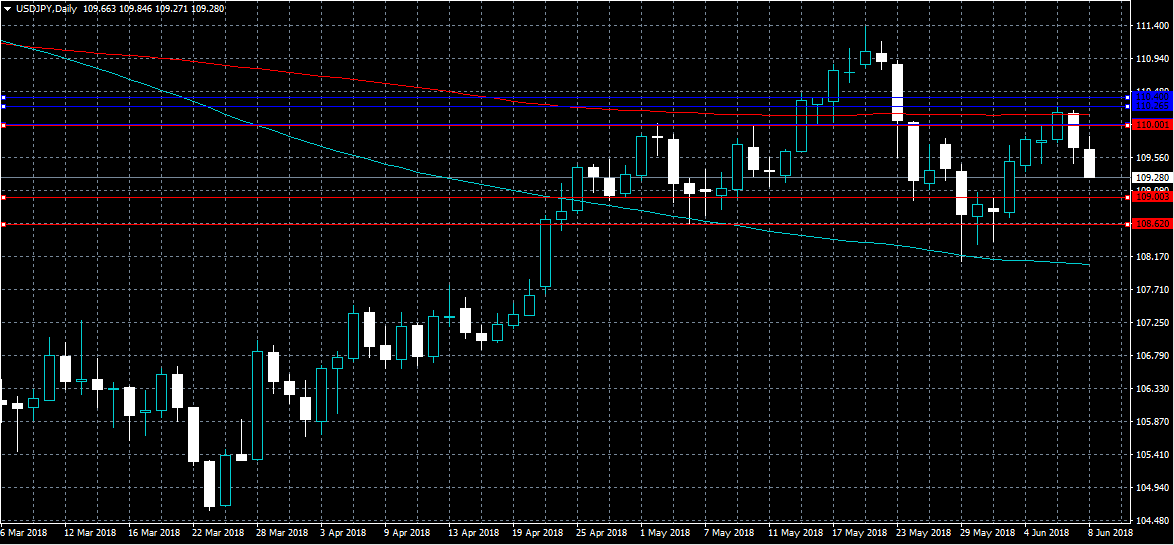
The US dollar has moved sharply lower against the Japanese yen, hitting 109.30, as risk-off trading sentiment spreads through financial markets. The USDJPY pair has tumbled lower during Friday’s European trading session, as investors move into the safety of the Japanese yen currency. Traders will likely remain focused on falling global equity markets and rising Italian bond-yields during the US trading session.
The USDJPY pair is intraday bearish while trading below the 110.00 level, key support is now found at the 109.00 and 108.62 levels.
Key intraday resistance for the USDJPY pair is currently located at the 110.25 and 110.40 levels.
EURUSD Only Bullish Above 1.1750 Level
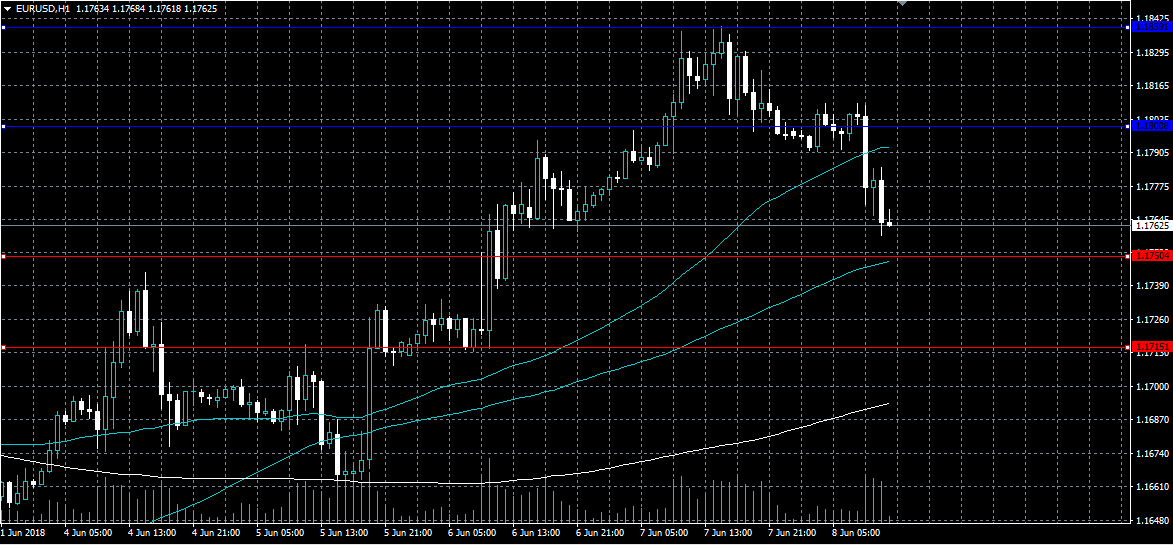
The euro has come under heavy selling against the US dollar, hitting 1.1760, after worse than expected German economic data and rising Italian bond-yields sparked a sell-off in the single currency. The EURUSD currently trades close to session lows, as risk-off trading sentiment pushes the pair closer to critical support. Euro sellers will now try to break the key 1.1750 level, while euro buyers will try to push price back above the 1.1800 level.
The EURUSD pair is intraday bearish while trading below the 1.1750 level. Key support is located at the 1.1715 and 1.1680 levels.
If the EURUSD pair holds above the 1.1750 level, buyers will likely push price towards the 1.1800 resistance level.
XAUUSD Intraday Analysis
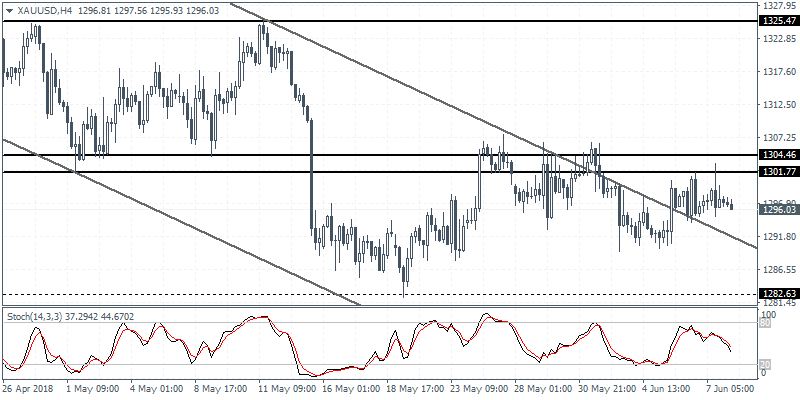
XAUUSD (1296.03): Gold prices have been trading flat and the rather choppy price action continues to show consolidation below the 1301 level of resistance. With price action breaching the outer trend line of the falling price channel, we expect to see this consolidation continue. However, an upside breakout is imminent closer towards next week's FOMC and ECB meetings. A breakout above 1304 - 1301 is likely to signal a correction to the upside targeting 1325.
USDJPY Intraday Analysis
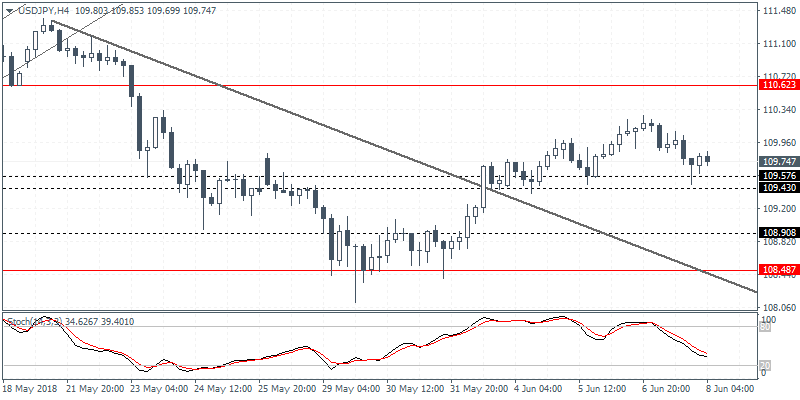
USDJPY (109.74): The USDJPY currency pair drifted lower on Thursday as price action tested the support level of 109.57 - 109.43 as mentioned on Wednesday. With the 4-hour Stochastics pointing to a lower low against a flat price action, the support level is likely to hold. This could post a rebound off the support level sending USDJPY to potentially target the next main resistance level at 110.62. Failure to rally toward the resistance level could likely signal a downside in price
EURUSD Intraday Analysis
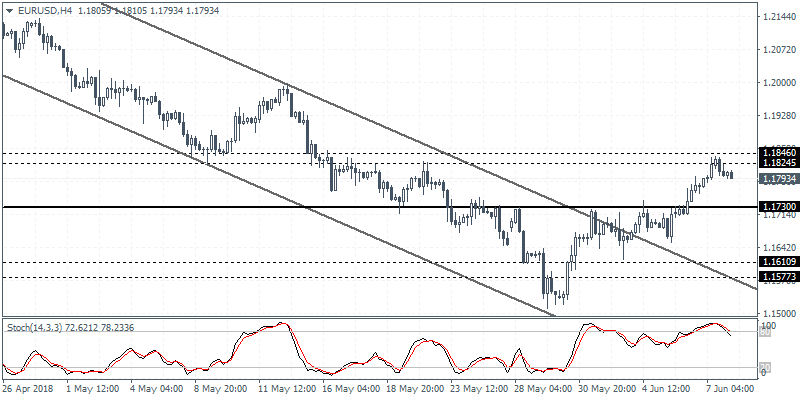
EURUSD (1.1793): The EURUSD currency pair posted gains on Thursday as price action clearly breached the resistance level at 1.1730. However, indications of a hidden bearish divergence on the daily chart suggest a pullback toward 1.1730 to establish support ahead of further gains. To the upside, resistance level near 1.1959 - 1.1920 remains the short-term target. On the 4-hour chart, we could expect to see a minor reversal following the minor resistance level at 1.1846 - 1.1824 region.
Canada Unemployment Rate Expected To Remain Unchanged
The U.S. dollar continued to trade mixed while the euro currency maintained its strong position. Sentiment in the euro remained firm following the ECB's Chief economists comments about a possible discussion on QE exit at next week's meeting.
Sentiment in the U.S. dollar was also subdued with Mexico announcing trade tariffs on exports from the U.S. while the EU is also expected to hit back at the U.S. with a similar response.
On the economic front, the Eurozone fourth quarter GDP was confirmed at 0.4% as widely expected.
Economic data for the day ahead will see the industrial production figures from Germany and trade balance data as well. This is followed by data from France.
The European trading session is relatively quiet with no major releases of impact. In the NY trading session, the Canadian jobs report will be coming out. Economists expect to see the unemployment rate staying unchanged at 5.8% and expect 19.1k jobs that will be added during the month of May.
GBPJPY Makes Big Losses In Near Term, Negative Outlook Remains
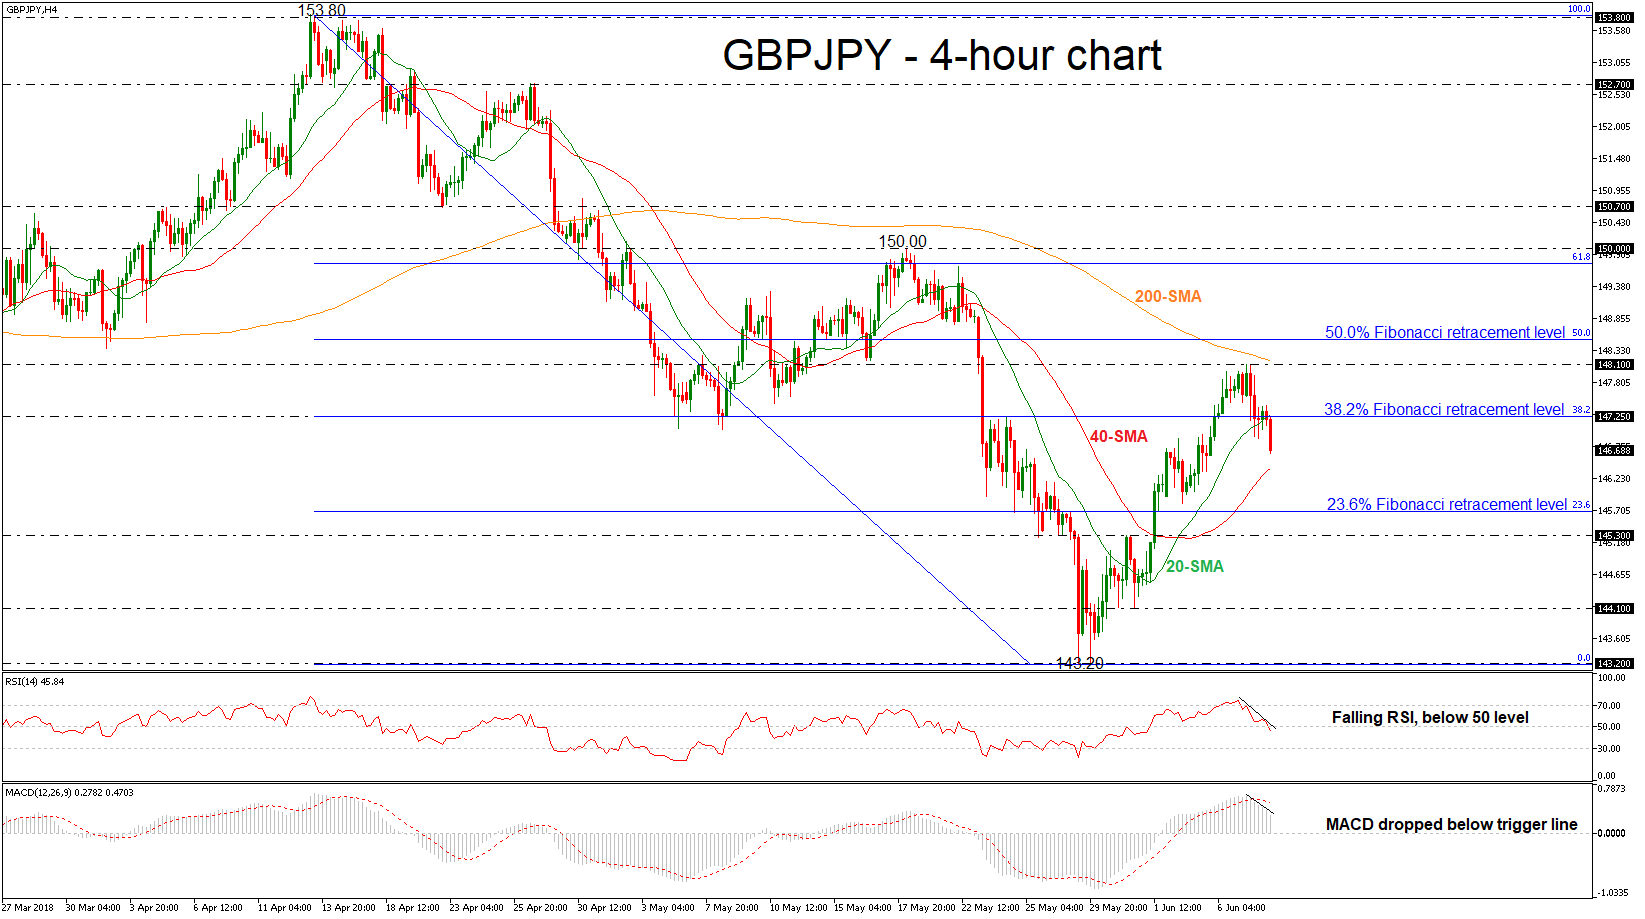
GBPJPY is on course for completing a significant bearish session in the 4-hour chart after its dip below the 38.2% Fibonacci retracement level of the downleg from 153.80 to 143.20, around 147.25. The sharp sell-off, especially since yesterday, has shifted the near-term bias from positive to negative. Also, the momentum indicators are supportive of the bearish picture.
In the near-term, the RSI indicator dipped below the 50 level after it bounced off the overbought area, while the MACD oscillator lies below the trigger but holds above the zero line.
Immediate support is being provided by the 40-simple moving average (SMA) near 146.40. Moreover, should prices dip lower again, the next support would likely come from the 23.6% Fibonacci retracement around 145.70. A drop below this level would signal the start of a deeper bearish phase.
Should the market extend gains, resistance could be met at the 38.2% Fibonacci of 147.25. A break above this area could send prices towards the 148.10 hurdle, which holds near the 200-day SMA. Then, if the market stands above this region, the next stop could be at 50.0% Fibonacci of 148.50.
Overall, in the medium-term, the pair is continuing the negative outlook after the pullback from the 153.80 resistance level on April 13.
USD/CAD V-Shaped Reversal Bounce
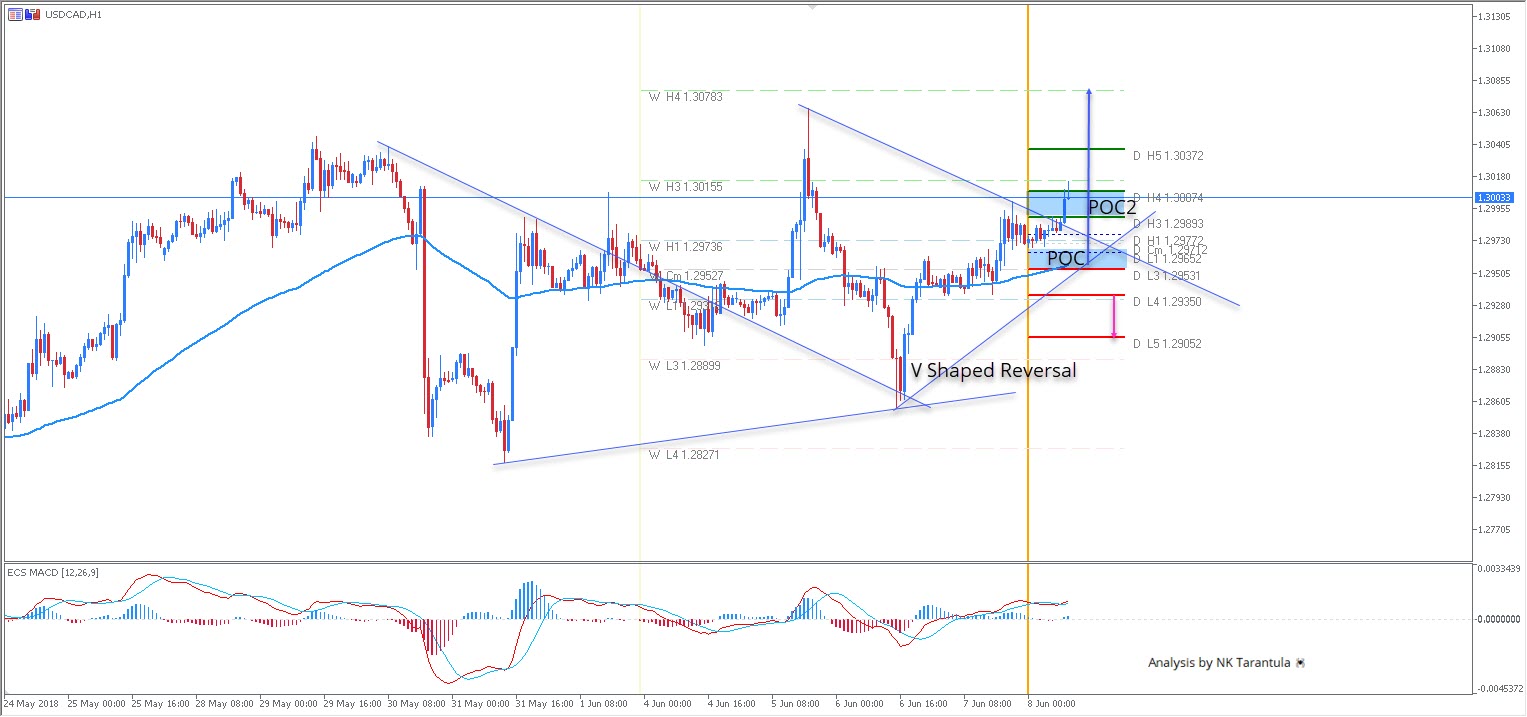
The USD/CAD has dropped towards W L4, where it made a V shaped reversal. At this point, we have a break through the descending trend line that could initiate a move higher. There are 2 bouncing spots POC2 1.2990-1.3000 and POC 1.2950-65. Targets are 1.3035 and 1.3080. A loss of 1.2935 should target 1.2905 and the pair will be stuck in the range.
W L3 - Weekly Camarilla Pivot (Weekly Interim Support)
W H3 - Weekly Camarilla Pivot (Weekly Interim Resistance)
W H4 - Weekly Camarilla Pivot (Strong Weekly Resistance)
D H4 - Daily Camarilla Pivot (Very Strong Daily Resistance)
D L3 – Daily Camarilla Pivot (Daily Support)
D L4 – Daily H4 Camarilla (Very Strong Daily Support)
POC - Point Of Confluence (The zone where we expect price to react aka entry zone)
Forex Technical Analysis: EUR/USD, USD/JPY, GBP/USD
EUR/USD
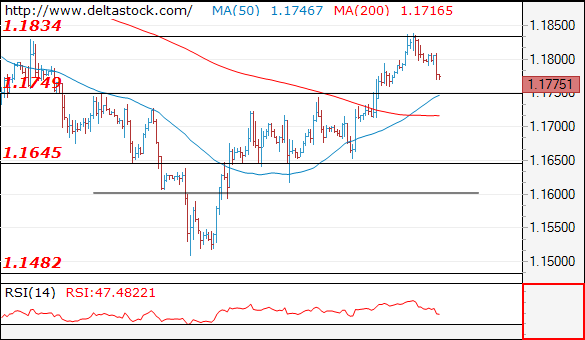
Current level - 1.1775
The upmove peaked precisely at 1.1830 resistance and the bias is already bearish, for a test of 1.1750. I favor a break through the mentioned support to allow a dip to 1.1650. Minor intraday resistance lies at 1.1790.
| Resistance | Support | ||
| intraday | intraweek | intraday | intraweek |
| 1.1790 | 1.1830 | 1.1750 | 1.1480 |
| 1.1830 | 1.2060 | 1.1650 | 1.1300 |
 USD/JPY
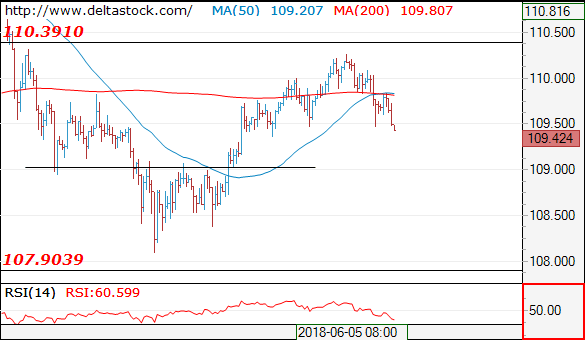
Current level - 109.42
A reversal has been confirmed at 110.25 and the bias is bearish, for a test of 109.00, en route to 107.80 zone. Immediate resistance comes at 109.85.
| Resistance | Support | ||
| intraday | intraweek | intraday | intraweek |
| 109.85 | 111.40 | 109.00 | 107.80 |
| 110.40 | 114.40 | 107.90 | 106.70 |
GBP/USD
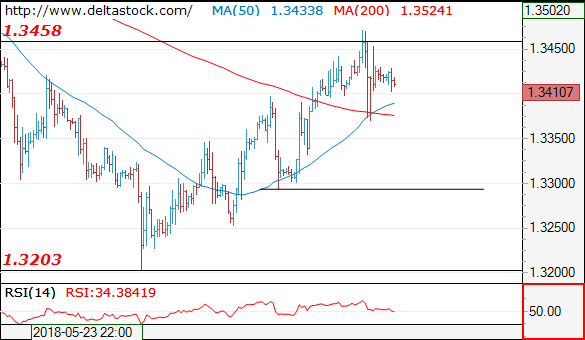
Current level - 1.3410
The test of 1.3460 failed and the outlook is bearish, for a slide towards 1.3290.
| Resistance | Support | ||
| intraday | intraweek | intraday | intraweek |
| 1.3460 | 1.3618 | 1.3380 | 1.3210 |
| 1.3620 | 1.3990 | 1.3290 | 1.3040 |
10 Year US Notes And USDJPY A Reversing Perfectly
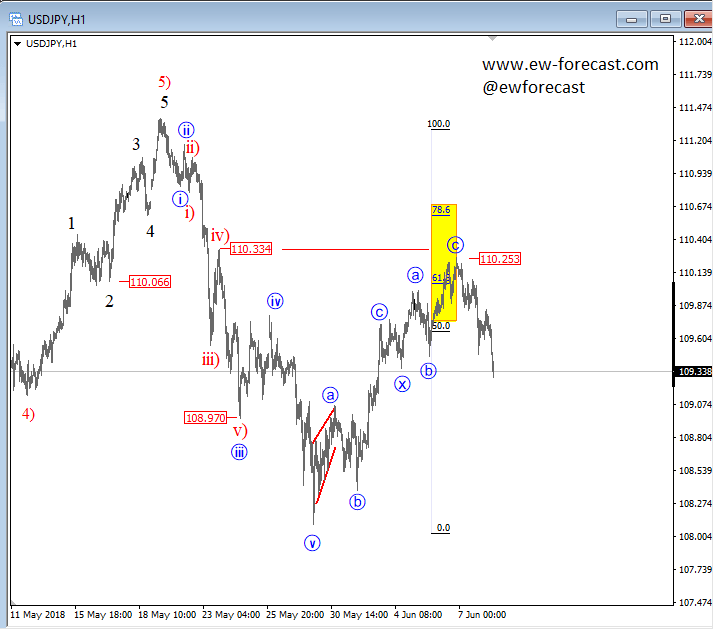
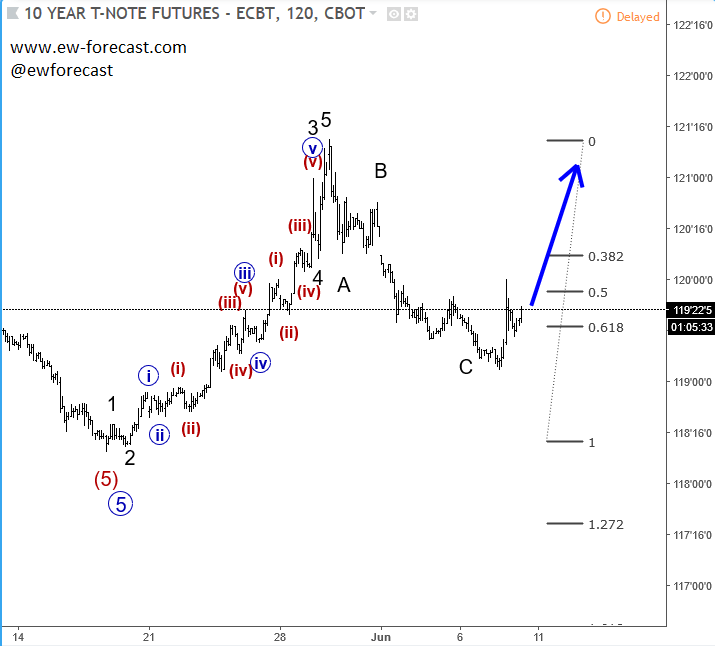
We have seen some reversal higher on 10 year US note yesterday which is causing some serious JPY strength for the last two sessions. We noticed some very important reversals on USDJPY and AUDJPY pairs, and even some other that suggests more JPY gains.
USDJPY is turning perfectly down from our highlighted resistance area, so it can be start of a new bearish leg, especially if pair can close below 109.30 area today. At the same time keep an eye on 10 year US notes where break above 120 will signal for more upside.
USDJPY, 1h