Sample Category Title
Sterling Trading A Tad Lower In The Asian Session
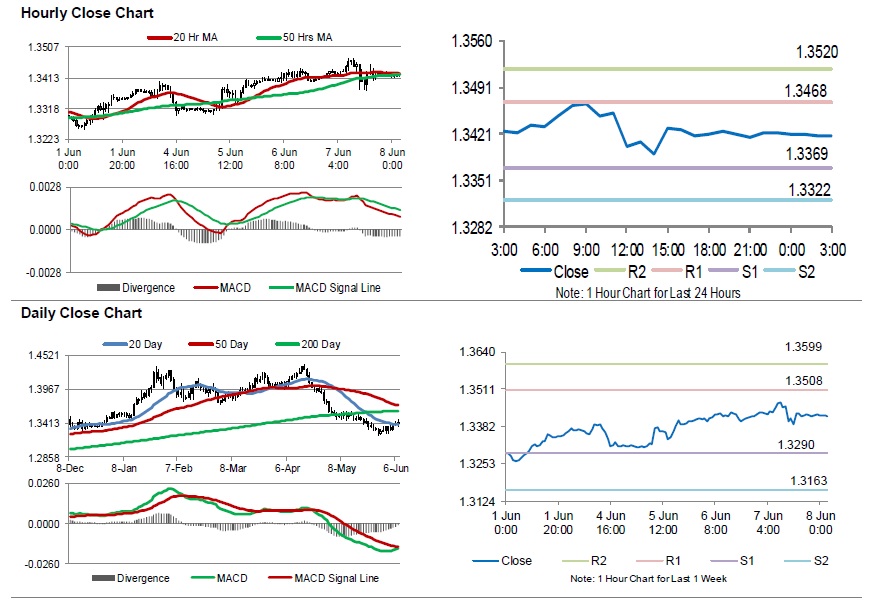
For the 24 hours to 23:00 GMT, the GBP rose slightly higher against the USD and closed at 1.3420.
On the data front, UK’s Halifax house price index rebounded 1.5% on monthly basis in May, beating market expectations for a rise of 1.0%. In the prior month, the index had recorded a fall of 3.1%.
In the Asian session, at GMT0300, the pair is trading at 1.3417, with the GBP trading marginally lower against the USD from yesterday’s close.
The pair is expected to find support at 1.3369, and a fall through could take it to the next support level of 1.3322. The pair is expected to find its first resistance at 1.3468, and a rise through could take it to the next resistance level of 1.3520.
Trading trend in the pair today is expected to be determined by the release of UK’s consumer inflation expectations for May, due to be released in a while.
The currency pair is showing convergence with its 20 Hr and 50 Hr moving averages.
Japan’s Economic Growth Slowed More-Than-Estimated In 1Q 2018
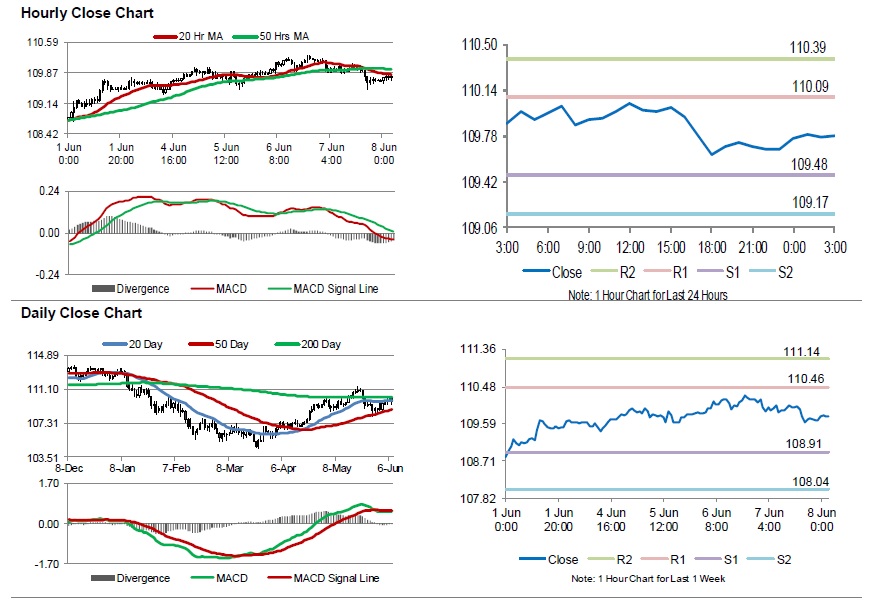
For the 24 hours to 23:00 GMT, the USD declined 0.40% against the JPY and closed at 109.73.
In the Asian session, at GMT0300, the pair is trading at 109.78, with the USD trading 0.05% higher from yesterday's close.
The Japanese yen declined against the USD, after the nation's final annualised gross domestic product (GDP) recorded a drop of 0.6% on a quarterly basis in the first quarter of 2018, confirming the preliminary print. In the previous quarter, GDP had registered a revised rise of 0.6%, while market participants had expected a fall of 0.4%.
Moreover, the nation's trade surplus (BOP basis) narrowed more-than-expected to ¥573.80 billion in April, following a surplus of ¥1190.70 billion in the prior month. Markets had anticipated the nation's trade surplus to narrow to ¥742.30 billion.
The pair is expected to find support at 109.48, and a fall through could take it to the next support level of 109.17. The pair is expected to find its first resistance at 110.09, and a rise through could take it to the next resistance level of 110.39.
Looking forward, traders would focus on Japan's machine tool orders, industrial production and interest rate decision, all set to release next week.
The currency pair is showing convergence with its 20 Hr moving average and trading below its 50 Hr moving average.
Switzerland’s Unemployment Rate Fell In Line With Expectations In May
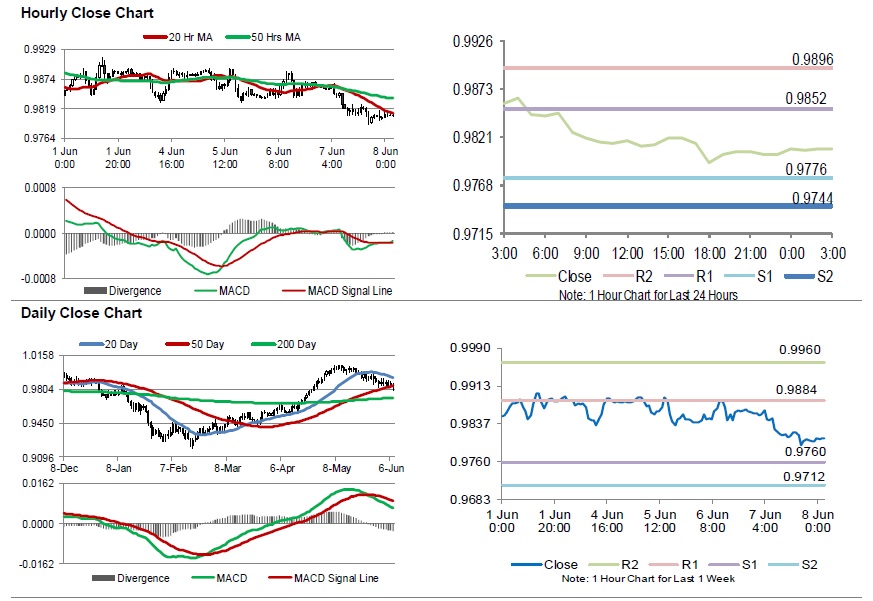
For the 24 hours to 23:00 GMT, the USD declined 0.56% against the CHF and closed at 0.9805.
Macroeconomic news indicated that Switzerland's seasonally adjusted unemployment rate declined to 2.6% in May, at par with market expectations and hitting its lowest reading since 2008. In the prior month, unemployment rate had recorded a level of 2.7%.
In the Asian session, at GMT0300, the pair is trading at 0.9807, with the USD trading marginally higher against the USD from yesterday's close.
The pair is expected to find support at 0.9776, and a fall through could take it to the next support level of 0.9744. The pair is expected to find its first resistance at 0.9852, and a rise through could take it to the next resistance level of 0.9896.
The currency pair is showing convergence with its 20 Hr moving average and trading below its 50 Hr moving average.
Loonie Trading A Tad Higher In The Morning Session
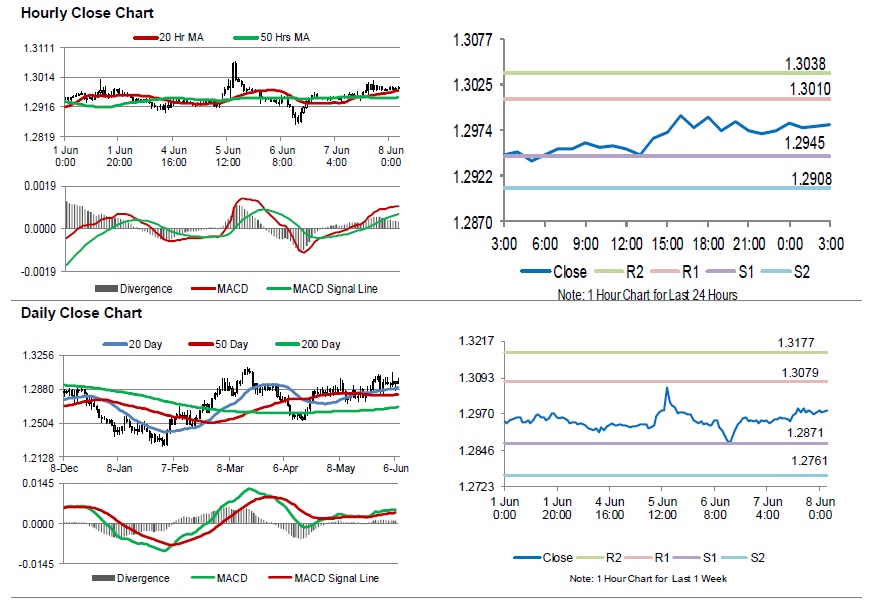
For the 24 hours to 23:00 GMT, the USD rose 0.30% against the CAD and closed at 1.2984.
In the Asian session, at GMT0300, the pair is trading at 1.2981, with the USD trading slightly lower against the USD from yesterday’s close.
The pair is expected to find support at 1.2945, and a fall through could take it to the next support level of 1.2908. The pair is expected to find its first resistance at 1.3010, and a rise through could take it to the next resistance level of 1.3038.
Going ahead, investors would closely monitor Canada’s Housing starts data and unemployment rate both for May, slated to release later in the day.
The currency pair is showing convergence with its 20 Hr moving average and trading above its 50 Hr moving average.
Aussie Extends Losses In The Morning Session
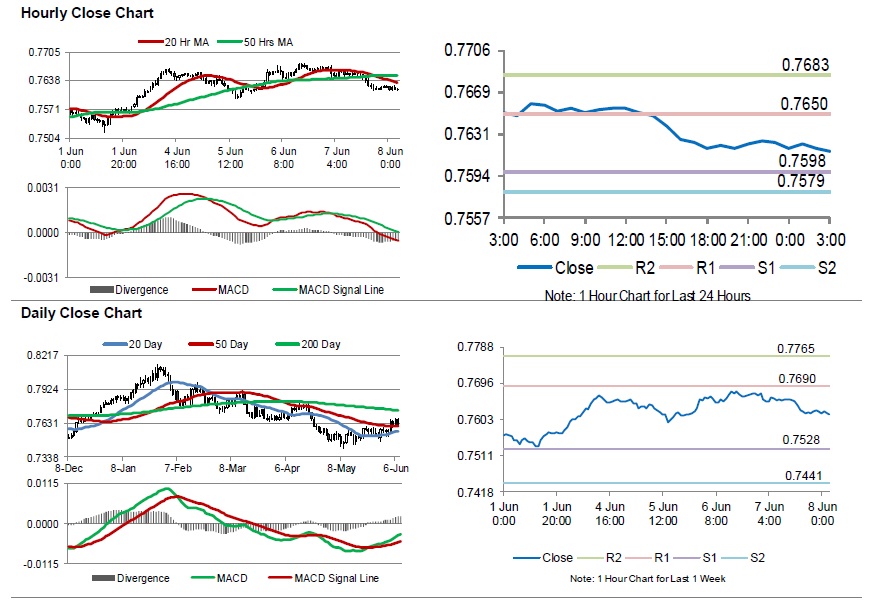
For the 24 hours to 23:00 GMT, the AUD declined 0.64% against the USD and closed at 0.7619.
LME Copper prices rose 1.38% or $98.5/MT to $7245.0/MT. Aluminium prices rose 0.58% or $13.5/MT to $2331.0/MT.
In the Asian session, at GMT0300, the pair is trading at 0.7616, with the AUD trading slightly lower against the USD from yesterday’s close.
Meanwhile, in China, Australia’s largest trading partner, trade surplus unexpectedly narrowed to $24.9 billion in May, compared to a revised surplus of $28.4 billion in the previous month.
The pair is expected to find support at 0.7598, and a fall through could take it to the next support level of 0.7579. The pair is expected to find its first resistance at 0.765, and a rise through could take it to the next resistance level of 0.7683.
Moving ahead, investors would look forward to the release of Australia’s Westpac consumer confidence index and unemployment rate, due next week.
The currency pair is trading below its 20 Hr and 50 Hr moving averages.
Gold: Yellow Metal Extends Losses This Morning
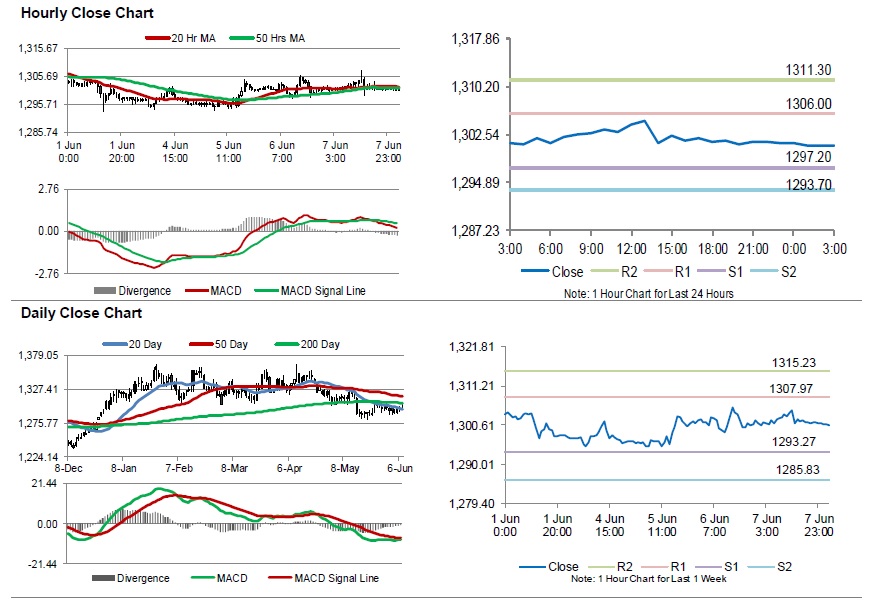
For the 24 hours to 23:00 GMT, Gold declined 0.03% against the USD and closed at USD1301.50 per ounce.
In the Asian session, at GMT0300, the pair is trading at 1300.70, with gold trading 0.06% lower against the USD from yesterday’s close.
The pair is expected to find support at 1297.20, and a fall through could take it to the next support level of 1293.70. The pair is expected to find its first resistance at 1306.00, and a rise through could take it to the next resistance level of 1311.30.
The yellow metal is showing convergence with its 20 Hr and 50 Hr moving averages.
Silver: White Metal Trading On A Weaker Footing This Morning
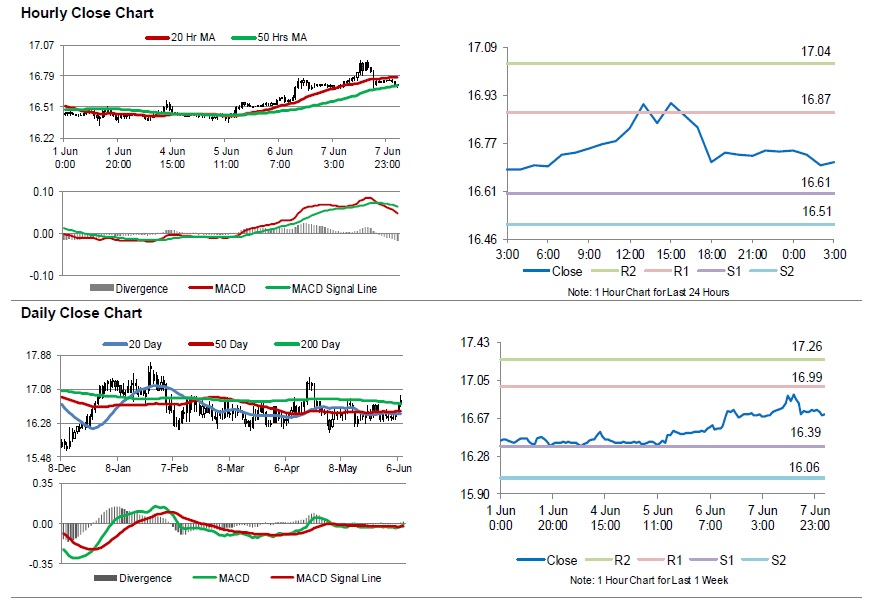
For the 24 hours to 23:00 GMT, Silver rose 0.12% against the USD and closed at USD16.74 per ounce.
In the Asian session, at GMT0300, the pair is trading at 16.71, with silver trading 0.15% lower against the USD from yesterday’s close.
The pair is expected to find support at 16.61, and a fall through could take it to the next support level of 16.51. The pair is expected to find its first resistance at 16.87, and a rise through could take it to the next resistance level of 17.04.
The white metal is trading below its 20 Hr moving average and showing convergence with its 50 Hr moving average.
Crude: Oil Trading On A Stronger Footing, Ahead Of Baker Hughes Weekly Rig Count Data
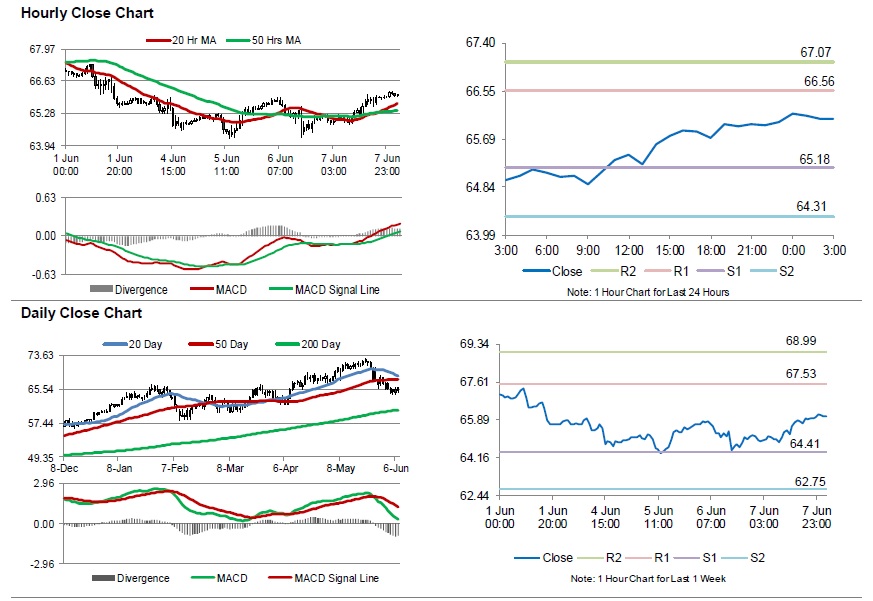
For the 24 hours to 23:00 GMT, Crude Oil rose 1.10% against the USD and closed at USD65.93 per barrel, amid concerns over Venezuela’s oil supply.
In the Asian session, at GMT0300, the pair is trading at 66.06, with oil trading 0.20% higher against the USD from yesterday’s close.
The pair is expected to find support at 65.18, and a fall through could take it to the next support level of 64.31. The pair is expected to find its first resistance at 66.56, and a rise through could take it to the next resistance level of 67.07.
Crude oil is trading above its 20 Hr and 50 Hr moving averages.
FOMC Preview: A Step Closer To Neutral
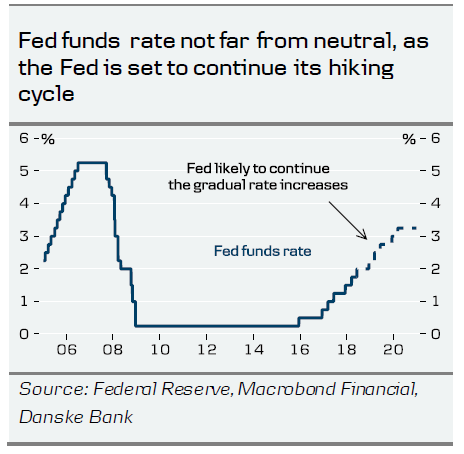
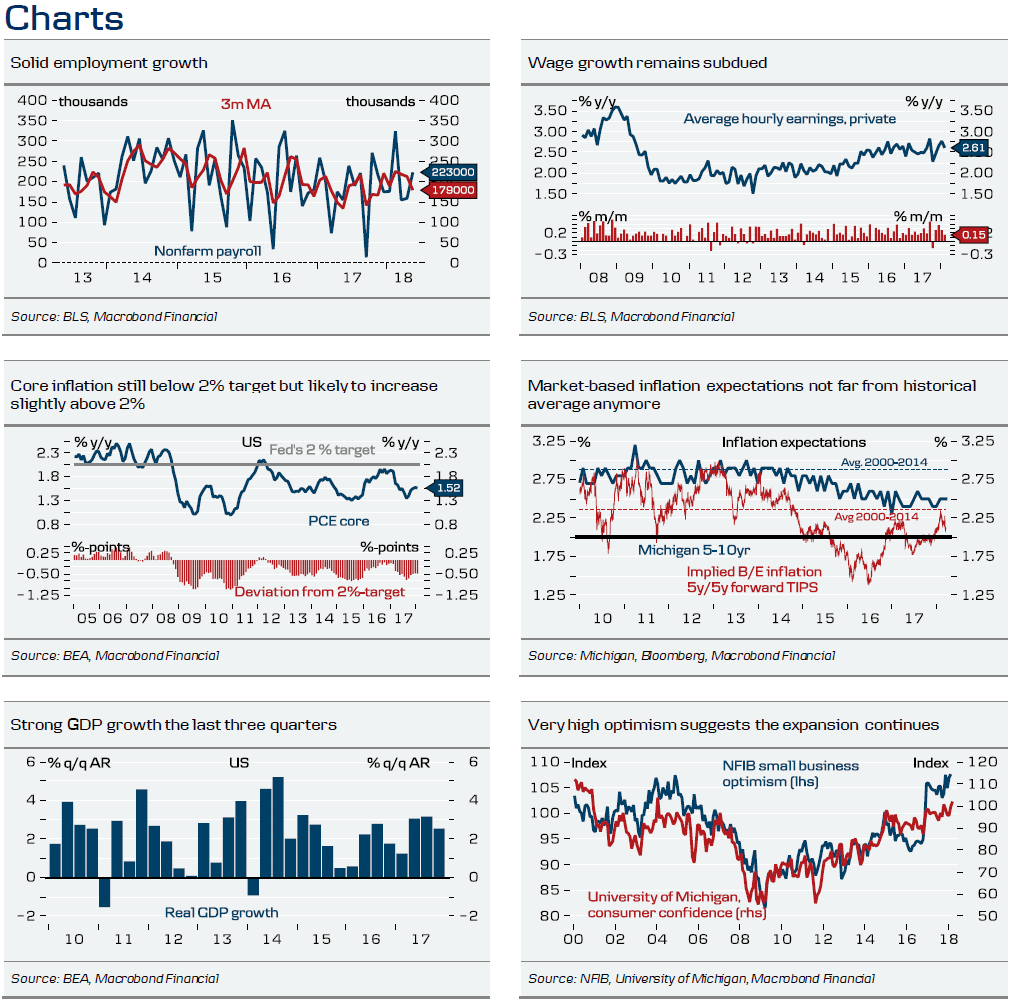
- We expect the Fed to hike the target range by 25bp to 1.75%-2.00% next week without making big changes to the dot plot.
- The Fed is set to recognise that the Fed funds rate is close to the longer-run dot by stating 'monetary policy is modestly accommodative' (modestly being a new word), which is not a change in policy strategy; it just reflects the hiking cycle has come a long way.
- We still forecast three hikes this year with risk skewed towards four.
- Fed is adding to carry appeal of the USD and we look for EUR/USD to remain in the 1.15-1.21 range on a 6M horizon (see page 2).
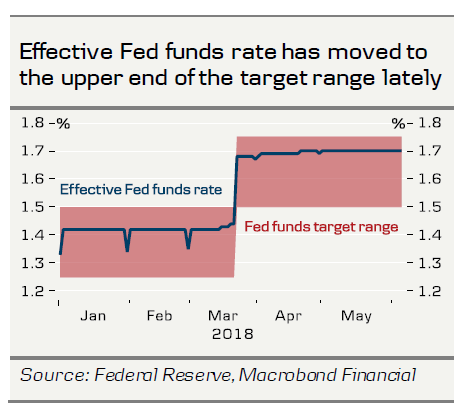
In line with consensus and market pricing, we expect the Fed to hike the target range by 25bp to 1.75-2.00% at next week's meeting (the interest rate on excess reserves (IOER) has usually been at the high end of the range but is likely to be hiked by only 20bp as a technical adjustment).
We do not think the Fed is going to make big changes to its current dot plot and it will continue to show a more or less even split between those signalling three or four hikes this year. As only one member needs to raise its dot from three to four hikes, one should not necessarily interpret it as a hawkish signal if the median dot is lifted from three to four hikes. At least a couple of committee members need to upgrade their outlook before we would interpret it as a hawkish shift. The Fed has adopted, at least in the short run, a de facto price level target in the sense that it has explicitly stated that it can tolerate inflation to overshoot 2% temporarily, as inflation has undershot the 2% target for a long time. We think that the updated inflation projection will still reflect this view and that it is unlikely that members, who signalled four hikes in March, are going to lift their dots from 4 to 5 hikes. The median dot for 2019 is likely unchanged at three more hikes and the Fed will continue to signal that it will raise the Fed funds rate above the natural rate, as it times to hit the brakes due to more expansionary fiscal policy. Our base case is one additional hike in December but the risk is skewed towards two hikes (i.e. three hikes this year with risk skewed towards four).
As we are moving closer to the Fed's estimate of the natural rate of interest (where monetary policy is neither expansionary nor contractionary, currently estimated at 2.875%), we think the Fed is going to change its statement by stating: ‘The stance of monetary policy remains MODESTLY accommodative [...]'. This is not a change in the Fed's p olicy strategy , as it is more or less on autop ilot, but it reflects that the hiking cycle has lasted for a while now and we are not many hikes away from the longer-run dot. Already last year, former Fed chair Janet Yellen said monetary policy was close to being neutral. However, markets may interpret this as dovish, as it could be seen as a sign that the Fed is soon done hiking. We disagree and still believe markets are priced too softly further out the curve. Otherwise, we do not expect any major changes to the statement, as the Fed will repeat it will continue its gradual hiking cycle.
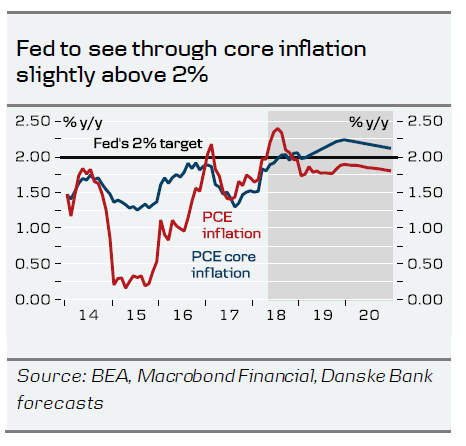
In the Q&A, we are mostly interested in questions about the target for the future level of the balance sheet (QT is open-ended at the moment) and whether the Fed has started a more formal investigation of pros and cons of shifting target officially to a price level target. In addition, it will be important to monitor whether a 20bp hike of IOER instead of 25bp will be sufficient to reign in the effective Fed funds rate and bring it closer to the middle of the target range. Alternatively, if the Fed has considered other measures to regain control of it.
FX: Fed adding to carry appeal of USD
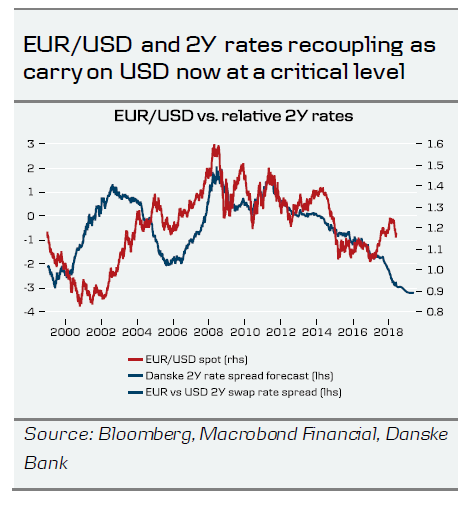
While a Fed June hike is widely expected and as such should not give rise to a significant market reaction, a key issue will be whether markets sense that the Fed is closer to being done on hikes. We do not think that is the case and maintain that the market is pricing the Fed too softly beyond 2018. To the extent that the recent recoupling between the USD and US yields continues, this suggests that the USD will stay supported for some time still. Indeed, the carry on long USD positions appears to have reached a key threshold, yielding around 3% p.a. versus the EUR, which in our view makes it likely that relative rates are likely to stick around as driver. As such, our sense of a Fed on autopilot should merely add to the carry appeal of the USD at the June meeting. Adding a hesitant ECB, which we think is unlikely to make an announcement in June on ending QE, the recent rebound in EUR/USD should be halted by the two central banks next week. We look for broadly the 1.15-1.21 range to be sustained on a 6M horizon.
Elliott Wave Analysis: EURUSD May See Profit Taking Soon
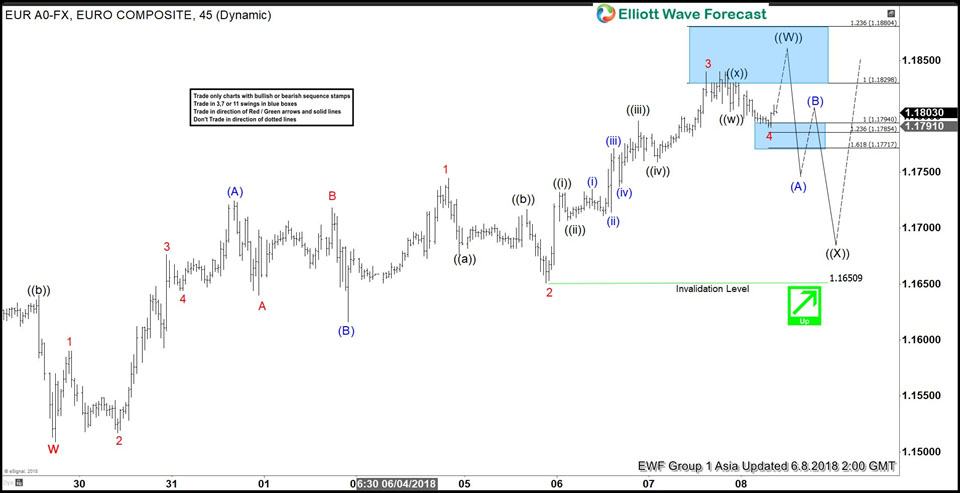
EURUSD short-term Elliott wave view suggests that the decline to 1.1509 on 5/29/2018 low ended Cycle degree wave “w”. Above from there, the bounce is taking place as Elliott wave zigzag structureto end the Primary degree wave ((W)) cycle. Afterwards, the pair is expected to do a pullback in Primary degree wave ((X)) in 3, 7 or 11 swings before further upside is seen.
The Zigzag structure is the most common 3 waves corrective pattern, which is labeled as A, B, C. The internal oscillation of swings consists of a 5-3-5 structure where wave A & C unfold in 5 waves, while wave B can any 3 waves corrective pattern. In EURUSD case, the Intermediate wave (A) of ((W)) unfolded in 5 waves structure where Minor wave 1 ended 1.159 high, Minor wave 2 ended at 1.1517, Minor wave 3 ended at 1.1676, Minor wave 4 ended at 1.1644 and bounce to 1.1724 ended Minor wave 5 of (A).
Down from there, the pullback to 1.1616 low ended Intermediate wave (B) as Zigzag structure where Minor wave A ended at 1.1640, Minor wave B ended at 1.1718 and Minor wave C of (B) completed at 1.1616. Up from there, Intermediate wave (C) of ((W)) remains in progress as another 5 waves structure which has already reached the 100%-123.6% Fibonacci extension area of Intermediate wave (A)-(B) at 1.1830-1.1880. Therefore, the pair has reached the minimum extension area already. However, while it stays above 1.1650 low, the pair has scope to see 1 more marginal push higher within blue box area to complete Primary wave ((W)) higher. Then it should do a pullback in primary wave ((X)) in 3, 7 or 11 swings before further upside is seen. We don’t like selling the pair in the proposed pullback.
EURUSD 1 Hour Elliott Wave Chart