Sample Category Title
Bitcoin Weakening
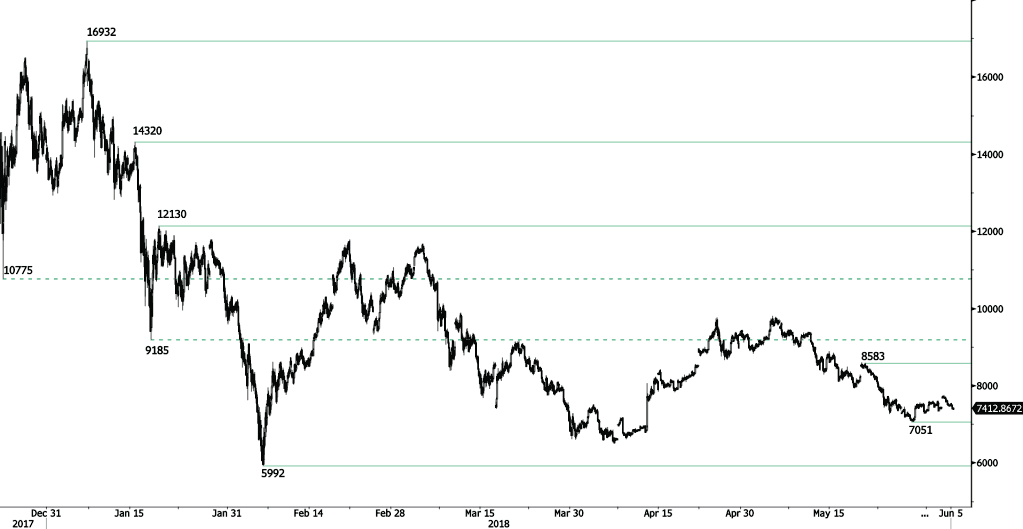
Bitcoin is declining after reaching 7753, approaching the 7350 range. The pair is further contained between support and resistance given at 7051 (29/05/2018 low) and 8583 (21/05/2018 high). The technical structure suggests shortterm decrease.
In the long-term, the digital currency has had an exponential growth but also presented important downturns. There is decent likelihood that the currency could stabilize between 7'000 - 12'000 in 2018. Bitcoin is trading below its 200 DMA (8800 range).
CRUDE OIL Trading Above 65
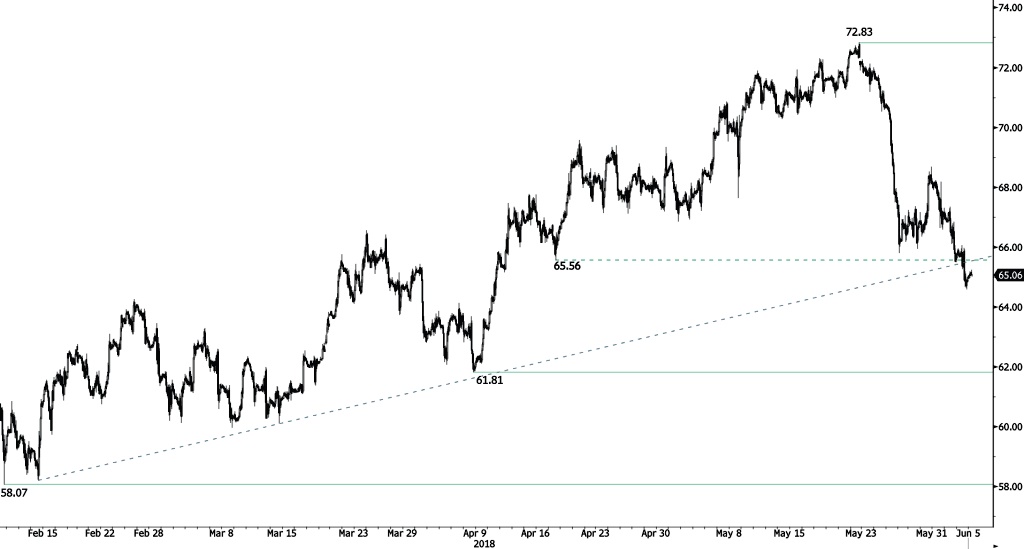
Crude oil is bouncing off from 64.57 low, heading along 65.70. Hourly support and resistance are given at 61.81 (06/04/2018 low) and 72.83 (22/05/2018 high). The technical structure suggests short-term increase.
In the long-term, crude oil has recovered after its sharp decline last year. However, we consider that further weakness is very likely. For the time being, the pair lies in an upside trend since June 2017. Support lies at 42.20 (16/11/2016) while resistance is located at 77.83 (20/11/2014). Crude oil is trading largely above its 200 DMA.
SILVER Continued Consolidation
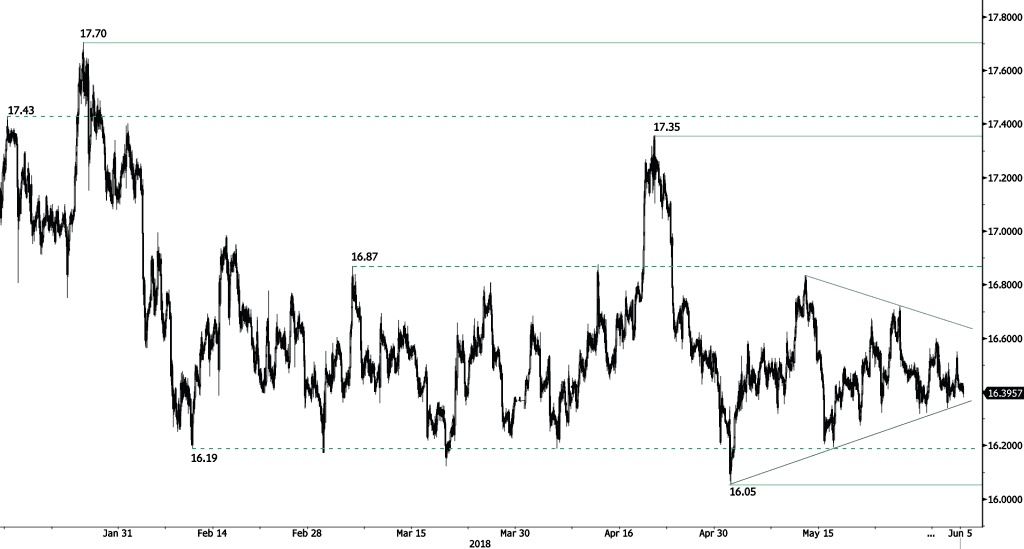
Silver has bounced. The short-term succession of higher lows continues to favour a bullish bias as long as uptrend floor holds. Hourly support and resistance are given at 16.05 (01/05/2018 low) and 17.35 (19/04/2018 high). The technical structure suggests short-term consolidation.
In the long-term, the trend remains negative/ sideways. Further downside is very likely. Resistance is located at 21.58 (10/07/2014 high). Strong support can be found at 11.75 (20/04/2009). The pair is trading below its 200 DMA.
GOLD Maintained Above 1290
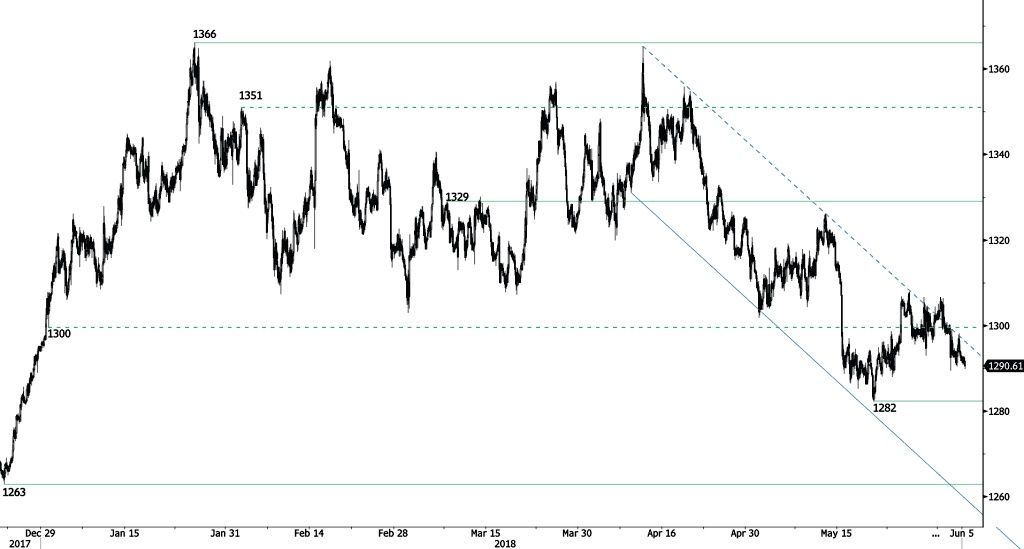
Gold stabilizes around 1290, trading sideways. Hourly support and resistance are given at 1282 (21/05/2018 low) and 1329 (08/03/2018 high). The technical structure suggests further short-term sideways trading moves.
In the long-term, the technical structure suggests that there is a growing upside momentum. A break of 1'392 (17/03/2014) is required to confirm it. A major support can be found at 1'045 (05/02/2010 low). The pair is trading below its 200 DMA.
EUR/CHF Bearish Pressures
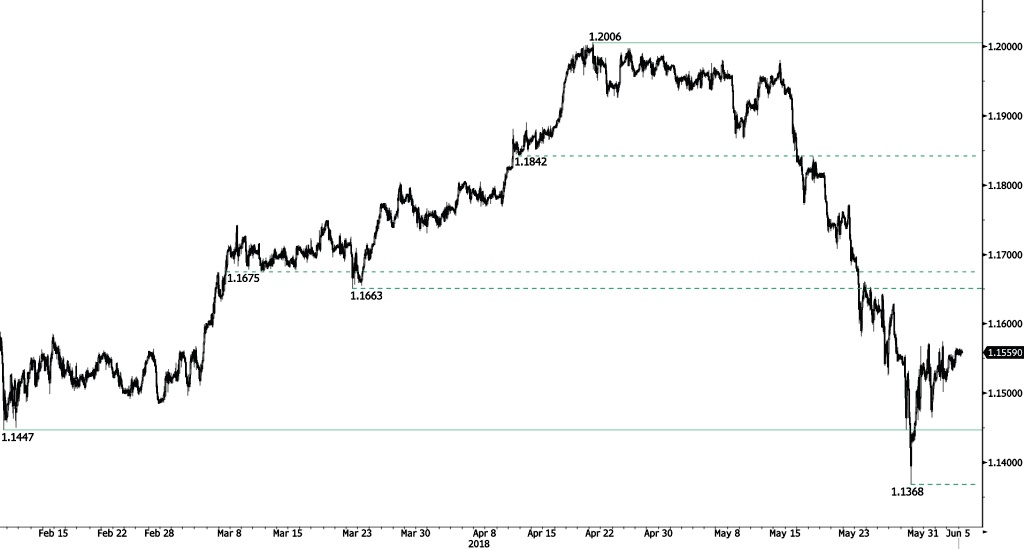
EUR/CHF bounce stops, the pair is maintained along 1.155. EUR/CHF weakness is maintained, confirming an underlying bearish trend. Hourly support and resistance are given at 1.1447 (08/02/2018 low) and 1.2006 (20/04/2018 high). The technical structure suggests short-term sideways trading moves.
In the longer term, the technical structure has reversed. Strong resistance at 1.20 (level before the unpeg) is now at reach. The ECB's slowing QE program is likely to cause buying pressures on the euro, which should weigh in favour of the EUR/CHF. Support and resistance can be found at 1.0624 (24/06/2016 low) and 1.2097 (18/12/2014 high).
EUR/GBP Declining
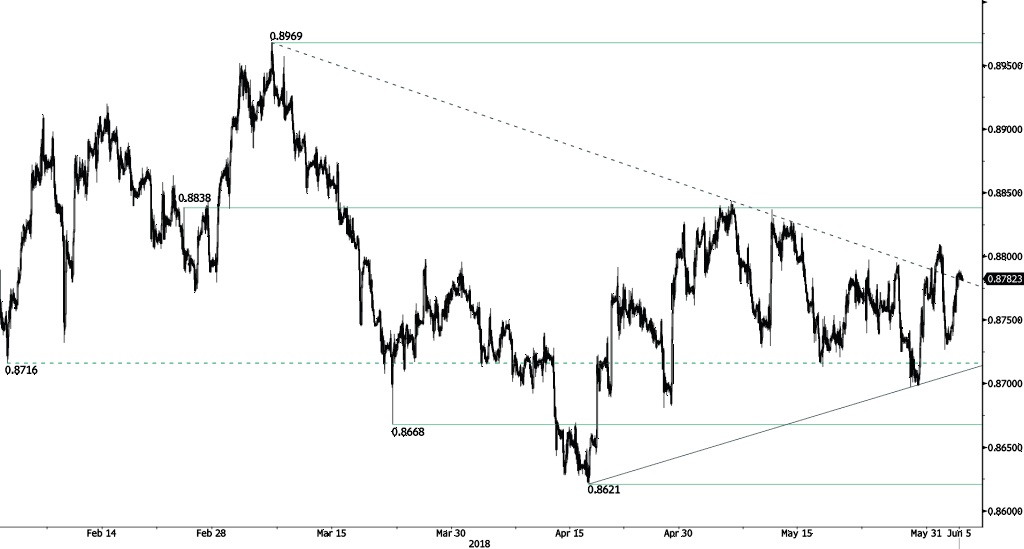
EUR/GBP recovery phase stops, the pair is trading lower, heading along 0.8771. Hourly support and resistance are given at 0.8668 (22/03/2018 low) and 0.8838 (23/02/2018 high). The technical structure suggests short-term decrease.
In the long-term, the pair has largely recovered from 2015 lows. The technical structure suggests further upside pressure. Strong resistance can be found at 0.9500 (psychological level) while support remains at 0.8304 (05/12/2016 low). The pair is trading below its 200 DMA.
AUD/USD Bearish Pressures
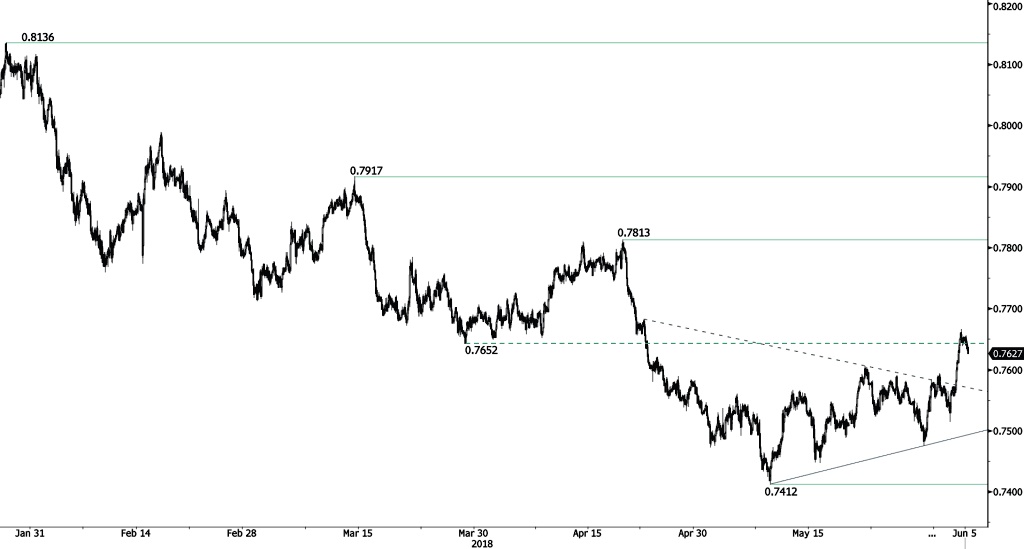
AUD/USD is declining after reaching 0.7666, heading along 0.7620. A break of the strong resistance at 0.7917 (14/03/2018 high) is needed to invalidate the current short-term bearish bias. Hourly support remains at 0.7412 (09/05/2018 low). The technical structure suggests short-term downward moves.
In the long-term, the upward trend slows down after failing to reach key resistance at 0.8164 (14/05/2015 low). Key support stands at 0.6011 (28/10/2008 low). A break of the key resistance at 0.8164 (14/05/2015 high) is needed to invalidate our long-term bearish view.
USD/CAD Weak Bounce
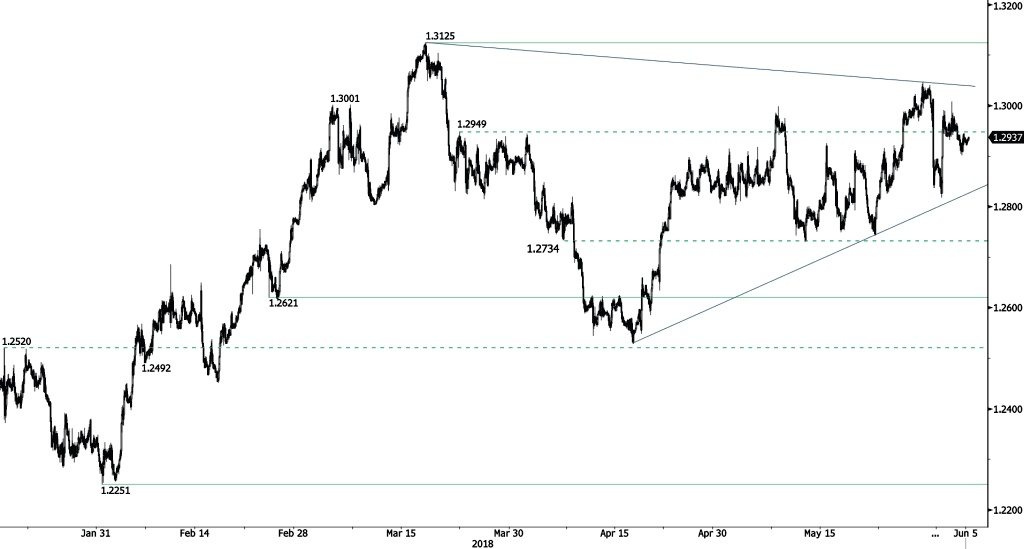
USD/CAD is trading sideways, maintained at 1.2935. Hourly support and resistance are located at 1.2621 (23/02/2018 low) and 1.3125 (19/03/2018 high). The technical structure suggests short-term sideways trading moves.
In the longer term, the pair is trading between resistance point at 1.3805 (05/05/2017 high) and support at 1.2128 (18/06/2015 low). Strong resistance is given at 1.4690 (22/01/2016 high). The pair is likely to head lower. The pair is trading above its 200 DMA
USD/CHF Slight Increase
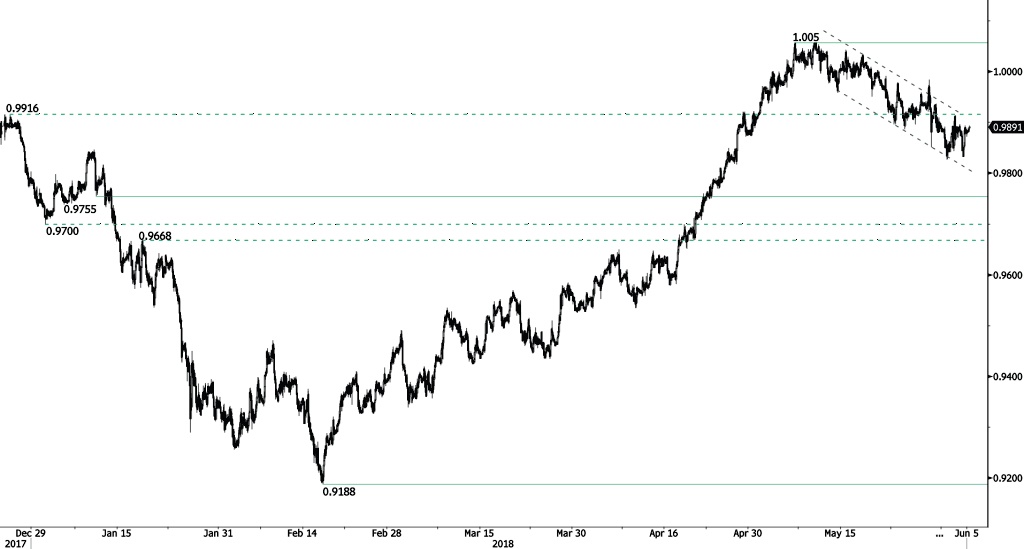
USD/CHF is increasing, trading above 0.9890 and heading along 0.99. The bearish pattern started in May 2018 is maintained. Key support and resistance given at 0.9755 (10/01/2018 low) and 1.01 (11/05/2017 high) are maintained. The technical structure suggests short-term upward moves.
In the long-term, the pair is still trading in range since 2011 despite some turmoil when the SNB unpegged the CHF. Key support lies at 0.9072 (07/05/2015 low) while resistance at 1.0344 (15/12/2016 high) is distanced. The technical structure favours a long term bullish bias since the unpeg in January 2015.
USD/JPY Strengthening
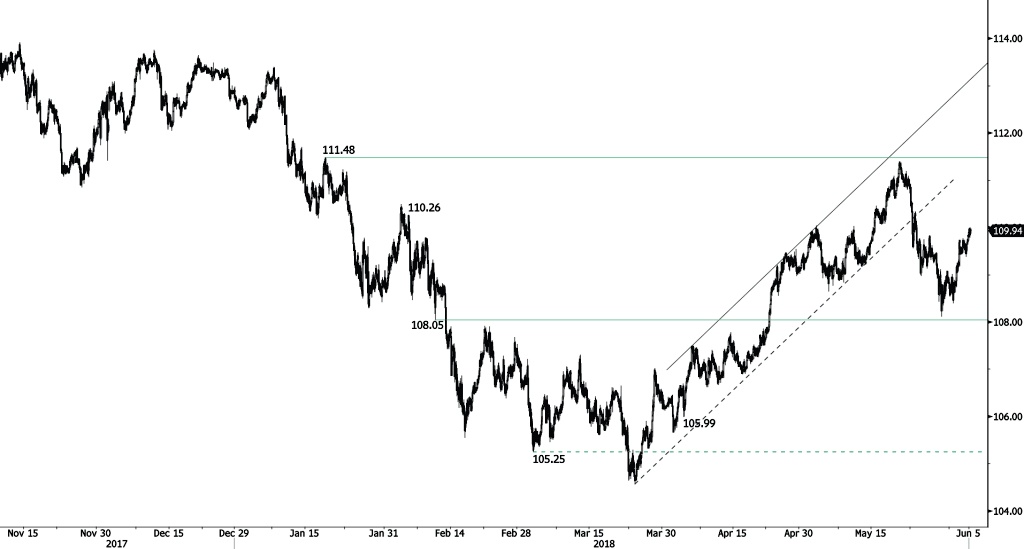
USD/JPY strong bounce from 108.39 (31/05/2018 low) starts back, trading above 109.95 and approaching 110.05. Strong support and resistance are located at 108.05 (09/02/2018 low) and 111.48 (18/01/2018 high). The technical structure suggests short-term increase.
We favor a long-term bearish bias. A gradual rise towards major resistance at 125.86 (05/06/2015 high) seems unlikely. The pair is expected to decline further along long-term support at 101.20 (09/11/2016 low). The pair trades slightly below its 200 DMA.