Sample Category Title
EUR/CHF Daily Outlook
Daily Pivots: (S1) 1.1531; (P) 1.1548; (R1) 1.1574; More....
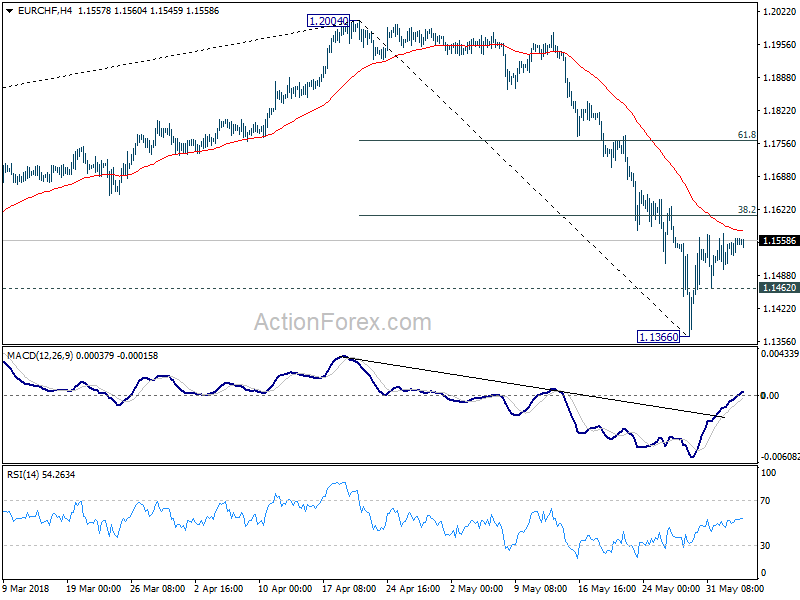
EUR/CHF is staying in correction from 1.1366 and intraday bias remains neutral. In case of stronger recovery, upside should be limited by 38.2% retracement of 1.2004 to 1.1366 at 1.1610 to bring fall resumption. Below 1.1462 minor support will bring retest of 1.1366 first. Break will resume decline from 1.2004 and target t next key support zone between 1.1154 and 1.1198.
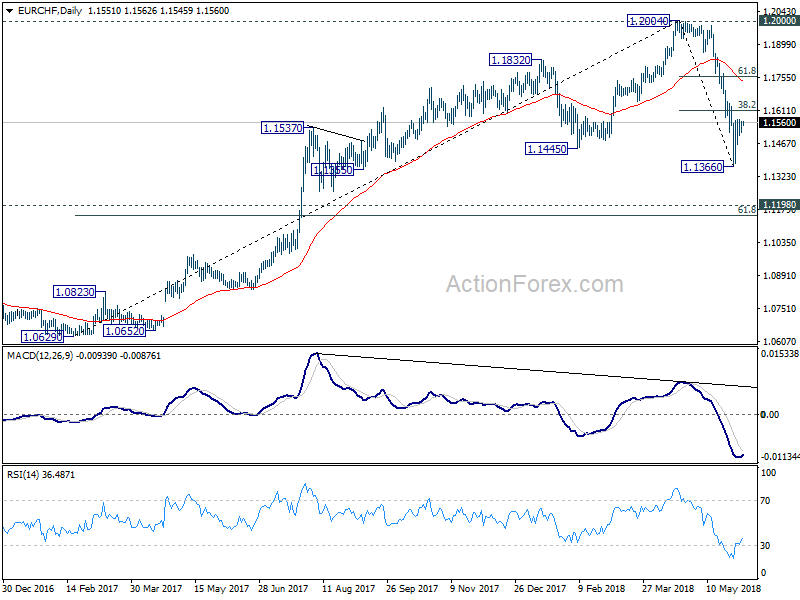
In the bigger picture, current development suggests solid rejection by prior SNB imposed floor at 1.2000. Considering bearish divergence condition in daily and weekly MACD, 1.2004 should be a medium term top. And price action from 1.2004 is correcting the up trend from 1.0629. Deeper fall would be seen to key cluster level at 1.1198 (2016 high), 61.8% retracement of 1.0629 to 1.2004 at 1.1154. We'd expect strong support around there to contain downside and bring rebound.
Markets Searching For New Catalyst
U.S. equities kicked off the trading week with two indices, the Nasdaq Composite and the Russell 2000, hitting new record highs.Thisimpressive performance is a continuation of Friday’s rally following theU.S. jobsreportshowingthat the economy is firing on all cylinders. Easing fears from Italy’s political situation after theformation ofa coalition government also revived appetite forrisk. However, Europe’s problems are not over yet; although the U.S. jobsreport beat forecasts it shouldn’t have been a big surprise given the improvement seen previously in the labor market. What surprises me the most is investor complacency towardsPresident Trump’s decision on imposing steep tariffs on metals imported from the U.S.’s closest allies.
Trade wars cannot be ignored, and you don’t need a Ph.D. degree in economics to know that they will severely hurt the world’s economy. The only explanation for the lack of negative reaction from such headlines is that investors believe Trump will back away after extractingbetter deals from his trading partners. However, nothing is guaranteed here, and the risk of a tit-for-tat tariff spat converting to a full-blown trade war has increased significantly. Unless there are some positive announcements, I think investors will likely shift to a more cautious mode.
Currency markets were trading in tight ranges duringAsian trade. The Euro fell slightly below 1.17, while the Pound and the Yen barely moved. The Aussie was the best performing currency yesterday, rising 1% against the Dollar. Itwas also unmoved by the RBA’s decision to keep policy unchanged.
On the data front, the Eurozone Services PMI is likely to confirm that the economy continued to slow down as it entered Q2. Meanwhile, the U.S. ISM Non-Manufacturing PMI is expected to show sustained expansion in the economy’s largest sector. This should be Dollar-positive overall, especially given that the Fed may start to consider accelerating the pace of interest rate hikes.
Oil prices recovered slightly from yesterday’s fall, but expectations of higher supplies from OPEC may continue to weigh on prices. WTI fell from a high of $72.83 recorded on 22 May to a low of $64.57 yesterday. Whether the fall in prices is just profit-taking or a change in trend will be determined on 22 and 23June when OPEC members meet in Vienna.
Asian Equity Markets Trade Mixed
General Trend:
- Asian equity markets trade mixed; data from Japan and Australia miss expectations
- Chinese airlines move higher on domestic fuel surcharge
- Australia Q1 Current Account and exports data miss ests ahead of Wednesday’s GDP release
- RBA June policy statement generally in line with prior month, noted political situation in Italy and economic developments in emerging markets
- Japan Household Spending unexpectedly declines to start Q2; leads to questions about whether Q1 weakness was really temporary
- Japan May Services PMI eases from 6-month high; new sales rose at softest rate in 20 months
- New Zealand Treasury suggests Q1 GDP growth may miss forecast, notes consumption and international growth
- Philippines May CPI remains above target, but rises less than expected
Headlines/Economic Data
Japan
- Nikkei 225 opened +0.3%; closed +0.3%
- TOPIX Information & Communications index +0.6%, Retail Trade +0.2%, Electric Appliances +0.2%; Securities -1.6%, Real Estate -1%
- (JP) Bank of Japan (BoJ) Dep Gov Wakatabe: No specific policy tool in mind for future use; not thinking of US treasuries for asset buys - parliament
- Toshiba, 6502.JP Confirms to sell 80.1% stake in PC business to Sharp for ¥4.0B; sees minimal impact on FY18 earnings
- Fast Retailing [9983.JP] trades lower following release of May SSS
- (JP) Japan Apr Household Spending y/y: -1.3% v +0.8%e; Japan Govt cuts assessment of consumer spending trend: Weakness can be seen
- (JP) Japan May PMI Composite: 51.7 v 53.1 prior; PMI Services: 51.0 v 52.5 prior
- (JP) Japan MoF sells ¥2.2T v ¥2.2T indicated in 0.1% (prior 0.1%) 10-yr JGB; avg yield 0.048% v 0.046% prior; bid to cover 4.38x v 4.20x prior
Korea
- Kospi opened +0.1%
- LG Display [034220.KR] declines over 1% after speculation that China requested technology transfer related to OLED
- (KR) South Korea May Foreign Reserves: $399.0B v $398.4B prior (record high)
- (KR) South Korea think tank KDI: Govt’s minimum wage hike plan could hinder employment in the upcoming years, underpinning the uneasiness over drastic changes and the consequent impact on the market
- (KR) South Korea Apr Current Account Balance (BoP): $1.8B v $5.2B prior; Goods Balance (BoP): $10.4B v $9.9B prior
- Hynix, 000660.KR Confirms being investigated by China regulators
- (HK) Hong Kong May PMI: 47.8 v 49.1 prior (close to 2-yr low)
China/Hong Kong
- Hang Seng opened 0.0%, Shanghai Composite -0.1%
- Hang Seng Info Tech index +0.8%, Property/Construction +0.7%, Financials flat; Energy -1.6%, Services -0.6%
- (CN) CHINA APR CAIXIN PMI SERVICES: 52.9 V 52.9E; PMI COMPOSITE: 52.3 V 52.3 PRIOR
- (HK) Hong Kong May PMI: 47.8 v 49.1 prior (close to 2-yr low)
- (CN) Airlines in China said to impose fuel surcharge related to domestic flights - US financial press
- (CN) China PBoC Open Market Operation (OMO): To inject CNY120B in 7 and 28-day reverse repos v CNY40B injected in 7 and 28-day reverse repos prior: Net: drain CNY30B v CNY20B injected prior
- (CN) China PBoC sets yuan reference rate at 6.4157 v 6.4208 prior
- (HK) Hong Kong Chief Executive Lam: government concerned by rising property prices
Australia/New Zealand
- ASX 200 opened -0.1%, closed %
- ASX 200 Utilities index -1.8%, REIT -1.7%, Energy -1.3%, Resources -1%, Consumer Discretionary -0.8%; Financials +0.3%
- Fonterra, FCG.NZ Reports Apr collections: Total New Zealand 120.3M v 117.7M y/y; Australia 11.4M v 9.1M y/y
- (NZ) New Zealand 10-month Budget Surplus NZ$159M better than forecasted NZ$3.4B
- (AU) Australia May CBA PMI Composite: 55.6 v 55.3 prior; PMI Services: 55.9 v 55.2 prior
- (AU) AUSTRALIA Q1 BOP CURRENT ACCOUNT BALANCE (A$): -10.5B V -9.9BE; NET EXPORTS OF GDP: 0.30% V 0.50%E
- (NZ) New Zealand Treasury: Q1 GDP may miss budget forecast, to rebound later this year - Monthly Economic Indicators
- Mortgage Choice, [-22%], MOC.AU Consulting with franchisees regarding a remuneration structure review; final terms still being finalized
- (AU) RESERVE BANK OF AUSTRALIA (RBA) LEAVES CASH RATE TARGET UNCHANGED AT 1.50%; AS EXPECTED
Other Asia
- (SG) Singapore May PMI: 56.8 v 55.6 prior (record high)
- (PH) Philippines May CPI y/y: 4.6% v 4.9%e
- (PH) Philippines Central Bank (BSP) Chief Espenilla: Outlook continues to be a concern; will consider what additional adjustments are needed to anchor inflation expectations
North America
- US equity markets ended higher: Dow +0.7%, S&P500 +0.5%, Nasdaq +0.7%, Russell 2000 +0.3%
- S&P500 Consumer Discretionary +1.1%, Real Estate +1%
- (MX) Mexico responds to US metals tariffs by announcing plan to impose 20% tariff on US pork legs and shoulders; effective from June 6th - financial press
Europe
- (UK) May BRC Sales LFL y/y: +2.8% v -4.2% prior
- (UK) PM May reportedly tells business leaders that a decision on the preferred post-Brexit customs option is imminent - press
Levels as of 02:00ET
- Hang Seng +0.4%; Shanghai Composite +0.4%; Kospi +0.1%
- Equity Futures: S&P500 -0.1%; Nasdaq100 -0.1%, Dax -0.1%; FTSE100 +0.0%
- EUR 1.1703-1.1683; JPY 110.00-109.77; AUD 0.7656-0.7625;NZD 0.7040-0.7018
- Aug Gold -0.2% at $1,294/oz; Jul Crude Oil +0.4% at $65.03/brl; Jul Copper -0.1% at $3.14/lb
USD/JPY Prepares For Bullish Breakout Above 110
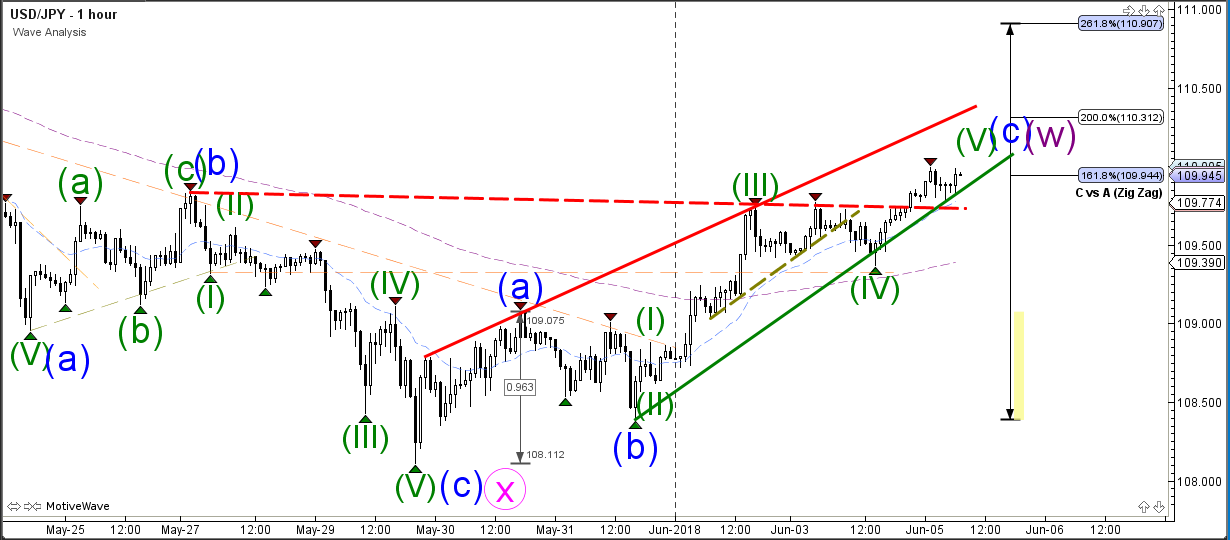
The USD/JPY bullish breakout above the resistance trend line (dotted red) indicates that price is most likely continuing within the wave D (purple). The correction will probably unfold via a WXY (purple) correction within wave Y (pink).
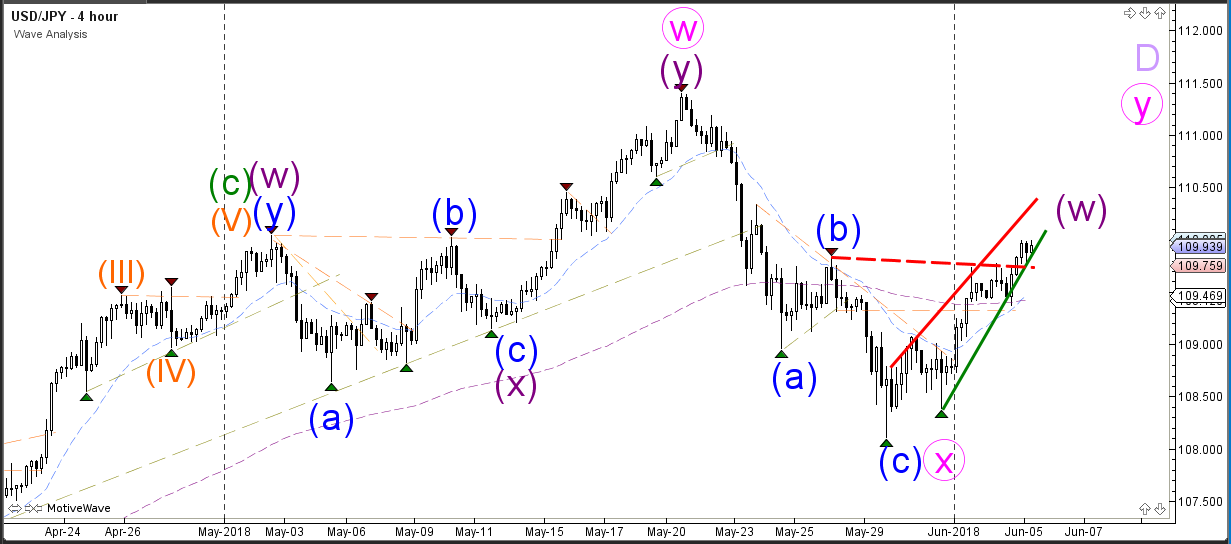
The USD/JPY bounced at the support trend line which was probably a wave 4 (green) correction. The current bullish momentum could be a wave 5 (green) of wave C (blue) and it could be aiming for the Fibonacci targets of wave C (blue). This could complete the first leg (wave W) of the larger wave Y correction (pink 4 hour chart).
EUR/USD Completes Wave C But Fails To Break 1.1750 Resistance
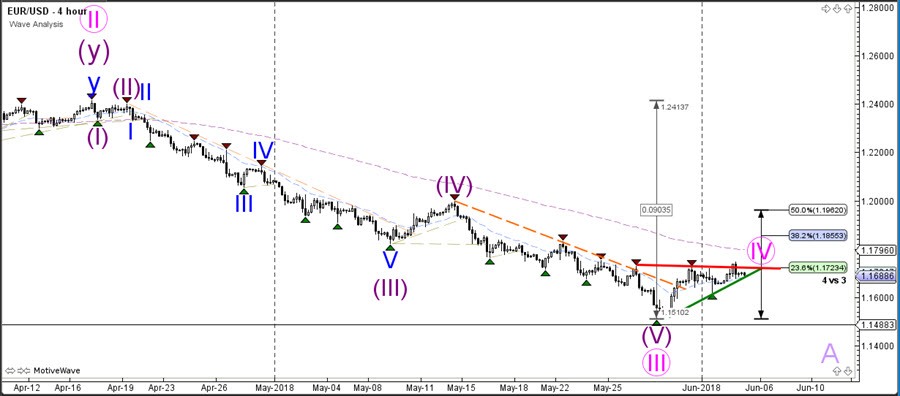
The EUR/USD is at an interesting and critical bounce or break spot. A bearish breakout could see the downtrend continue whereas a bullish break could indicate an expanded wave 4.
The EUR/USD seems to be in a wave 4 (pink) corrective pattern. Price has stopped at the 23.6% Fibonacci retracement level which is quite a shallow Fib level and the EUR/USD could move up to test a higher Fib such as the 38.2% Fib.
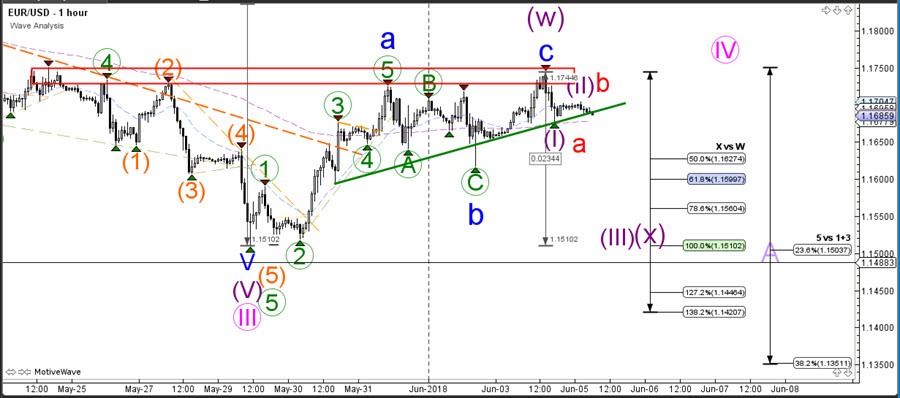
The EUR/USD is challenging the support zone at around 1.1675. A bearish break could indicate a bearish 5 wave pattern or a larger WXY (purple) correction within wave 4. An ABC pattern would probably make a bullish bounce around 1.16 whereas a bearish impulse would show more bearish momentum. A break above the 1.1750 resistance zone however could expand the bullish correction and price could move up towards the 38.2% Fib on the 4 hour chart.
GBP/USD Testing 1.33 And Support Of Key Trend Channel
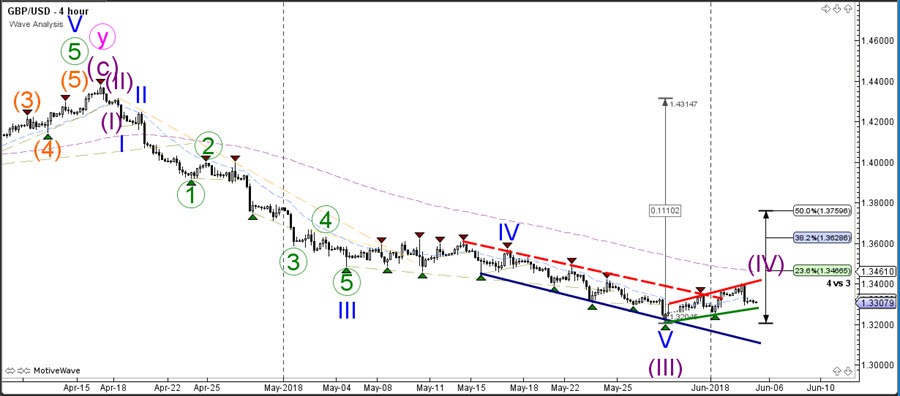
The GBP/USD is building a corrective channel but price is now challenging the support zone which is a key bounce or break spot. The reaction at the channel will determine whether price is back in the downtrend or expanding the 4th wave (purple).
The Fibonacci levels of wave 4 vs 3 could act as resistance spots within the wave 4 pattern. A break above the 38.2-50% Fib zone indicates that the wave 4 is not likely anymore and price could be making a larger bullish pullback within wave 2. A breakout below the corrective channel could trigger the 5th wave down.
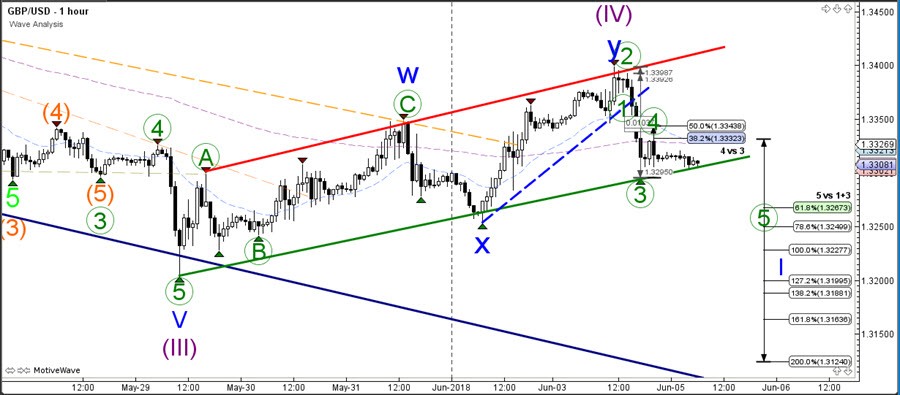
The GBP/USD is either building a bearish ABC or a 123 pattern. A break above the 50% Fib without breaking below the channel could indicate an ABC and the GBP/USD could be building a larger WXY correction within wave 4. This image is showing a potential breakout, which could be a wave 5 of a larger bearish wave 1.
Denmark Is Closed Due To Constitution Day
Market movers today
The new Italian government is set for a confidence vote in parliament today. Prime Minister Giuseppe Conte will be speaking at 11:00 CEST before the Senate and at 12:30 CEST before the Lower House. The vote is due to take place at 18.30 CEST and the government is expected to win by only a small majority in the Senate.
UK PMI service index for May likely rose to 53.5 from 52.8. We will also get final PMIs in the euro area.
In Sweden , April production data in various forms is due to be released: private sector, industry (and new orders) and services. Looking at survey data for guidance, these are mixed but on average suggest unchanged or lower growth. This would not be a surprise given declining European PMIs. The Swedish markets close at noon today.
In Norway , housing market data is on the agenda. The risk of a major setback for the housing market in Norway has gradually receded in the opening months of 2018. We estimate that prices rose a further 0.4% m/m in May.
Denmark is closed due to Constitution Day.
Selected market news
In the UK, PM Theresa May has decided to postpone the release of the government's white paper on the future relationship with the EU until after the EU summit on 28-29 June. While this is not positive for the negotiations, it is not a big surprise either, as the UK and not least the Cabinet are still much divided on what the future relationship (especially with respect to customs) should look like, see Financial Times . The problem is that the next summit is in October, where the risk is that the UK and EU27 will need to agree on everything. UK companies expressed their concerns in a meeting held with Theresa May yesterday. The EU's chief negotiator, Michel Barnier, still warns that much is at stake if the two sides cannot reach an agreement on how to resolve the Irish border issue by the end of the month, see Bloomberg . It remains our base case that the two sides will reach an agreement eventually but it may be much closer to the deadline before it happens and risks are increasing as time goes by.
We have updated our take on the US-China trade conflict, as things have got trickier over the past week. We think the risk of renewed escalation over the coming weeks has moved up and the key challenge is how Trump can satisfy a strong domestic call for tariffs on imports from China without China leaving the negotiations table. We still believe the ultimate solution will not entail a trade wall, but the probability that things will get worse in the short run is higher now. See US-China Trade Talks: Why things are getting tricky , 4 June.
The meeting between US President Trump and North Korea's Kim Jong-un is now scheduled to take place on 12 June at 9am Singapore time. The US will continue its current strategy to isolate North Korea ahead of the meeting in order to put Kim Jong-un under maximum pressure, see Bloomberg . Trump's aim still seems to be to persuade him to give up his nuclear plans in return for sanction relief but as we know from the trade conflict that this may not be as easy as it seems.
RBA Keeps Key Interest Rate Steady At 1.50%
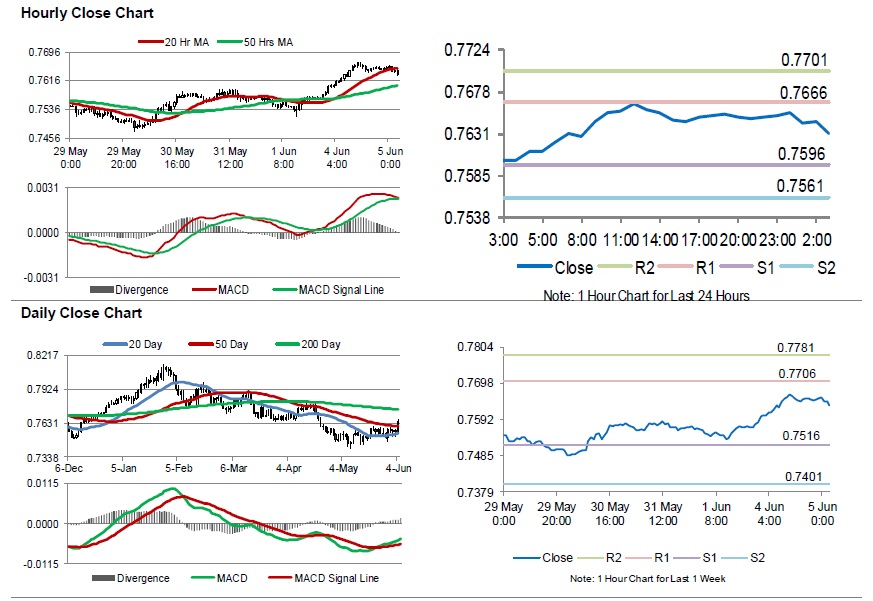
For the 24 hours to 23:00 GMT, the AUD rose 0.67% against the USD and closed at 0.7650.
LME Copper prices rose 1.78% or $121.0/MT to $6935.0/MT. Aluminium prices rose 4.85% or $107.5/MT to $2324.5/MT.
In the Asian session, at GMT0300, the pair is trading at 0.7631, with the AUD trading 0.25% lower against the USD from yesterday’s close.
Earlier today, the Reserve Bank of Australia (RBA), at its June monetary policy meeting, opted to keep the benchmark interest rate steady at 1.50%, meeting market expectations.
Overnight data indicated that Australia’s AIG performance of services index climbed to a level of 59.0 in May. The index had registered a level of 55.2 in the previous month.
Elsewhere in China, Australia’s largest trading partner, the Caixin/Markit services PMI index remained steady at a level of 52.9 in May, at par with market expectations.
The pair is expected to find support at 0.7596, and a fall through could take it to the next support level of 0.7561. The pair is expected to find its first resistance at 0.7666, and a rise through could take it to the next resistance level of 0.7701.
The currency pair is trading between its 20 Hr and 50 Hr moving averages.
Euro-Zone’s Sentix Investor Confidence Surprisingly Declined For The Fifth Straight Month In June
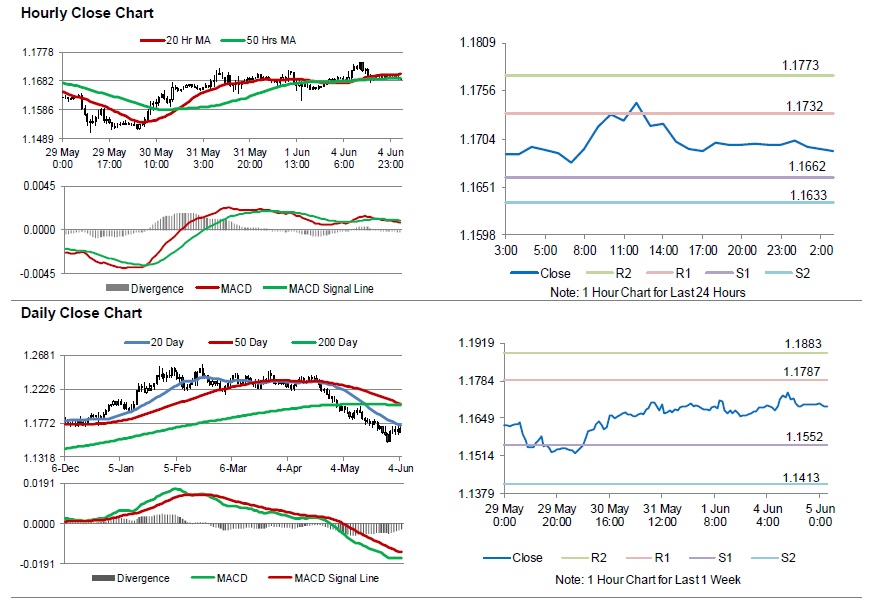
For the 24 hours to 23:00 GMT, the EUR rose 0.07% against the USD and closed at 1.1697, after disappointing investor confidence data.
Data showed that the Euro-zone's Sentix investor confidence index dropped sharply to a level of 9.3 in June, amid political turmoil in Italy and recording its lowest level since October 2016. Market participants had envisaged the index to drop to a level of 18.5. In the previous month, the index had registered a level of 19.2. Meanwhile, the region's producer price index (PPI) climbed less-than-anticipated by 2.0% on an annual basis in April, compared to an advance of 2.1% in the previous month, while markets were anticipating the PPI to increase 2.4%.
In the US, data showed that final durable goods orders in the US fell 1.6% on a monthly basis in April, compared to a drop of 1.7% in the previous month. Also, the nation's factory orders declined 0.8% MoM in April, following a revised gain of 1.7% in the previous month.
In the Asian session, at GMT0300, the pair is trading at 1.1690, with the EUR trading 0.06% lower against the USD from yesterday's close.
The pair is expected to find support at 1.1662, and a fall through could take it to the next support level of 1.1633. The pair is expected to find its first resistance at 1.1732, and a rise through could take it to the next resistance level of 1.1773.
Going ahead, traders would keep a close watch on the final Markit services PMIs data for May, scheduled to release across the Euro-zone in a few hours. Moreover, the Euro-zone's retail sales data for April, will also be on investors' radar. Later in the day, the US ISM non-manufacturing and the final Markit services PMIs, both for May, will pique significant amount of investor attention.
The currency pair is trading below its 20 Hr and showing convergence with its 50 Hr moving average.
Britain’s Construction Activity Registers Moderate Growth In May
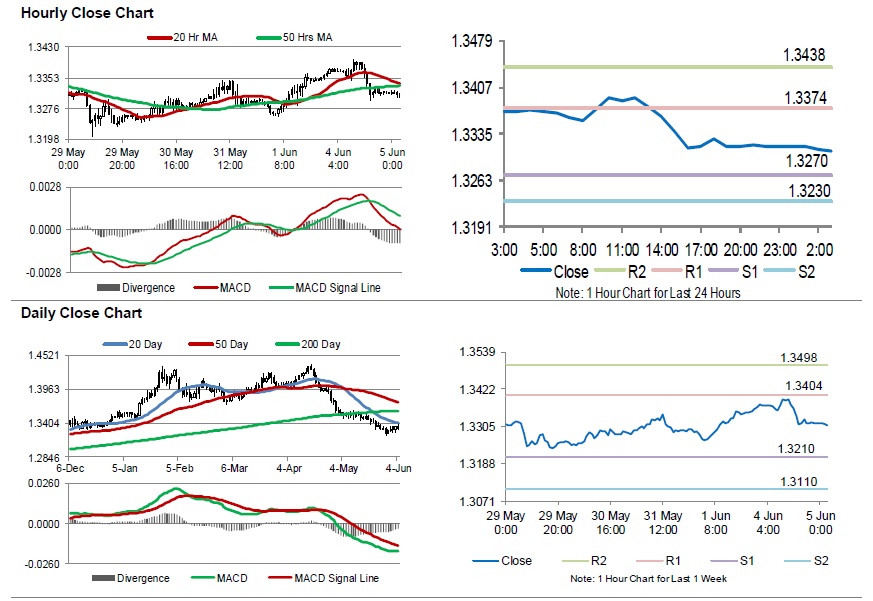
For the 24 hours to 23:00 GMT, the GBP declined 0.45% against the USD and closed at 1.3315, amid continuing worries over Brexit.
On the macroeconomic front, UK's Markit construction PMI remained steady at a level of 52.5 in May, supported by good weather conditions. Market had anticipated the PMI to drop to a level of 52.0.
In the Asian session, at GMT0300, the pair is trading at 1.3309, with the GBP trading 0.05% lower against the USD from yesterday's close.
The pair is expected to find support at 1.3270, and a fall through could take it to the next support level of 1.3230. The pair is expected to find its first resistance at 1.3374, and a rise through could take it to the next resistance level of 1.3438.
Going ahead, investors will keep a watch on Britain's Markit services PMI for May, set to release in a few hours.
The currency pair is trading below its 20 Hr and 50 Hr moving averages.