

Sample Category Title
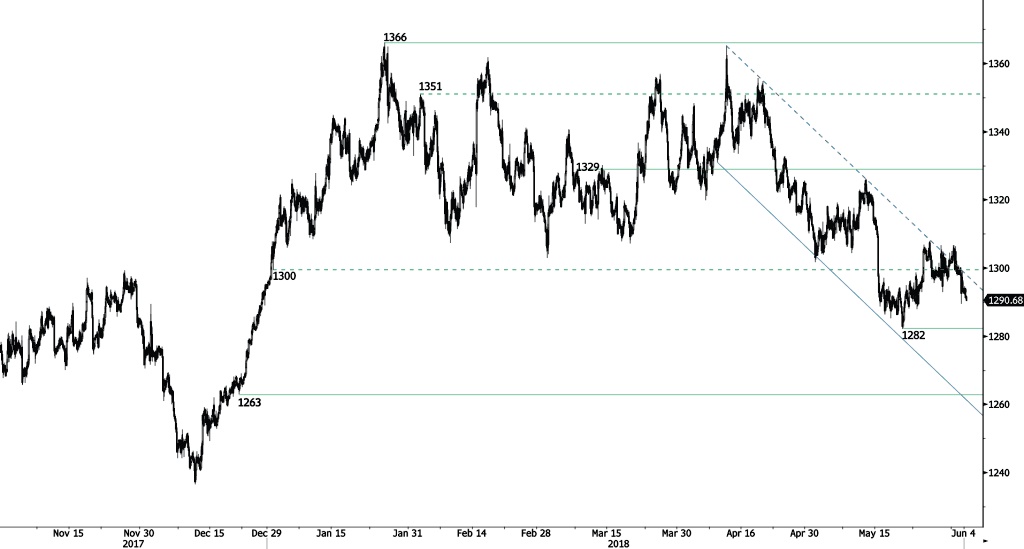
GOLD Pausing Above 1290
Gold decline continues, trading along 1295 and currently trading sideways. Hourly support and resistance are given at 1282 (21/05/2018 low) and 1329 (08/03/2018 high). The technical structure suggests short-term sideways trading moves.
In the long-term, the technical structure suggests that there is a growing upside momentum. A break of 1'392 (17/03/2014) is required to confirm it. A major support can be found at 1'045 (05/02/2010 low). The pair is trading below its 200 DMA.
EUR/CHF Increasing
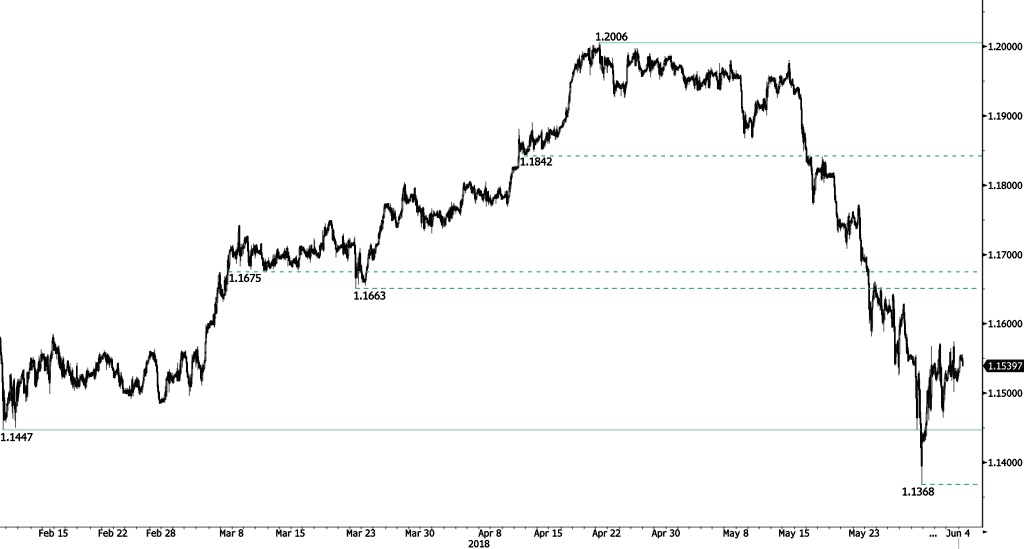
EUR/CHF bounce continues, heading along 1.1550. EUR/CHF weakness is however holding, confirming an underlying bearish trend. Hourly support and resistance are given at 1.1447 (08/02/2018 low) and 1.2006 (20/04/2018 high).
In the longer term, the technical structure has reversed. Strong resistance at 1.20 (level before the unpeg) is now at reach. The ECB's slowing QE program is likely to cause buying pressures on the euro, which should weigh in favour of the EUR/CHF. Support and resistance can be found at 1.0624 (24/06/2016 low) and 1.2097 (18/12/2014 high).
EUR/GBP Trying To Bounce
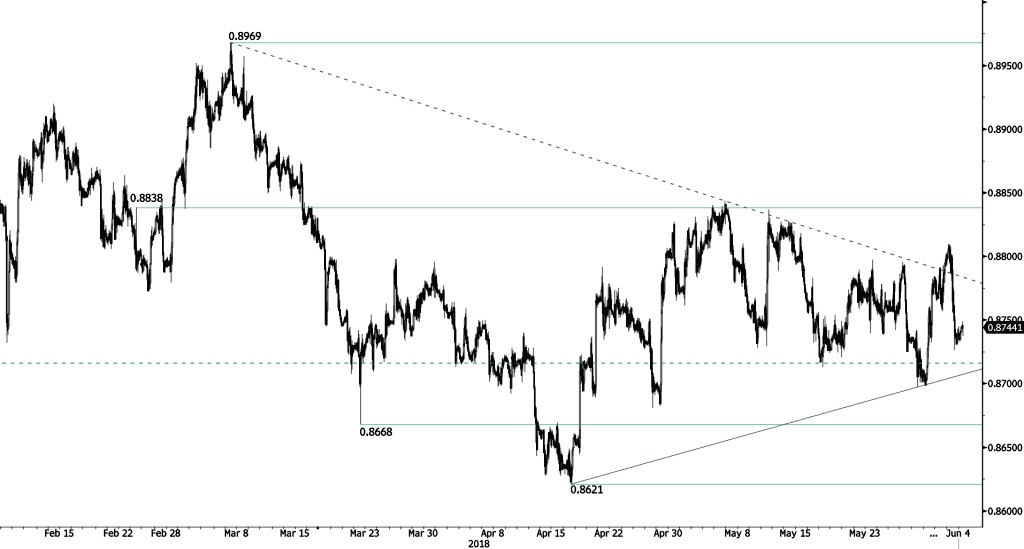
EUR/GBP is starting a recovery phase after reaching 0.8727 (01/06/2018 low), trading above 0.875 and heading along 0.8765. Hourly support and resistance are given at 0.8668 (22/03/2018 low) and 0.8838 (23/02/2018 high).
In the long-term, the pair has largely recovered from 2015 lows. The technical structure suggests further upside pressure. Strong resistance can be found at 0.9500 (psychological level) while support remains at 0.8304 (05/12/2016 low). The pair is trading below its 200 DMA.
USD/JPY Sideways Trading
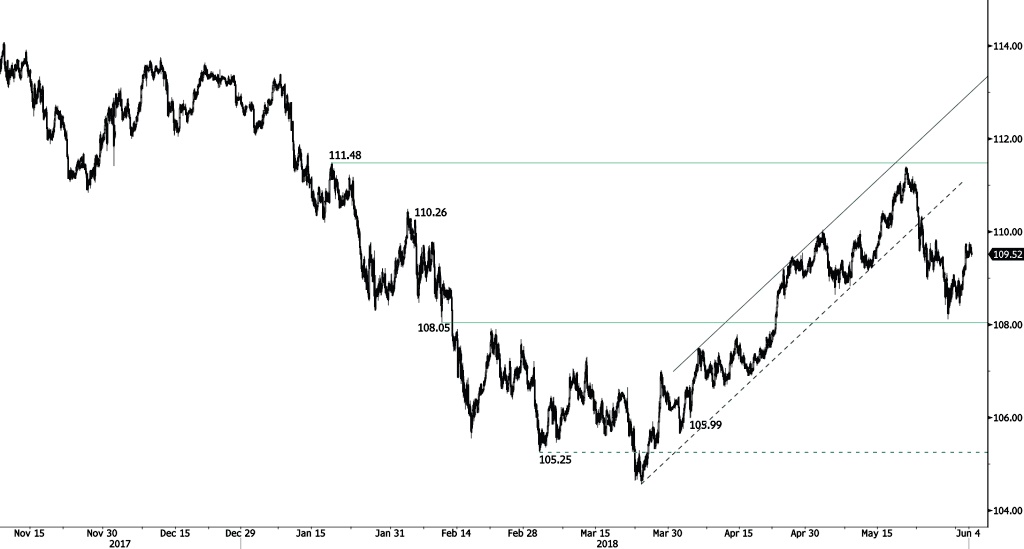
USD/JPY strong bounce from 108.39(31/05/2018 low) pauses, trading along 109.60.Strong support and resistance are located at108.05 (09/02/2018 low) and 111.48 (18/01/2018high). The technical structure suggests furthershort-term sideways trading moves.
We favor a long-term bearish bias. A gradualrise towards major resistance at 125.86(05/06/2015 high) seems unlikely. The pair isexpected to decline further along long-termsupport at 101.20 (09/11/2016 low). The pairtrades slightly below its 200 DMA.
GBP/USD Slight Increase
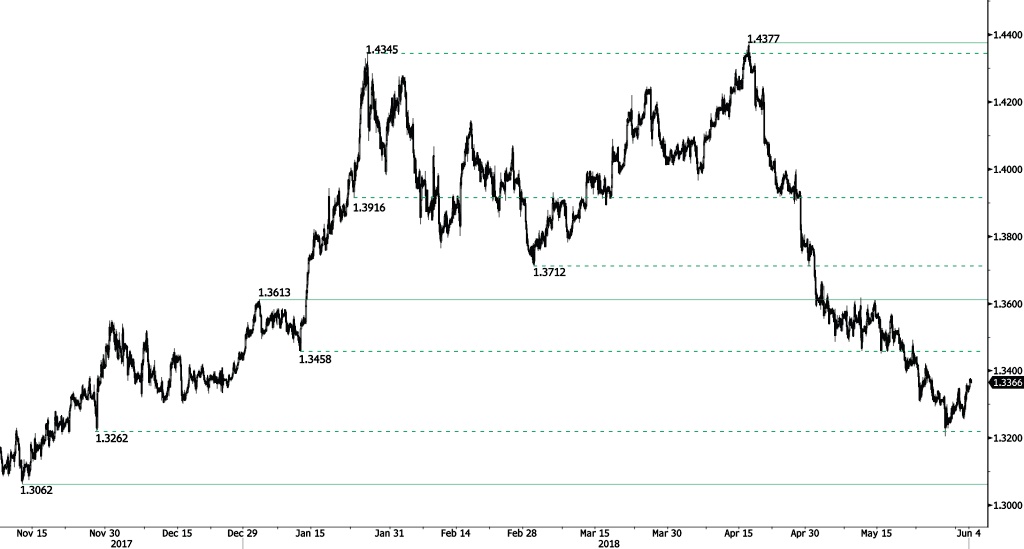
GBP/USD bounce from 1.3254 (01/06/2018 low)continues, approaching the 1.3380 range. Theshort-term bearish trend started in mid-April2018 is maintained. Key support and resistanceare given at 1.3062 (13/11/2017 low) and 1.3613(03/01/2018 low). The technical structuresuggests short-term upward moves.
The long-term technical pattern is reversing.The Brexit vote had paved the way for furtherdecline but the pair is moving to 2016 highs.Long-term support and resistance are given at1.1841 (07/10/2017 low) and 1.5018 (24/06/2016high).
EUR/USD Continued Strength
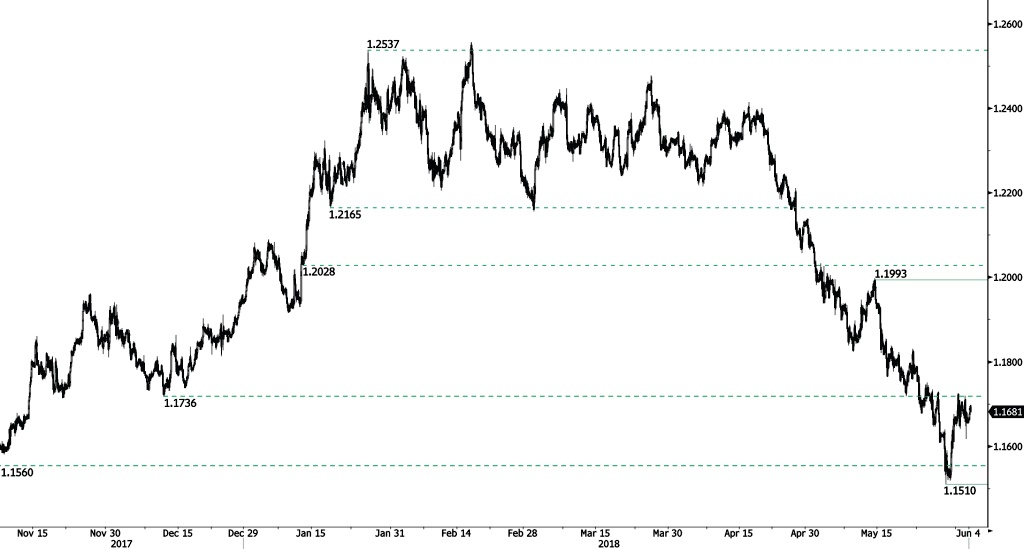
EUR/USD strong bounce from 1.1510(29/05/2018 low) continues, trading above 1.17and heading along 1.1718. The short-term trendremains negative as long as prices remain belowhourly resistance at 1.1993 (14/05/2018 high).Hourly support is given at 1.1510 (29/05/2018low).
In the longer term, the momentum is turninglargely negative. We favor a continued bearishbias. Key resistance is holding at 1.2886(15/10/2014 high) while strong support lies at1.0341 (03/01/2017 low).
Spot Gold Outlook – 10SMA To Cap Consolidation And Keep Bearish Bias
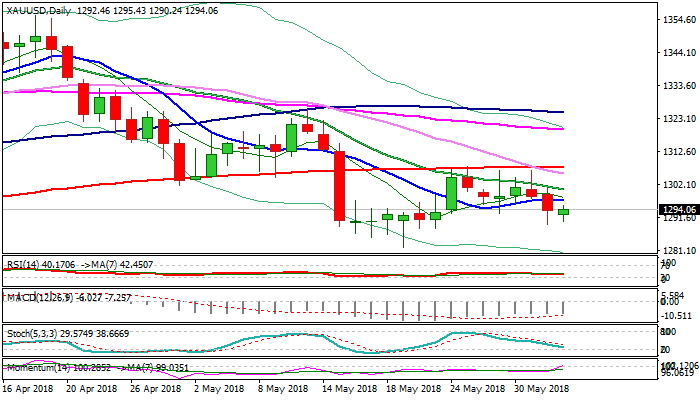
Spot Gold moved higher in European session and retested session high at $1297, posted in early Asian trading on Monday supported by softer dollar.
The yellow metal was down around $16 in past two days, with stronger acceleration lower seen on Friday on strong US jobs data which added to strong expectations for Fed rate hike this month.
On the other side, uncertainty about trade war exists but so far without stronger safe-haven buying, which keeps gold price at the back foot on Monday.
Recovery from new low at $1289 (01 June) following failure to close below cracked Fibo support at $1291 (Fibo 61.8% of $1282/$1307) on Friday is supported by growing momentum and may extend further.
On the other side, negative setup of daily MA’s suggests that upside attempts would be limited under 10SMA ($1297) to keep negative outlook after multiple rejections at 200SMA ($1307) in play.
Bears need confirmation on close below Fibo 61.8% ($1291) to accelerate through $1288 (Fibo 76.4) for retest of key near-term support at $1282 (21 May low).
Alternatively, bears could be sidelined on break and close above 10SMA, which would open way for further retracement of $1307/$1289 bear-leg.
Res: 1295, 1297, 1300, 1305
Sup: 1291, 1288, 1285, 1282
Forex Technical Analysis: EUR/USD, USD/JPY, GBP/USD
EUR/USD
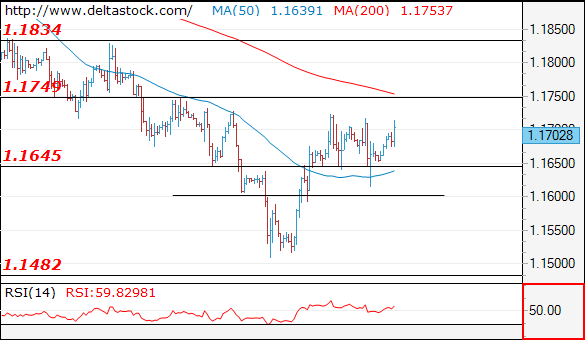
Current level - 1.1702
The consolidation pattern below 1.1725 is over and I favor a continuation of the rise, towards 1.1830. Initial support lies at 1.1645, followed by the crucial 1.1590.
| Resistance | Support | ||
| intraday | intraweek | intraday | intraweek |
| 1.1750 | 1.1830 | 1.1645 | 1.1480 |
| 1.1830 | 1.2060 | 1.1590 | 1.1300 |
 USD/JPY
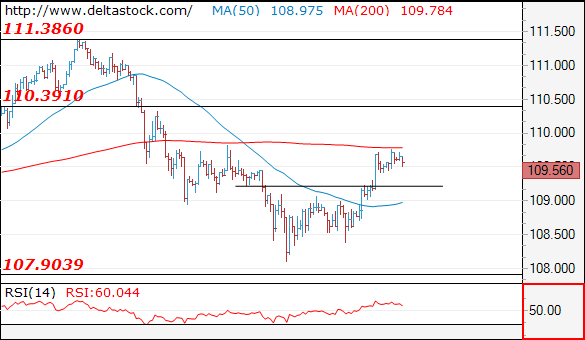
Current level - 109.56
The intraday outlook is positive above 109.20, for a rise towards 110.40 area.
| Resistance | Support | ||
| intraday | intraweek | intraday | intraweek |
| 109.80 | 111.40 | 109.20 | 107.80 |
| 110.40 | 114.40 | 107.80 | 106.70 |
GBP/USD
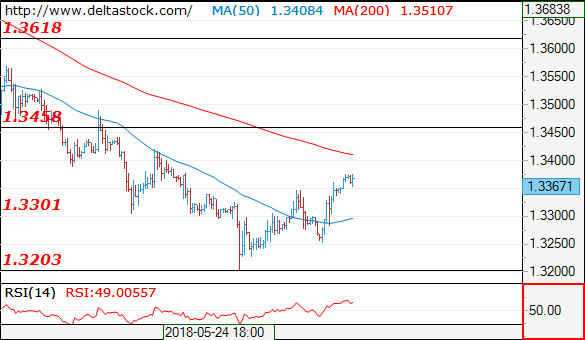
Current level - 1.3367
The bias is positive, for a rise towards 1.3460. Crucial on the downside is 1.3250.
| Resistance | Support | ||
| intraday | intraweek | intraday | intraweek |
| 1.3460 | 1.3990 | 1.3250 | 1.3210 |
| 1.3460 | 1.4100 | 1.3200 | 1.3040 |
Forex Analysis: AUDUSD And UK 100
AUDUSD
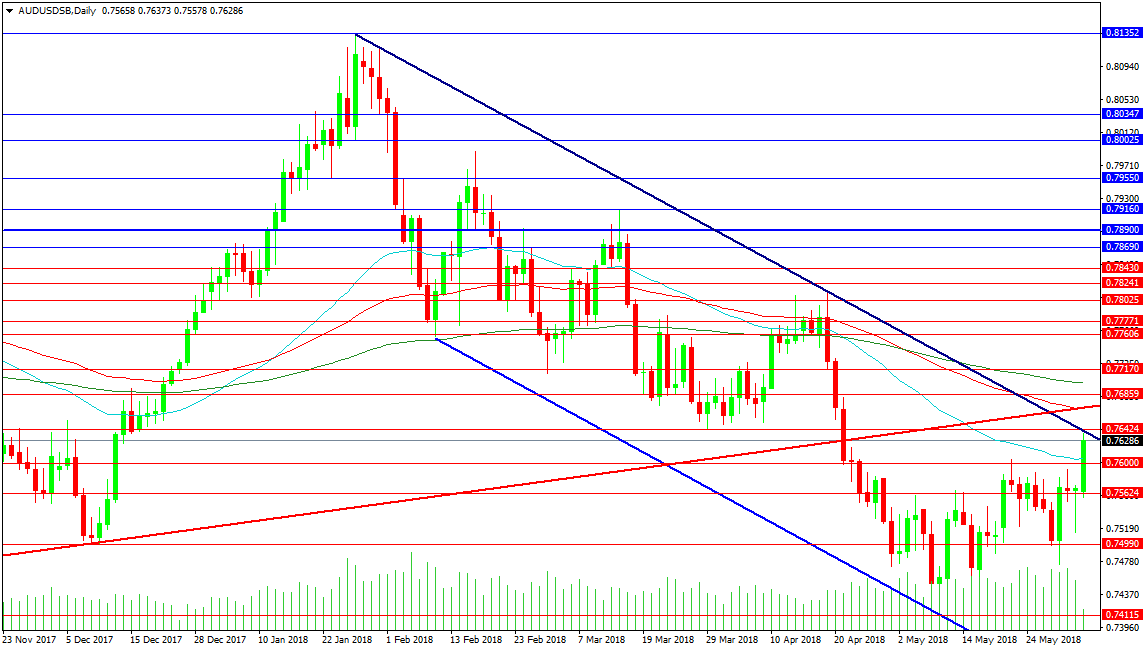
The AUDUSD pair has been boosted today by better Australian economic data leading to a move up to resistance at the descending Blue trend line at 0.76425. A retest of this trend line confirms the area as resistance and price has now initially pulled back away from the line. The level has been used as resistance in November/ December 2017 and as support in March/April 2018. Traders will look to engage with the market in this area of the chart. A rejection back under 0.76000 could see a push lower develop and the price look to resume the down trend as far as 0.75000. At this point a decision needs to be made with a move back higher to break out or a loss of the level and a journey to test the channel bottom at 0.73100. A loss of this level would trigger further selling and a move to 0.70000.
The way ahead is restricted by the red trend line and the 100 DMA at 0.76680, which may be formidable resistance and give the market a swing high followed by the scenario outlined above. However a move above this area and a push over the 200 DMA at 0.77000 could see the pair step higher first to 0.78000 then 0.79160 and 0.80000. A drive to the recent highs at 0.81352 could see sellers return. A break above that level could see a target of 0.82596.
UK 100
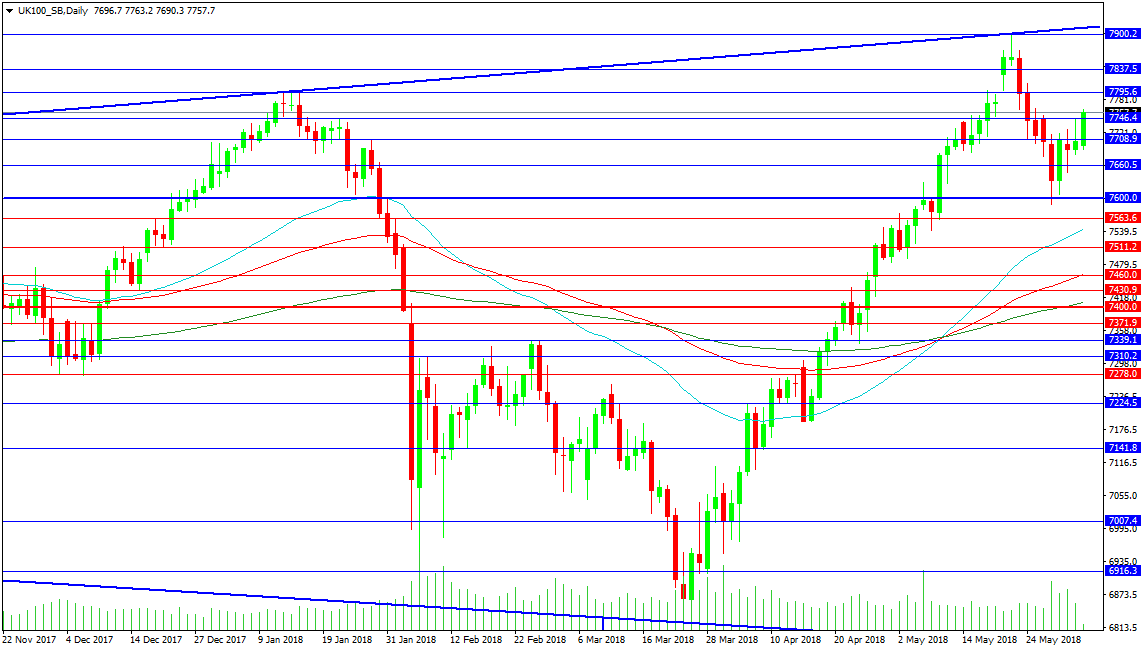
The leading UK index has been rocked with volatility in recent sessions after its spectacular rally from the March lows. The 7600.00 level featured as support and this remains the key point of control on the daily chart. In the lower time frames the rally on Wednesday would have signalled a long setup with 7690.00 the invalidation level of this move. A break above 7800.00 can see 7900.00 retested and price pushing higher to 8000.00. The index seems to have broken away from the general themes in the broader market with moves on GBP cushioning and dampening the turbulence and providing buyers to prop up prices.
Clearly the current leg higher is subject to this goldilocks scenario being maintained. A loss of 7600.00 could damage some of the more recent long positions but it is the 7400.00 level and the 200 DMA that would become a battleground for bulls and bears as it has been for much of 2017. A loss of that area would see sellers in full control as was the case with the recent selloff in early February when the index dropped 400 pips when 7400.00 was lost on the 5th of that month. A risk off senarion could target the low at 6835.70 and extend to 6773.00.
Euro Gains Ground At Start Of Week
EUR/USD has recorded small gains in the Monday session. Currently, the pair is trading at 1.1694, up 0.30% on the day. On the release front, there are no major events in the eurozone or the U.S. The eurozone will release Sentix Investor Confidence and PPI. On Tuesday, Germany releases Final Services PMI and retail sales. The U.S will release ISM Non-Manufacturing PMI.
In Italy, a new government was sworn in on Friday, ending months of twists and turns on the political front. The coalition is made up of two euro-sceptic parties, the League and the Five-Start Movement, which is likely to result in tensions between Brussels and Rome. After President Sergio Matterella vetoed the choice for finance minister last week, it appeared that the country might be headed for another election, and Italian stocks and bonds dropped sharply. However, the crisis is over after the prime minister-elect, Giuseppe Conte, found another candidate for the key finance post. The new government has said it will drastically reduce immigration and raise spending, planks which could put it at odds with EU policy. Although the League and Five Star Movement have not issued any threats to withdraw from the EU or even hold a referendum, there is plenty of concern among investors that the fourth largest economy in the eurozone is being steered by a government with a populist, anti-establishment platform.
The U.S released strong employment numbers on Friday, but the dollar posted only slight gains against the euro. Wage growth improved to 0.3%, up from 0.1% a month earlier. Nonfarm payrolls jumped from 189 thousand to 164 thousand and the unemployment rate dropped to a sizzling 3.8 percent. All three indicators beat their estimates and are indicative of a labor market running at full capacity.
After a brief hiatus, the markets are again facing the nasty reality of a trade war between the U.S. and its major trading partners. On Thursday, the Trump administration made good on its threats and imposed stiff tariffs on the European Union, Mexico and Canada. The U.S had granted all three trading partners a temporary extension, but cited insufficient progress on trade talks as the reason for the tariffs. There are renewed fears that these moves could trigger a global trade war. This has triggered promises of retaliatory tariffs on US products, and matters heated up on the weekend at the G-7 meeting of finance ministers in Canada. US Treasury Secretary Steve Mnuchin faced sharp criticism from other finance ministers over the tariffs. There are fears that the escalating trade tensions could trigger a global trade war, which could have a devastating effect and lead to sharp losses on the stock markets.