Sample Category Title
EUR/USD Analysis: Ready To Break Out
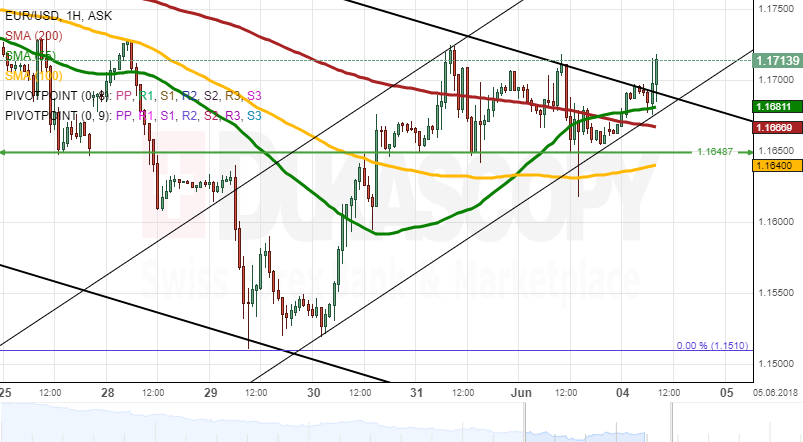
The common European currency remained stable against the US Dollar for the third consecutive session on Friday, as the pair continued to fluctuate around the 55– and 200-hour SMAs. This has put the Euro in between the upper boundary of an eight-week channel and the weekly resistance/support level of 1.1650.
The pair trading near the upper channel line for two sessions suggests that it might be ready to break out to the upside. This bullish scenario is likewise strengthened by the fact that the rate surpassed the 55-period SMA (4h) early today.
The most probable upside target in this session is the weekly R1 and the 23.60% Fibo retracement at 1.1760, while a fall should not exceed the 1.1680 area.
GBP/USD Analysis: Shows Potential Until 1.3450
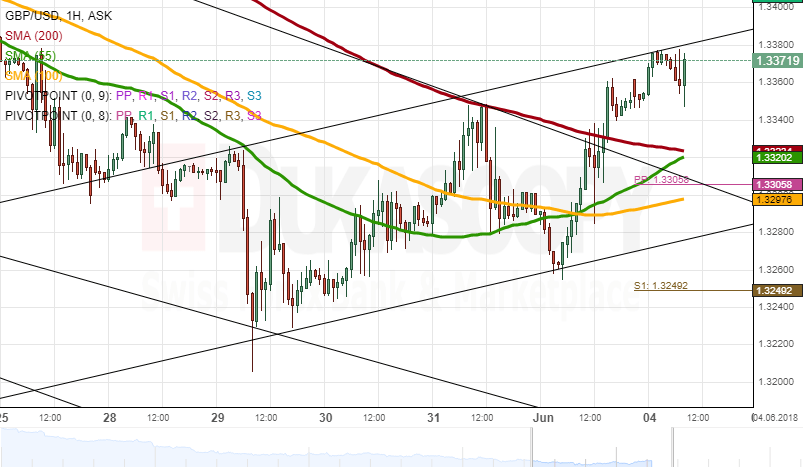
Bulls prevailed on Friday, thus pushing the GBP/USD exchange rate past the 55-, 100– and 200-hour SMAs and the prevailing five-week channel down. The pair reversing from the 1.3260 level early on Friday allowed to draw a new short-term ascending channel whose upper boundary was tested early today.
Some slight upside potential is still apparent in the market. Thus, it is expected that the pair tests the combined resistance of the weekly R1, the monthly PP and the 100-period (4H) SMA near 1.3420. Bullish gains should not exceed the 1.3450 level. Conversely, the strong support cluster formed by the breached hourly SMAs and the channel near 1.3310 is likely to remain intact.
In general, the following days should still show some appreciation that could change to the opposite direction mid-week.
USDJPY Analysis: Points To Limited Fall
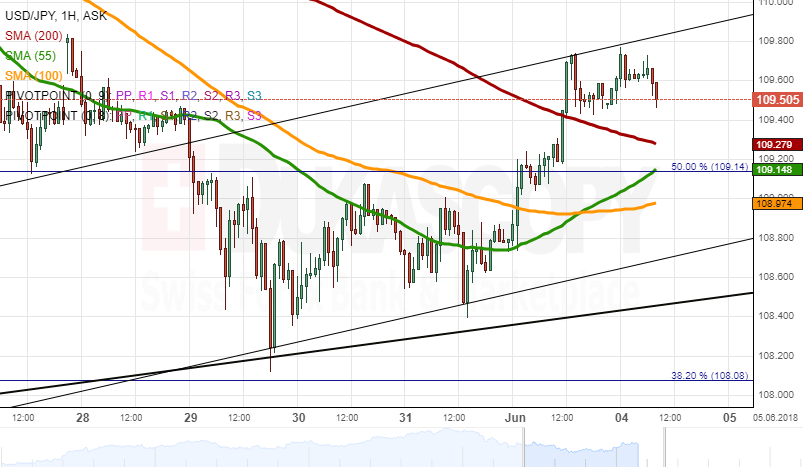
Following two sessions of sideways movement, the Greenback eventually managed accelerated against the Yen on Friday . The pair found support at the 55-hour SMA early in the day and subsequently dashed through the 100– and 200-hour SMAs and the 50.00% Fibonacci retracement.
The pair stopped at the 100-period (4H) SMA late on Friday and was trading at this line early today, as well. This has left the rate in a narrow 109.80/20 range. Even though technical indicators are located in the overbought territory and thus are pointing to a decline today, this fall is unlikely to be significant due to the 200-hour and 200-period (4H) SMAs, among other support levels, restricting the 109.20/30 area.
In terms of the upside, the Greenback should find resistance at the weekly R1 and the 61.80% Fibo at 110.20.
Gold Analysis: Falls Below SMAs
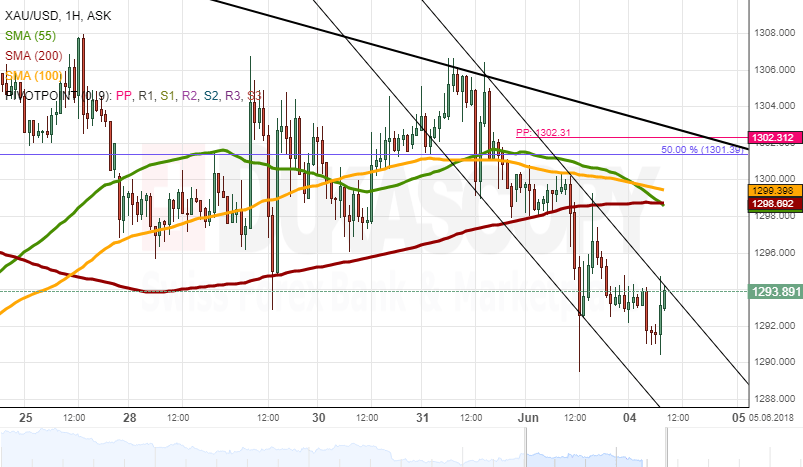
The yellow metal was stranded in a narrow range between the 55-, 100– and 200-hour SMAs early on Friday. The bearish sentiment eventually took over the market as a result of which Gold breached the long-term moving average and subsequently fell down to the 1,290.00.
Technical indicators on the 1H and 4H time-frames demonstrate that there is still some downside potential that could be realised today. The nearest support is the 61.80% Fibonacci retracement and the lower boundary of a 1,5-year ascending channel at 1.285.00.
It is likely that bears still try to reach this level today prior to reversing to the upside and re-testing the 55-, 100– and 200-hour SMAs at 1,300.00 later in the week.
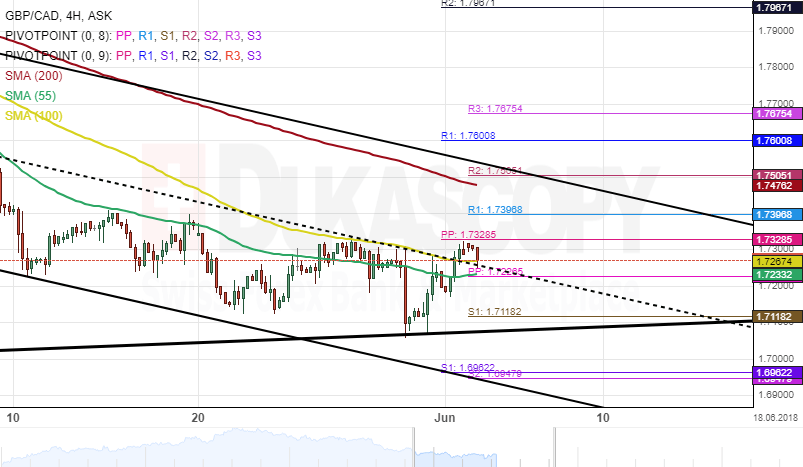
GBP/CAD 4H Chart: Potential Bulls Dominance
The GBP/CAD exchange rate has been guided by a standard deviation channel since March 20. The currency pair breached the lower boundary of a middle trend line on April 30 and has since reached a five-month low.
However, during the last few days, a breakout has occurred through the upper boundary of the mid-trendline. Furthermore, the pair has breached both the 55– and 100– hour SMAs.
As for near future, it is likely that bulls dominance over the currency exchange rate could come into play during the following trading sessions for a potential target of the 200– hour simple moving average located at 1.74.
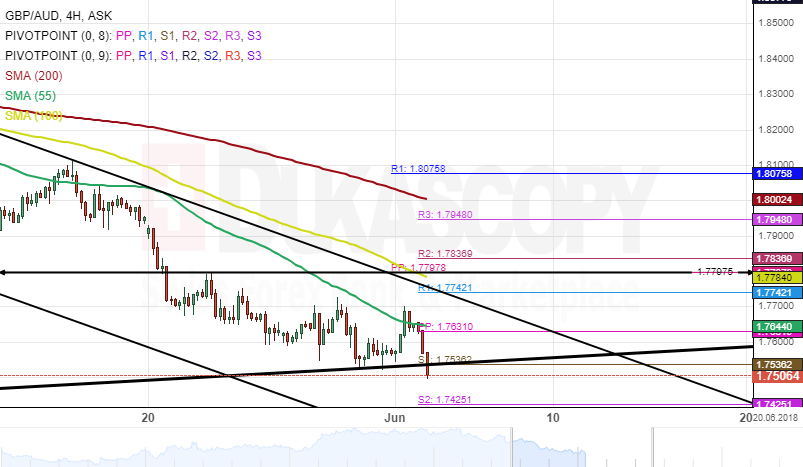
GBP/AUD 4H Chart: Breakout Expected
The British Pound movement against the Australian Dollar has been constrained by a six-week descending pattern. The pair made a U-turn south after hitting the upper boundary of a channel down on April 30 and has since reached a three-month low level at 1.75.
The 55– hour simple moving average has been guiding the exchange rate down during the last two weeks. Meanwhile, the currency pair has reached the weekly S1 where the lower boundary of an ascending trend line is located.
Everything being equal, a breakout from the aforementioned trend line could be expected during the following trading session. If and when this occurs, it might find support at the weekly pivot point at 1.74.
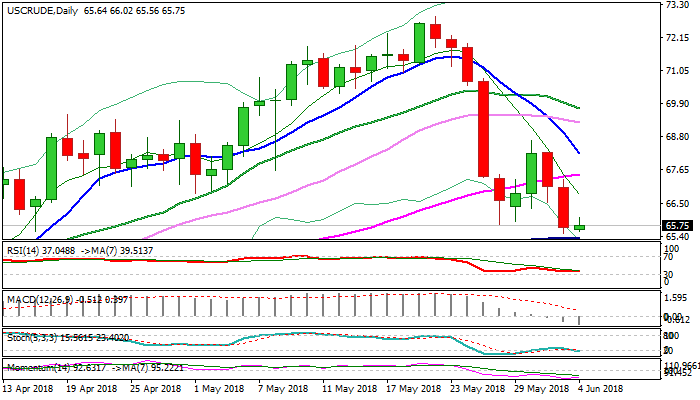
WTI Oil Outlook: Consolidation Is Expected To Precede Fresh Weakness, Daily Cloud Top To Cap Upticks
WTI oil price is slightly higher in early hours of European trading on Monday after dip in Asia found footstep just above last Friday's low at $65.49 (also 50% retracement of $58.06/$72.89 bull-leg, supported by 100SMA at $65.31). Oil price was down $3 in last Thu/Fri fall which closed below former low at $65.79 and attempts to generate fresh bearish signal on completion of failure swing pattern on daily chart. Negative outlook is supported by bearish techs (daily MA's in bearish setup and south-heading 14-d momentum) as well as rising production of US shale oil and fears that OPEC and non OPEC oil producers may decide to ease current deal for reduced production. Consolidation is likely to precede fresh weakness, with broken daily cloud top ($66.86) expected to cap upticks and maintain bearish bias. Break below $65.49 would expose $64.62 (base of rising daily cloud) and could extend towards $63.73 (Fibo 61.8% of $58.06/$72.89). Conversely, break and close above daily cloud top would sideline downside risk and signal stronger recovery.
Res: 66.02, 66.86, 67.49, 68.23
Sup: 65.49, 65.31, 64.62, 63.73
Gold Maintains Weak Bias In Near Term, Broader Trend Is Neutral
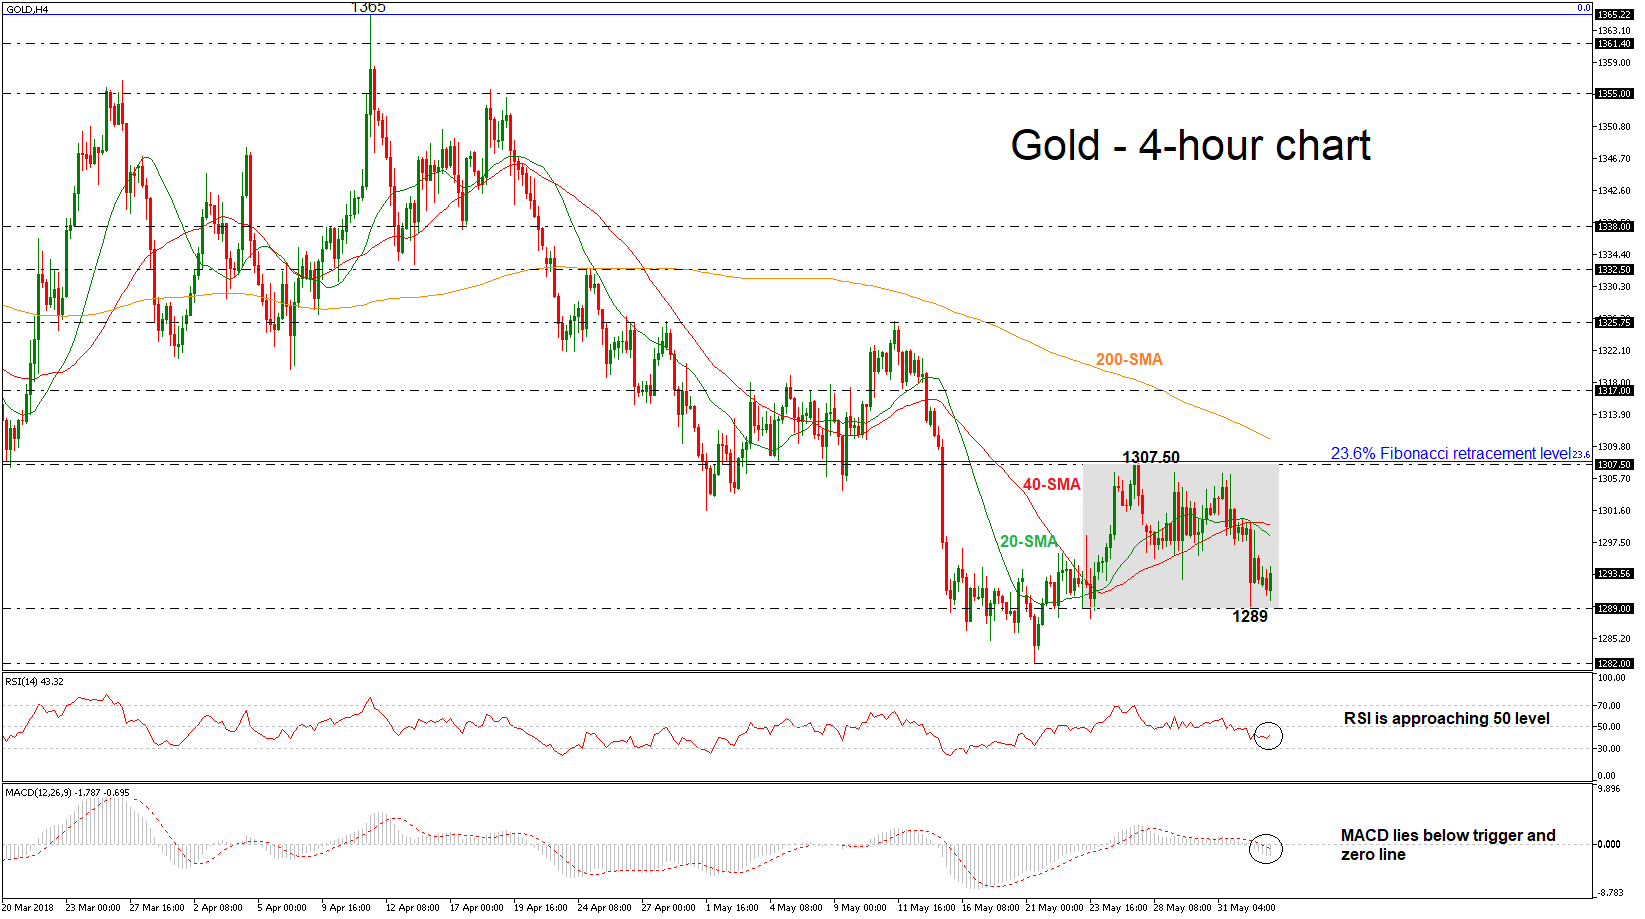
Gold remains under pressure and risk is still to the downside as prices continue to drift lower from the 1300 psychological level. It is worth mentioning that the precious metal has been developing within a sideways channel since May 23 with upper boundary the 1307.50 resistance level and lower boundary the 1289 support barrier. The short-term technical indicators are bearish and point to more weakness in the market.
Looking at the 4-hour chart, gold prices are looking capped by the 20 and 40-simple moving averages which are negatively aligned after a bearish crossover that took place last Friday. The Relative Strength Index (RSI) is holding in the negative zone, while the MACD lies below its trigger and zero lines.
The next target to have in mind if the price slips below the range is the May 21 low at 1282. At this stage, the market would likely see a resumption of the downtrend and put in place a lower low at 1270, near the 38.2% Fibonacci retracement level of the upleg from 1122 to 1366.
Upsides moves are likely to find resistance at the 1307.50. This is the 23.6% Fibonacci mark and if the price successfully surpasses it, it would retest the 200-simple moving average in the 4-hour chart around 1310.70. Rising above this area would help shift the focus to the upside towards 1317.
In the short-term, the bearish phase remains in play especially if gold prices continue to trade below the 23.6% Fibonacci and under the 1300 key level, while the 200-day SMA is acting as strong resistance level near 1310.
USDJPY Outlook: Recovery Faces Strong Headwinds From 20SMA Barrier
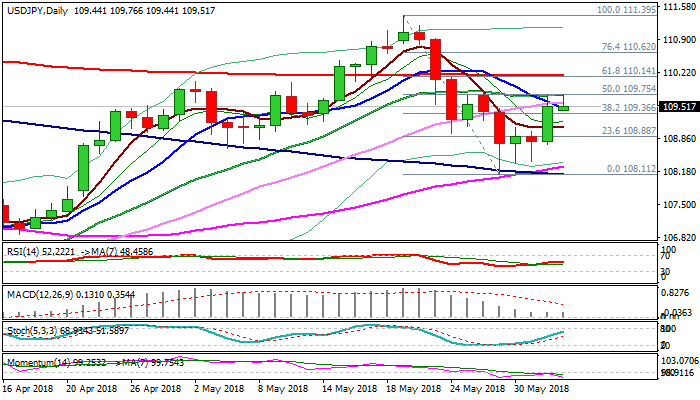
The pair faces headwinds from strong 109.75 barrier (20SMA/daily Kijun-sen/50% retracement of 111.39/108.11 bear-leg) in early Monday’s trading. Strong post-US data rally on Friday stalled here and today’s renewed attack was capped, signaling bulls might be running out of steam.
Weakening momentum on daily chart supports the notion as the pair returns below falling 10SMA (109.46) after failing to close above it on Friday, as 10SMA formed a multiple bear-crosses with 200, 20 and 30SMA’s, adding to negative near-term outlook.
Extended dips need to find footstep above 5SMA (109.09) to keep in play hopes for renewed attempts at 109.75 pivot, break of which is needed to open way towards next key points at 110.00 (psychological barrier) and 110.16 (200SMA).
Otherwise, loss of 5SMA would turn near-term bias into negative mode and signal an end of corrective phase from 108.11.
Res: 109.60, 109.75, 110.00, 110.16
Sup: 109.36, 109.09, 108.72, 108.27
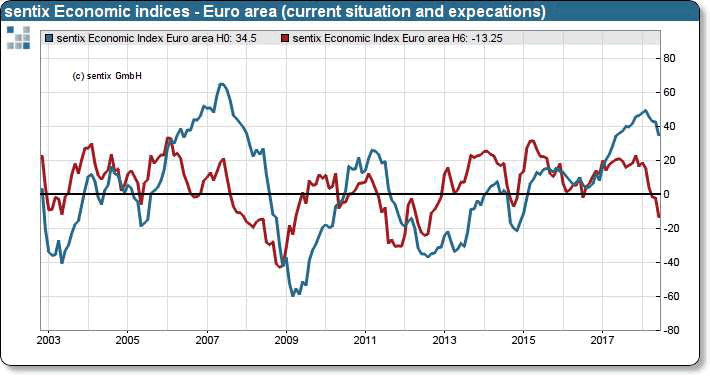
Eurozone Sentix investor confidence dropped sharply to 9.3 as expectation collasped
Eurozone Sentix Investor confidence dropped sharply to 9.3 in June, down from 19.2 and well below expectation of 18.6. And, for the fifth time in a row, overall index for GErmany dropped to its lowest level since July 2016. Expectation "collapsed" to -13.3, hitting the lowest level since August 2012.
Quote from the release:
"Now they are here, the American punitive tariffs. So far, this has done less harm than one might think to global economic expectations. It appears that investors still hope that the world's trade dispute with the US will not get out of control. Investors, on the other hand, are far less lenient with developments within the euro zone. The new government in Rome is very sceptical. This is so strong that economic expectations in the euro zone are downright tilting."