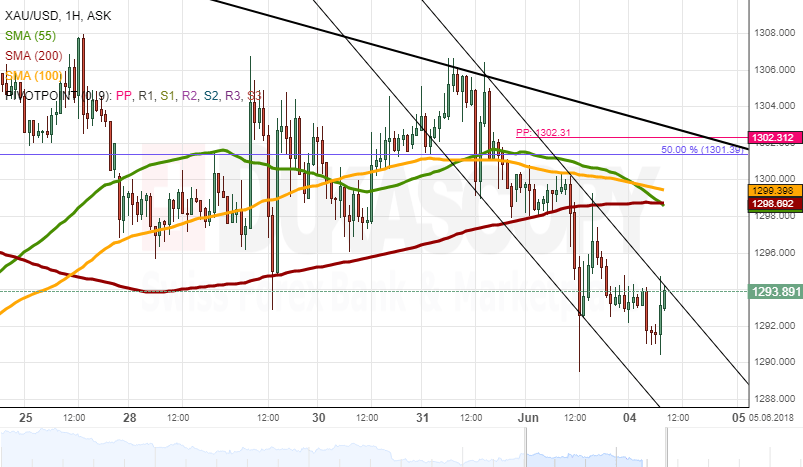
The yellow metal was stranded in a narrow range between the 55-, 100– and 200-hour SMAs early on Friday. The bearish sentiment eventually took over the market as a result of which Gold breached the long-term moving average and subsequently fell down to the 1,290.00.
Technical indicators on the 1H and 4H time-frames demonstrate that there is still some downside potential that could be realised today. The nearest support is the 61.80% Fibonacci retracement and the lower boundary of a 1,5-year ascending channel at 1.285.00.
It is likely that bears still try to reach this level today prior to reversing to the upside and re-testing the 55-, 100– and 200-hour SMAs at 1,300.00 later in the week.