Sample Category Title
USD/CHF Trading Below 1
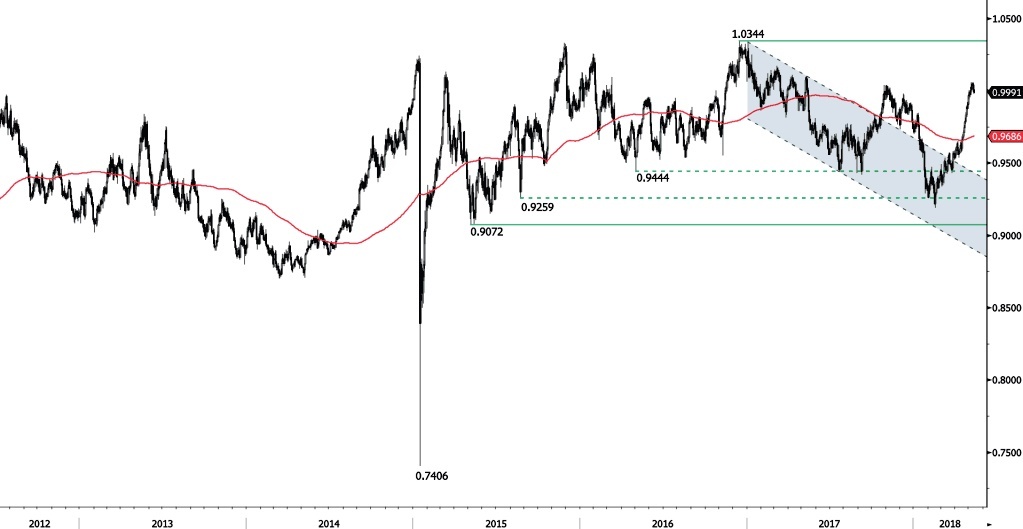
USD/CHF bullish pattern weakens after reaching 1.0057 high, trading below 1 and currently trading sideways. Hourly support and resistance are given at 0.9755 (10/01/2018 low) and 1.0091 (09/05/2017 high). The technical structure suggests short-term sideways trading moves.
In the long-term, the pair is still trading in range since 2011 despite some turmoil when the SNB unpegged the CHF. Key support lies at 0.9072 (07/05/2015 low) while resistance at 1.0344 (15/12/2016 high) is distanced. The technical structure favours a long term bullish bias since the unpeg in January 2015
USD/JPY Bullish Consolidation
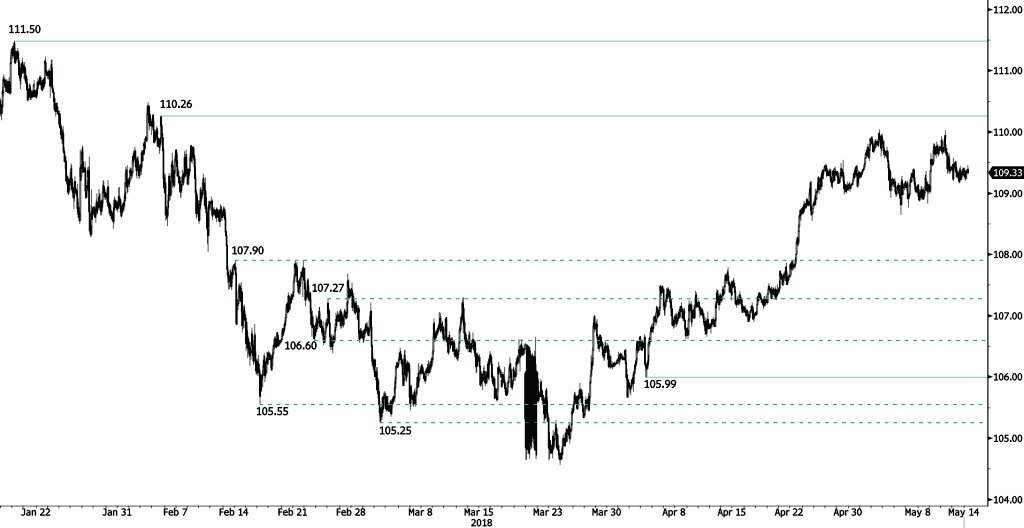
USD/JPY is trading sideways at 109.40, heading along the 109.50 range. The bullish pattern started from 104.56 (25/03/2018 low) continues. Hourly support and resistance are given at 105.99 (04/04/2018 high) and 110.26 (05/02/2018 low). The short-term technical structure suggests further short-term upward moves.
We favor a long-term bearish bias. Support remains at 101.20 (09/11/2016 low). A gradual rise toward the major resistance at 125.86 (05/06/2015 high) seems unlikely. Expected to decline further support at 101.20 (09/11/2016 low). The pair trades below its 200 DMA.
GBP/USD Slight Increase
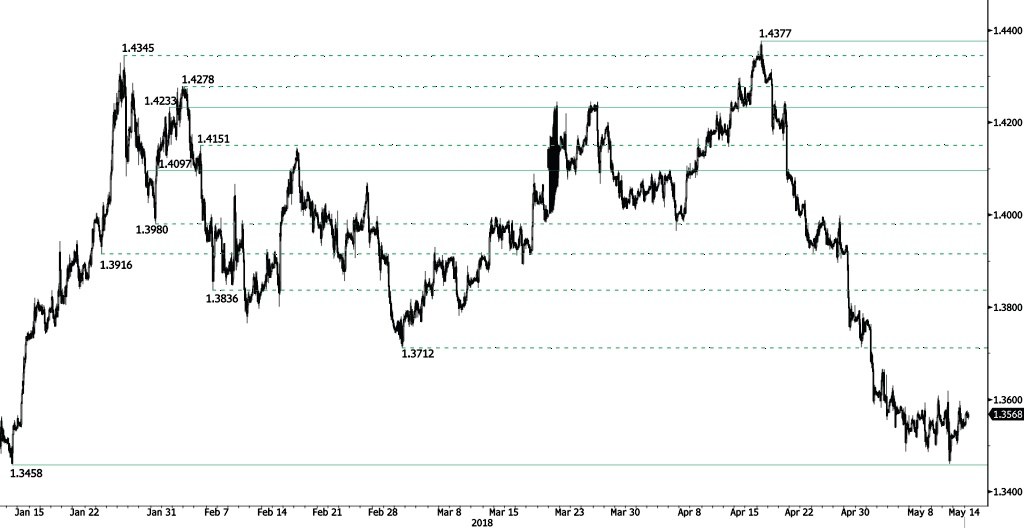
GBP/USD is increasing, trading above 1.3550 and heading along the 1.3575 range. The pair is currently trading at mid-January 2018 levels. Hourly support and resistance are given at 1.3458 (11/01/2018 low) and 1.4097 (29/01/2018 high). The technical structure suggests shortterm increase.
The long-term technical pattern is reversing. The Brexit vote had paved the way for further decline but the pair is moving to 2016 highs. Long-term support and resistance are given at 1.1841 (07/10/2017 low) and 1.5018 (24/06/2016 high).
EUR/USD Heading Higher
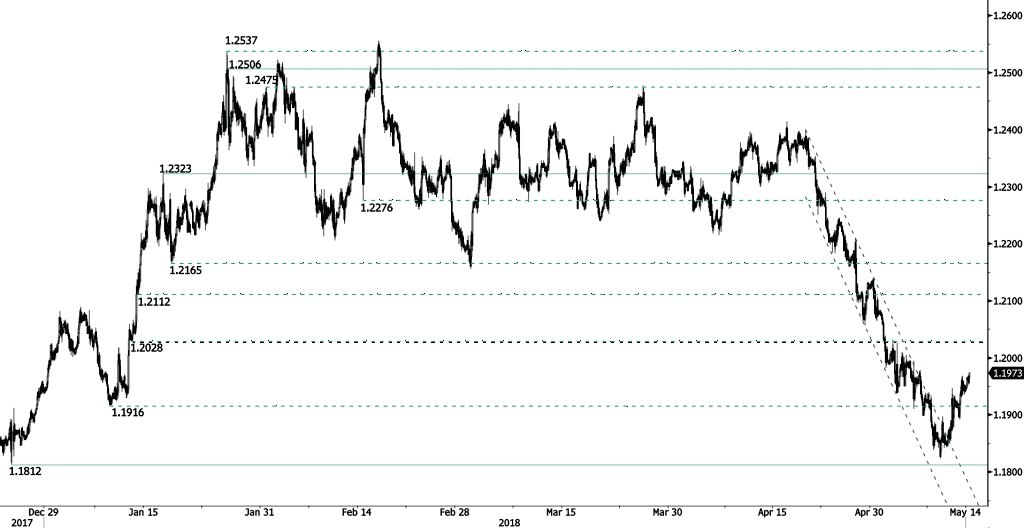
EUR/USD bullish pattern continues, bouncing off from 1.1826 (09/05/2018 low) and heading along the 1.1975 range. The pair is currently trading at mid-January 2018 levels. Hourly support and resistance are located at 1.1812 (25/12/2017 low) and 1.2323 (17/01/2018 high). The technical structure suggests short-term upward moves.
In the longer term, the momentum is turning largely positive. We favor a continued bullish bias. Key resistance is holding at 1.2886 (15/10/2014 high) while strong support lies at 1.1554 (08/11/2017 low).
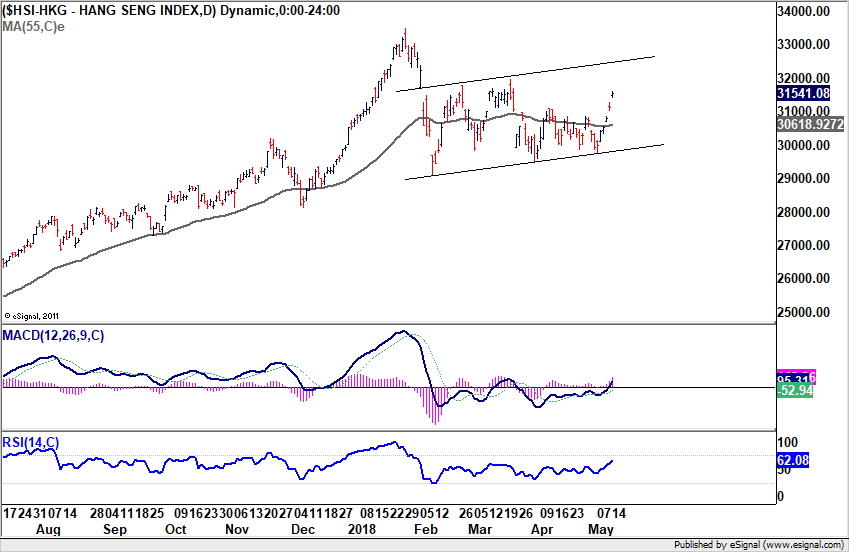
Trump offered concession ahead of US-China trade talks, Hong Kong HSI gains 1.35%
China's Vice Premier Liu He, President Xi Jinping's top economic adviser is traveling to Washington to start the second round of trade talks tomorrow, with US Treasury Secretary Steven Mnuchin. Liu and his team will stay from May 15 to 19 according to a Foreign Ministry spokesperson.
Ahead of the meeting, Trump said he was working with Xi to help get Chinese telecoms company ZTE back in to business.
https://twitter.com/realDonaldTrump/status/995680316458262533
And he added that
https://twitter.com/realDonaldTrump/status/995746011321597953
White House spokeswoman Lindsay Walters confirmed that US officials were in contact with Beijing about ZTE. And, Commerce Secretary Wilbur Ross is expected to "exercise his independent judgment, consistent with applicable laws and regulations, to resolve the regulatory action involving ZTE based on its facts."
This is seen a concession by Trump ahead of the trade talks. And the news lifted Hong Kong stocks sharply higher. Hong Kong HSI gained 419.02 pts, or 1.35%, to close at 31541.08.
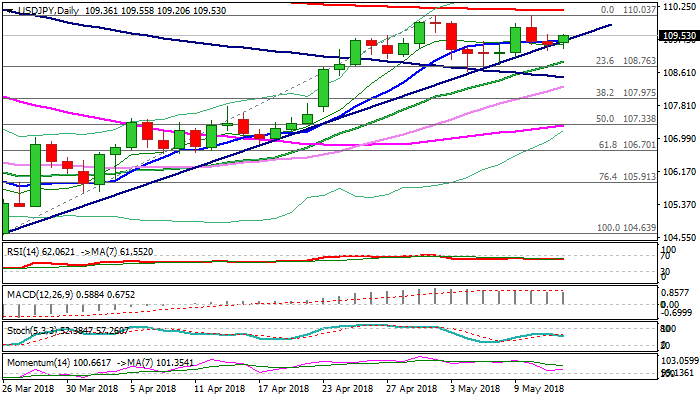
USDJPY – Bullish Bias Remains Intact After Shallow Pullback, 110 Barrier And 200SMA Focused
The pair regains traction and returns above 10SMA (109.40) in early European trading on Monday, after two-day pullback from 110.00 barrier met bids at 109.15 (Fibo 61.8% of 108.64/110.01 upleg) on Friday. Overall bullish structure keeps the upside in focus for renewed attack at psychological 110 barrier (where double upside rejection occurred) and 200SMA 110.15. Firm break above 110.00/15 pivots would generate strong bullish signal for extension of larger upleg from 104.63 (26 Mar) towards targets at 110.48 (02 Feb high) and 110.87 (Fibo 61.8% of 114.73/104.63 fall). The action is underpinned by rising 20SMA (108.90). Alternative scenario requires break below 20SMA and 108.64 (congestion low) to generate bearish signal for deeper pullback from 110 double-top.
Res: 109.83, 110.03, 110.15, 110.48
Sup: 109.41, 109.15, 108.90, 108.64
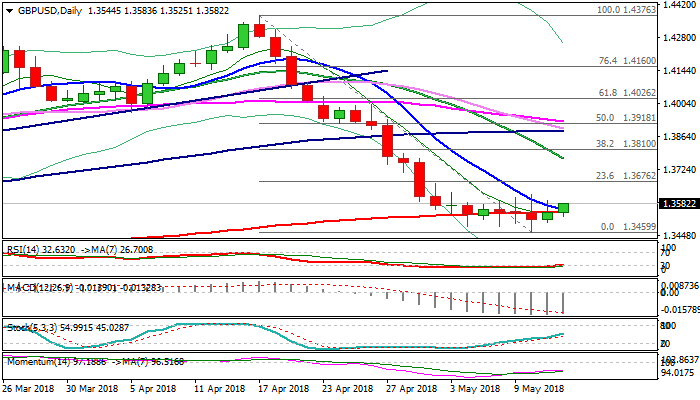
GBPUSD Holds In Extended Sideways Mode, The Downside Remains Vulnerable
Cable was a tad higher in early Monday’s trading but remains within multi-day range. Multiple Doji’s confirm strong indecision after steep fall from post-Brexit recovery high at 1.4376 started to run out of steam but basing attempts so far lack confirmation.
Brief extension higher today broke above converged 200 and 10SMA’s which is seen as initial positive signal, however, threats of formation of stronger bearish signal on formation of 10/200SMA death-cross, see near-term risk still skewed lower.
Bearish setup of daily MA’s and momentum studies turned sideways add to existing pressure as thick 4-hr cloud weighs heavily, keeping in play risk of recovery stall and fresh attempts lower. Bearish scenario requires firm break through recent range floor and violation of next pivot at 1.3442 (Fibo 38.2% of 1.1930/1.4376 recovery) to generate stronger bearish signal.
On the other side, close above congestion top at 1.3617, would be bullish signal for extension of recovery from 1.3460 (10 May low).
Res: 1.3596, 1.3617, 1.3676, 1.3742
Sup: 1.3557, 1.3546, 1.3500, 1.3484
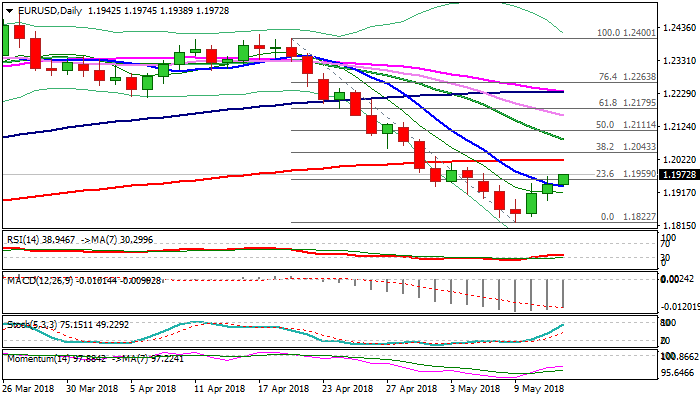
EURUSD Maintains Positive Near-Term Tone, Eyes Key Barriers At 1.2018/46
The Euro stands at the front foot at the beginning of the week and attempts to extend recovery leg from last week's low at 1.1822 (the lowest since 22 Dec).
Weaker dollar on fading expectations for more aggressive Fed's approach to the interest rates in 2018, as recent weak data lowered the likelihood that Fed would hike rates more times this year than initially planned.
The Euro is firmly above falling 10SMA on Monday, which now acts as initial support at 1.1934 and probes into falling thick 4-hr cloud (spanned between 1.1951 and 1.2046), with sustained break of cloud base to look for test of key barriers at 1.2018 (200SMA) and 1.2046 (4-hr cloud top / Fibo 38.2% of 1.2400/1.1822 descend) break of which would generate reversal signal.
The signals from daily techs are still mixed as RSI and slow stochastic head north, but 14-d momentum turned sideways after rallying in past two days, however, a plenty of bullish signals on lower timeframe charts keeps the single currency supported for now.
Close above 10SMA is a minimum requirement for fresh bull's extension towards 1.2018/46 pivots.
Conversely, fresh downside risk could be expected on fall and close below 10SMA.
Res: 1.1995, 1.2018, 1.2046, 1.2082
Sup: 1.1934, 1.1891, 1.1871, 1.1843
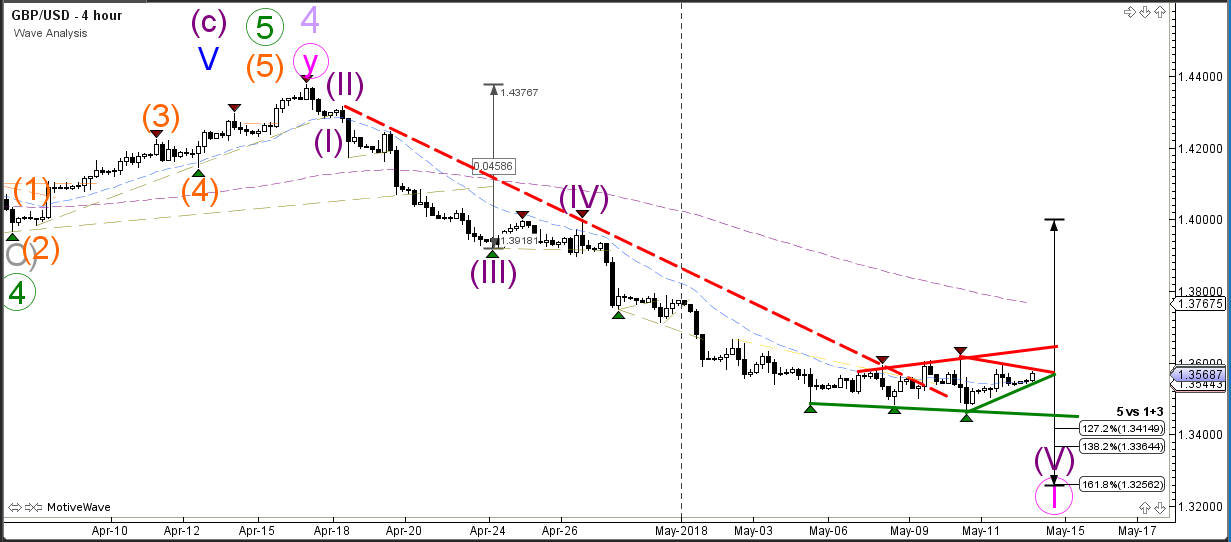
GBP/USD Bullish Retracement Within Bearish Trend Aims At 1.36
The GBP/USD is building a consolidation pattern after a strong bearish impulse. A bearish breakout could indicate a downtrend continuation within wave 5 (purple) towards the Fibonacci targets whereas a bullish breakout could confirm the completion of wave 5 of wave 1 (pink) at the most recent low. A bullish reversal would only become more likely if price is able to break above the previous tops which could indicate the completion of the wave 1 (pink) and the start of the wave 2 (pink).
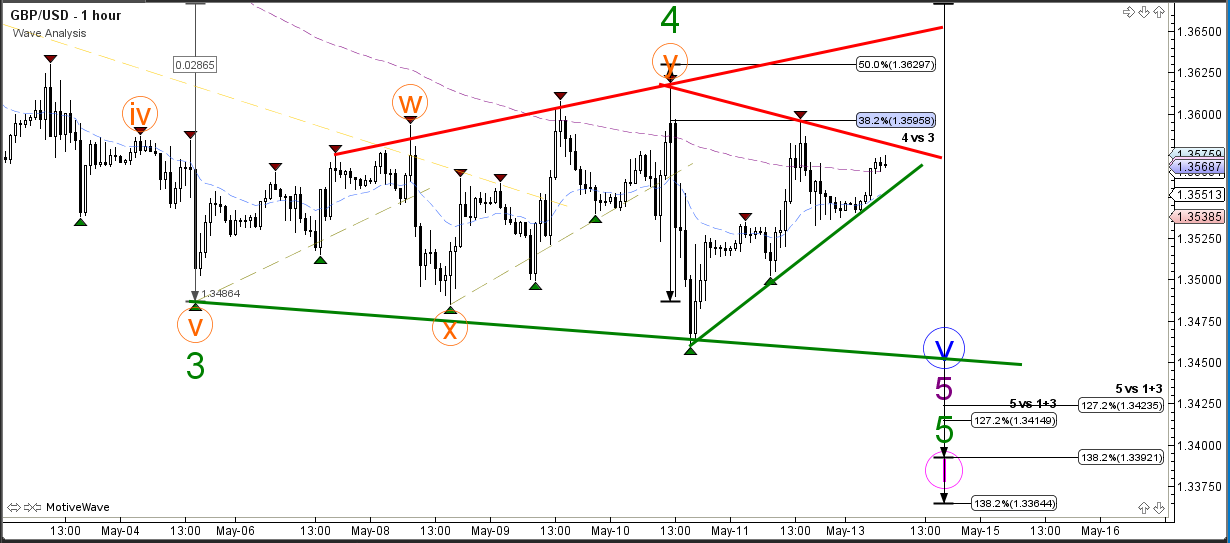
The GBP/USD could still be in an expanded wave 4 (green) but price should stay below the 50% Fibonacci still respected the Fibonacci levels of wave 4 (green) despite the volatile news events on the GBP. Price made a first attempt to break support but failed to close strongly below 1.35. Price will need to break above the resistance (red) or below the support (green) trend lines before a next impulsive price action can be expected.
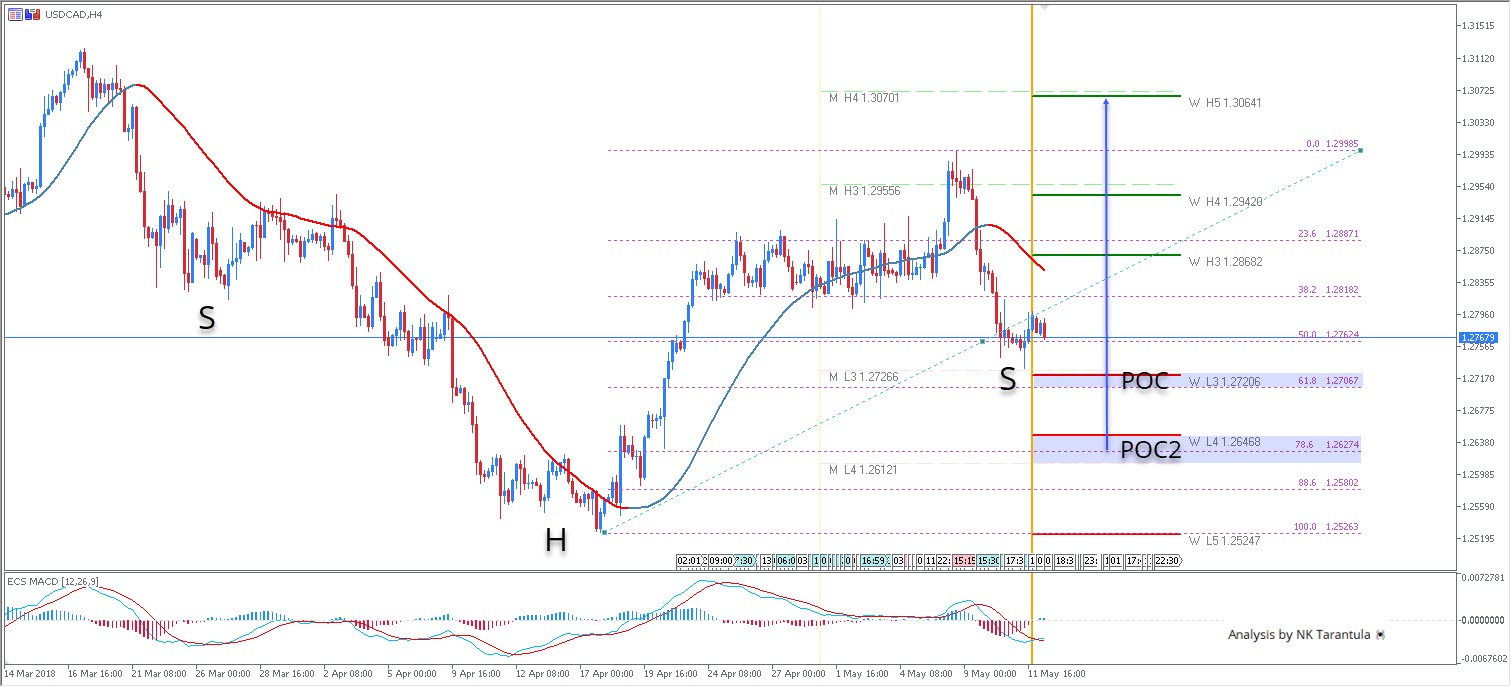
USDCAD Inverted Head And Shoulders In 4 Hour Timeframe
Technically speaking, the USD/CAD has been in a downtrend in 4h timeframe, but at this point it is looking a bit supported. The pair has formed two POC zones. The POC 1 1.2705-1.2720 ( W L3, 61.8, M L3, right shoulder) is the interim support zone and the bounce is expected as long as the price holds above the zone. In the case of a deeper retracement, the POC 2 is valid as the second POC zone 1.2625-50 ( W L4, M L4, 78.6, historical buyers) and as long as the pair is above 1.2520, there is a potential for upside targets. Targets are 1.2868, 1.2955 and 1.3060.
W L3 - Weekly Camarilla Pivot (Weekly Interim Support)
W H3 - Weekly Camarilla Pivot (Weekly Interim Resistance)
W H4 - Weekly Camarilla Pivot (Strong Weekly Resistance)
M H4 - Monthly Camarilla Pivot (Very StrongMonthly Resistance)
ML3 – Monthly Camarilla Pivot (Monthly Support)
ML4 – Monthly H4 Camarilla (Very Strong Monthly Support)
POC - Point Of Confluence (The zone where we expect price to react aka entry zone)