Sample Category Title
AUDUSD Extends Recovery But Strong US Inflation Numbers Could Limit Rally
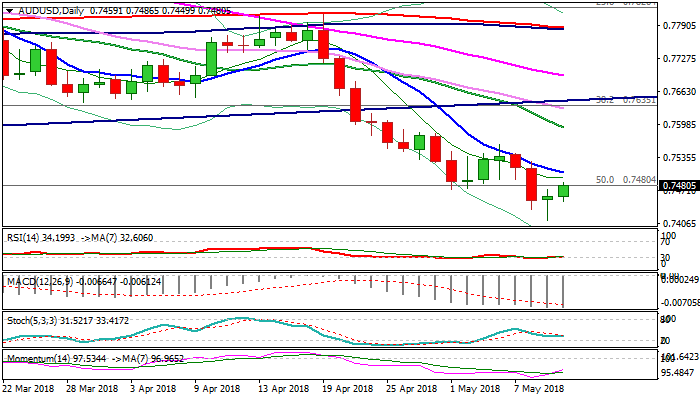
The Aussie dollar extends bounce from 11-month low at 0.7412 on Thursday, following strong downside rejection previous day, which left long-tailed Doji candle.
Fresh recovery hit session high at 0.7486 so far and generates initial bullish signal as reversal pattern is forming on daily chart.
North-heading 14-d momentum and daily RSI emerging from oversold territory are positive signals, but conflicting with falling MA’s in firm bearish setup.
Close above 10SMA (0.7506) would provide additional bullish signal and sideline existing downside risk for stronger corrective action.
US inflation data are key, as upbeat results would boost the US dollar and neutralize current positive signals, for fresh extension of bear-leg from 0.7812 (19 Apr lower top).
Res: 0.7486, 0.7506, 0.7527, 0.7560
Sup: 0.7450, 0.7412, 0.7370, 0.7321
NZDUSD Slips To 0.6900 Key Barrier Touching 5-Month Low
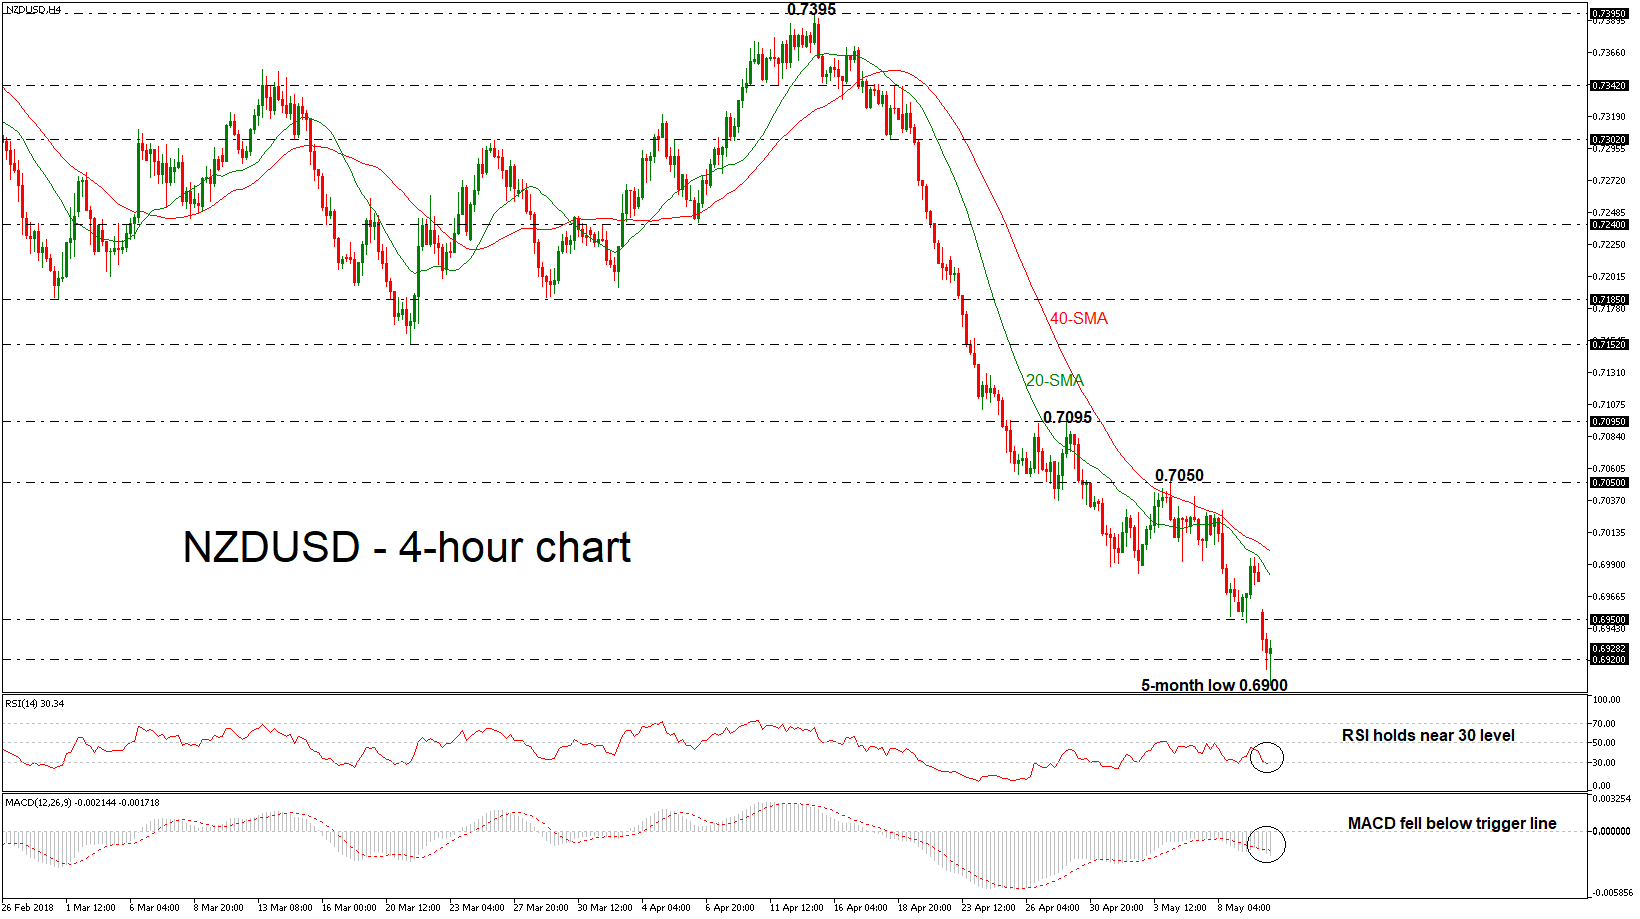
NZDUSD starts the day with a gap down and an aggressive bearish rally recording a fresh five-month low around the 0.6900 psychological level. The negative momentum remains in play as technical indicators endorse the scenario for further declines.
Technically, in the 4-hour chart, the RSI indicator slipped near the 30 level and is trying to enter the oversold zone, while the MACD oscillator is strengthening its negative bias as it is holding below its trigger and zero lines. In addition, the 20- and 40-simple moving averages (SMAs) are following the price action and refused to create a bullish cross in the previous days.
In case of further declines in the pair, immediate support may be found near the 0.6820 support level, identified by the December 8, 2017 low. If sellers manage to push below that hurdle too, that would mark a lower low in the 4-hour chart, increasing the probability for further bearish extensions. Support may be found initially near 0.6780, taken from the low on November 11, 2017.
However, if the market manages to pick up speed and climb above 0.6950, the 20 and 40 SMAs could as strong resistance levels for the bulls at 0.6980 and 0.7000 respectively. Clearing these key levels would see additional gains towards the 0.7050 resistance barrier.
EUR/USD Expected To Gain Bullish Sentiment
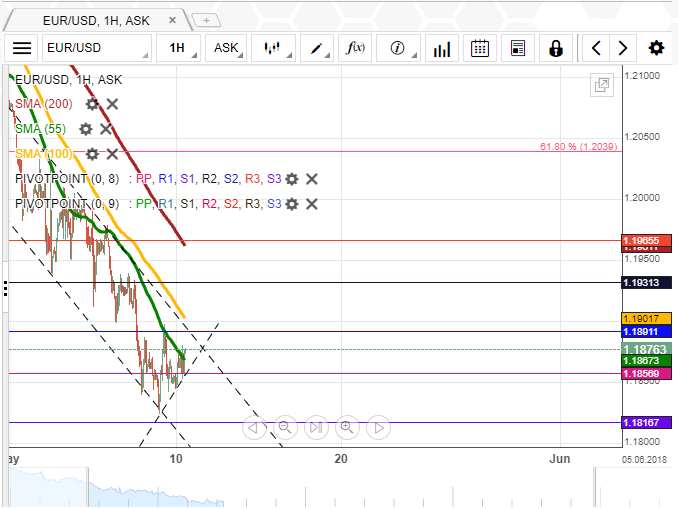
Following a slight period of weakness on Wednesday morning, the Euro picked up momentum against its American counterpart and reached the 55-hour SMA. This line nevertheless continued to pressure the rate, thus guiding its movement during the second part of the day. By Thursday morning, the Euro had returned near the combined resistance of the weekly S1 and the 55-hour moving average.
Technical indicators are starting to recover both on the 1H and 4H time-frames, demonstrating that the expected medium-term appreciation might be under way.
The base scenario for this session favours a breakout from the 1.1880 area and a subsequent surge to the 100-hour SMA at 1.1920. This level should likewise surrender and allow for further advance towards 1.20.
Pound Awaits Fundamentals
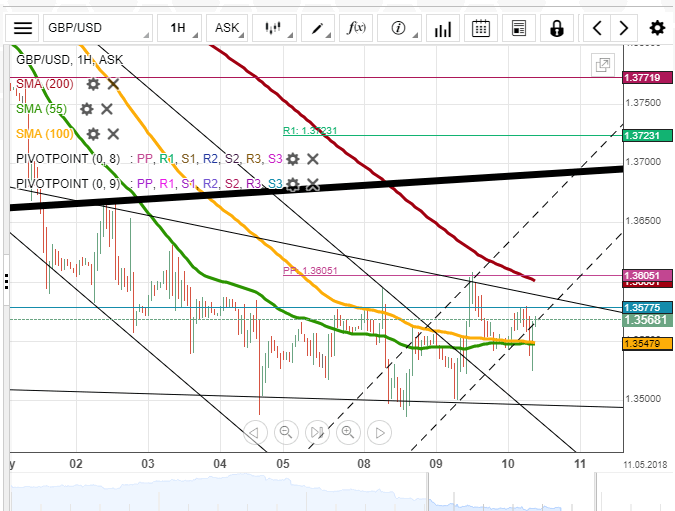
Despite generally bearish indicators, the Sterling eventually gathered the necessary upside momentum to dash through the 55– and 100-hour SMAs and reach the weekly PP at 1.36 on Wednesday. In a longer perspective, the pair's movement during the past two weeks has been stranded in a triangle-like formation.
In case its upper boundary, likewise reinforced by the 200-hour SMA and the weekly PP, is surpassed, a subsequent surge up to the breached senior channel at 1.37 is likely to follow.
In terms of today, the pair is expected to fluctuate in between all three SMAs prior to the UK Monetary Policy Summary today at 1100GMT. In the event of a negative surprise, the Sterling should target either the bottom triangle line or the weekly S1 at 1.3500 and 1.3417, respectively.
USD/JPY Strong Support Ahead
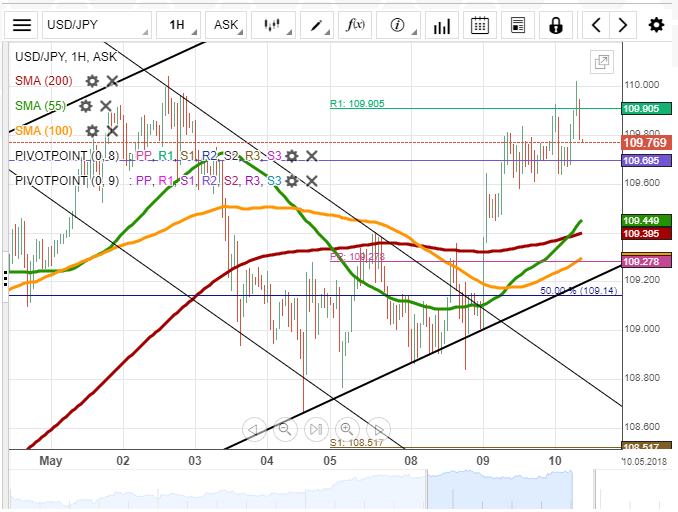
The strong two-hour surge on Wednesday morning was followed by a period of consolidation slightly below the weekly R1. This lack of direction was also maintained during this Asian session.
In general, the US Dollar managed to move away from the bottom boundary of the seven-week channel up. The pair's consolidation allows to think that the rate might be ready for a minor correction south today. However, this fall should not be significant, as the 109.20 area is supported by the 55-, 100– and 200-hour SMAs and the 50.0% Fibo retracement. It is unlikely that bears manage to breach this strong support cluster, thus leaving the rate near 110.00 early on Friday.
In case the bullish sentiment prevails, the pair is to target the weekly R2 at 110.60.
XAU/USD Supported By SMAs
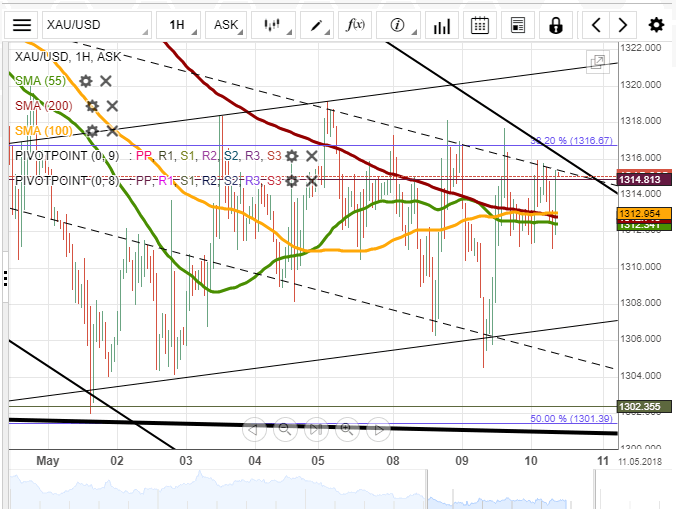
High volatility was apparent for the XAU/USD pair on Wednesday. It was driven by downside momentum during the first part of the day, while bullish force dominated the pair later in the session. Subsequently, the rate being stranded between all three SMAs and the upper channel line resulted in a minor period of consolidation.
Two channels demonstrate that the pair's subsequent movement should be south down to the 1,305.00 mark. In order to confirm this bearish scenario, traders should see if the yellow metal is able to breach the 1,312.00 area during the following hours.
Conversely, a breach from the medium-term channel and the 38.20% Fibo retracement at 1,316.50 could mark the beginning of a few-day appreciation. Today's upside target is the monthly PP at 1,330.00.
GBP shrugs off UK trade deficit and production, await BoE
UK visible trade deficit widened to GBP -12.3B in March, from GBP -10.2B versus expectation of GBP -11.4B. Full release here.
Industrial production dropped rose 0.1% mom, 2.9% yoy in March, versus expectation of 0.2% mom, 3.1% yoy. Full release here.
Manufacturing production dropped -0.1% mom, rose 2.9% yoy in March, versus expectation of -0.2% mom, 2.9% yoy.
Construction output dropped -2.3% mom in March versus expectation of -2.2% mom.
GBP remains steady in tight range against USD and JPY after the data. Traders remain cautious ahead of BoE rate decision, voting and inflation report.
Forex Technical Analysis: EUR/USD, USD/JPY, GBP/USD
EUR/USD
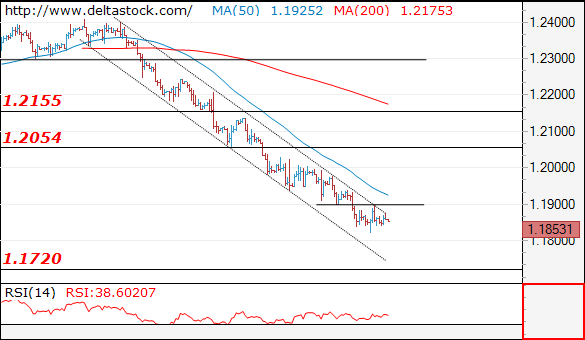
Current level - 1.1853
The downtrend remains intact and the rebound after 1.1820 should be considered corrective, preceding a dip to 1.1720. Initial intraday resistance lies at 1.1900, followed by 1.1938, but crucial on the upside is 1.2000.
| Resistance | Support | ||
| intraday | intraweek | intraday | intraweek |
| 1.1900 | 1.2060 | 1.1840 | 1.1840 |
| 1.2060 | 1.2160 | 1.1720 | 1.1720 |
 USD/JPY
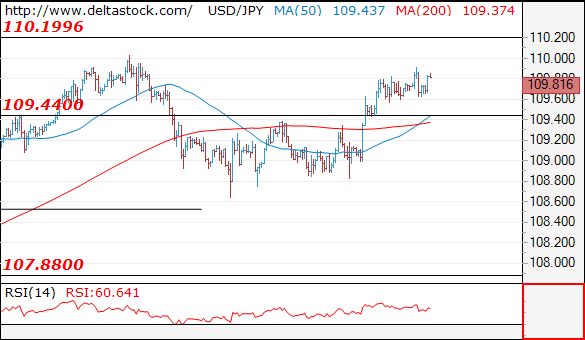
Current level - 109.81
My outlook is counter-trend against 110.00 high, for a reversal and attack of 109.44 support zone.
| Resistance | Support | ||
| intraday | intraweek | intraday | intraweek |
| 110.00 | 110.20 | 109.44 | 107.90 |
| 110.20 | 111.90 | 108.50 | 104.60 |
GBP/USD
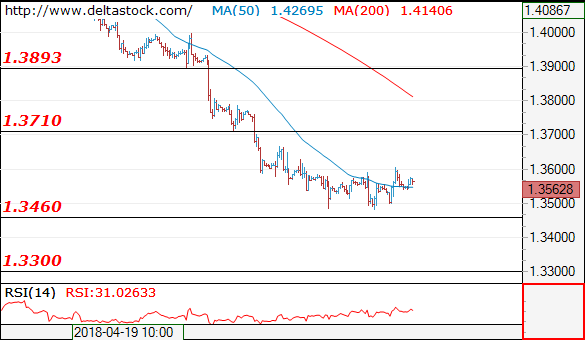
Current level - 1.3562
Current rebound above 1.3480 should be considered corrective and although there is a risk of an intraday spike to 1.3660 resistance, the overall bias remains bearish, for a slide towards 1.3300.
| Resistance | Support | ||
| intraday | intraweek | intraday | intraweek |
| 1.3660 | 1.3990 | 1.3500 | 1.3460 |
| 1.3710 | 1.4100 | 1.3460 | 1.3310 |
USD/JPY Uptrend Faces Head And Shoulders Pattern At 110 Resistance
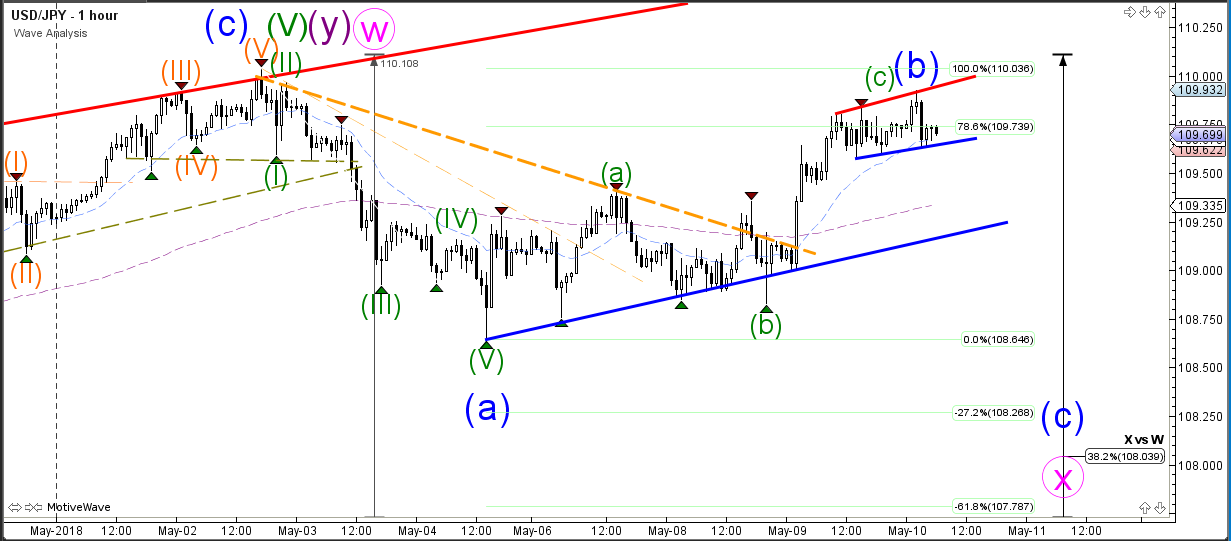
The USD/JPY is in an uptrend channel and price has recently broken above the resistance trend line (dotted orange) but price is struggling to break above the previous top at 110. A bullish break above the previous high could indicate a continuation of the uptrend whereas a failure to break above the top and a break below the support trend line (blue) could be part of a larger ABC correction (blue). In that case, a reversal head and shoulders pattern could be taking place (purple boxes).
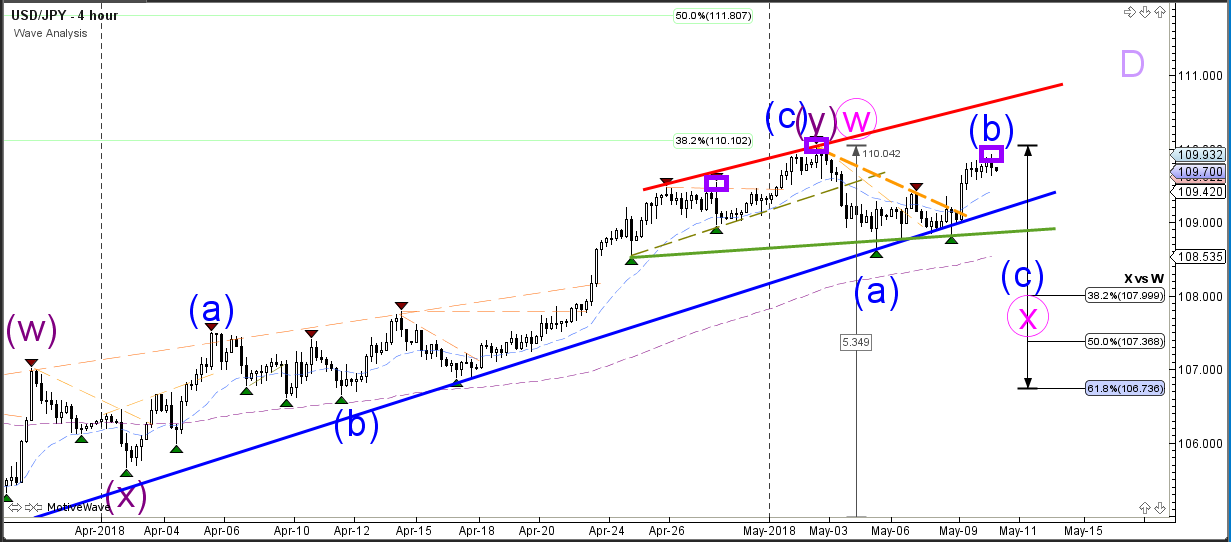
A bullish breakout above the 110 resistance level could indicate an extension of the wave W (pink) towards the 50% Fib at 111.50 whereas a bearish break aims at 108-107.50.Good trading,
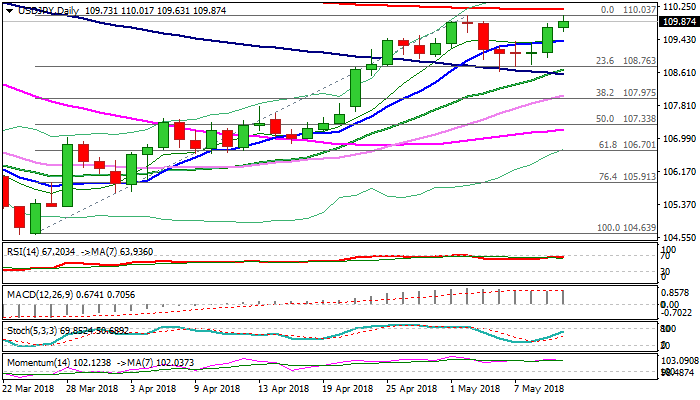
USDJPY – Fresh Bulls Retest 110 Barrier, Strong US CPI Data To Help Final Break Above 200SMA
The holds firm tone on Thursday and hits 110 barrier again, in extension of strong rally previous day. Full bullish setup of daily techs supports positive sentiment for eventual break above key barriers at 110.00/16 (psychological resistance/200SMA) to signal continuation of larger rally from 104.63 (26 Mar low). Close above 200SMA will be bullish signal for extension towards targets at 110.48/87 (02 Feb high/Fibo 61.8% of 114.73/104.63 Nov/Mar fall). Upbeat US inflation data (Apr CPI 0.3% f/c vs -0.1% prev, Core 2.2% f/c vs 2.1% prev) would boost the greenback for final break higher. Broken 10SMA offers support at 109.42, which is expected to contain dips, while return below Wednesday's low (108.99) would generate initial bearish signal.
Res: 110.03, 110.16, 110.48, 110.87
Sup: 109.63, 109.42, 108.99, 108.70