Sample Category Title
Pound Punished by “Dovish Hold”
The Pound has suffered steep losses once again against the Dollar and other major counterparts on Thursday after the Bank of England (BoE) kept interest rates unchanged as expected.
The catalyst behind the latest round of punishment for the Sterling was likely the BoE trimming down its inflation targets, although lowering growth forecasts until the end of next year has also not helped investor sentiment. Both factors combined are likely to lead to UK interest rate expectations being even further pushed back.
Inflation is now expected to slow to its 2% target faster than anticipated, providing less reason to believe that the BoE will be in a hurry to raise UK interest rates.
Although Carney appeared more upbeat during the press conference than might have been expected, this did little to help the battered Pound.
Overall and despite the expectations for a UK interest rate increase being minimal following the reversal over the past month, spectators are viewing the conclusion of today’s meeting as a “Dovish Hold”. The likelihood moving forward is that investors are going to continue to remain suspicious over whether the BoE will raise UK interest rates this year, meaning that the Pound is likely to be at threat to further pain as a result.
AUDUSD: Rallies On Correction
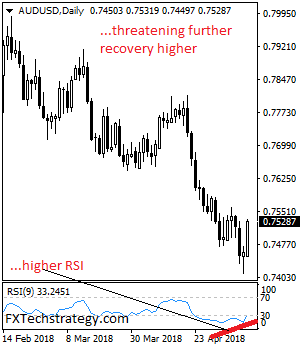
AUDUSD: The pair looks to strength further as it was seen rallying during early Thursday trading session. On the downside, support resides at the 0.7500 level where a breach will aim at the 0.7450 level. Below that level will set the stage for a run at the 0.7400 level with a cut through here targeting further downside pressure towards the 0.7350 level. On the upside, resistance lies at the 0.7600 level. A cut through here will turn attention to the 0.7650 level and then the 0.7700 level where a violation will set the stage for a retarget of the 0.7750 level. On the whole, AUDUSD faces further recovery threats.
US: Inflation Pressures Lose a Bit of Upward Momentum in April
The headline consumer price index (CPI) bounced back 0.2% (month-on-month) in April, after a 0.1% decline in March. That took inflation up to 2.5% (year-on-year), continuing its upward march since last June.
A 1.4% increase in energy prices helped buoy headline inflation in April, as prices at the pump rose 3%, following a 4.9% decline in March. Energy prices were 7.9% higher than their year-ago level, largely reflecting increases in petroleum-related prices.
Core inflation was up 0.1% on the month, slightly less than expected. That left the year-on-year pace of core inflation steady at 2.1% in April. The slight loss of momentum in core inflation was due to core services prices, which rose 0.2% in April. Core goods prices on the other hand were down 0.1% on the month, just like in March.
Delving further into the details on services, shelter inflation remained healthy, up 0.3% on the month. However, other services prices were softer, such as medical care (+0.1%), education & communication (0.0%) and recreation (-0.4%), which had its biggest decline since 2009 thanks to price declines for things like cable bills and admission prices. Overall inflation for core services remained at 2.9% in April, the same as March's pace.
While core goods prices remain in deflationary territory, some key items are seeing increased price pressures. Apparel for example rose 0.3% on the month, and is now up 0.8% from a year ago. Still prices for used cars & trucks fell (-1.6%), as the recent price spike corrects. Airline fares also fell (-2.7%) on the month, and are down 6.9% from a year ago.
Also notable in April was a 0.3% increase in food prices, the largest increase in over a year. The year-on-year pace of food inflation remains modest at 1.4%, but has been trending upwards over the past 18 months.
Key Implications
April's inflation data reminds us that while we expect inflationary pressures to continue to rise, it is unlikely to be a linear process. There is some residual seasonality in price measures in the U.S., where hot price increases early in the year are followed by a period of softer readings. We continue to expect core inflation to continue to rise as a strong economy and wage pressures see price hikes percolate through the economy (see our recent report).
Now that the Fed's preferred PCE metric (headline) reached the 2% target in March, the question is how much more juice is still in the tank. The uncertain impact of tax cuts and increased government spending present upside to the outlook, but recent financial volatility and the threat of trade wars threaten to deflate some of the stimulus. This is the key question the FOMC is wrestling with as it calibrates the pace of rate hikes. Another quarter-point rate hike looks like a done deal at the next meeting on June 13th. More important will be the Fed's updated economic projections released at the same time, which will give us a sense of whether the Fed has cha
US Inflation Rose a Bit Less than Expected in April but Remains Firm
Highlights:
- All items CPI rose 0.2% month-over-month in April while prices excluding food and energy were up 0.1%. Both increases were a tenth short of expectations.
- A 3% monthly increase in gasoline prices put upward pressure on headline inflation. That could be a factor again in May with pump prices remaining firm early in the month and WTI oil prices sitting north of $70 per barrel.
- Sizeable monthly declines in used car and recreation prices—both the largest since 2009—were behind the downside surprise in core inflation.
- The year-over-year rate of headline inflation rose to 2.5% in April, the second-highest rate since 2012. Annual core inflation of 2.1% was unchanged from March but up from 1.8% in February.
Our Take:
A slight undershoot on core prices left today’s CPI release a bit short of expectations. But taking a step back, year-over-year core inflation was on the firmer side of the Fed’s 2% objective for a second consecutive month. Rising gasoline prices pushed the headline rate to its second-highest reading since 2012. And even with a 0.1% increase in April, monthly core inflation is still running closer to a 2-1/2% annualized rate so far this year. So today’s report remains consistent with the view that inflation risks are increasingly skewed to the upside of 2%. We think the Fed no longer mentioning they are “monitoring inflation developments closely” in May’s policy statement was a reference to that.
Higher oil prices and easy year-ago hurdles for core inflation point to year-over-year inflation continuing to pick up in the near-term. That should reinforce the recent move in breakeven inflation rates, which are now their highest since August 2014. Rising spot inflation and firmer inflation expectations will keep the Fed raising rates steadily but gradually this year and next. We expect a rate increase at the next meeting in June, and wouldn’t be surprised if the ‘dot plot’ consensus finally shifted to our view that a total of four rate hikes will be appropriate this year.
GBP/USD Mid-Day Outlook
Daily Pivots: (S1) 1.3494; (P) 1.3550; (R1) 1.3602; More...
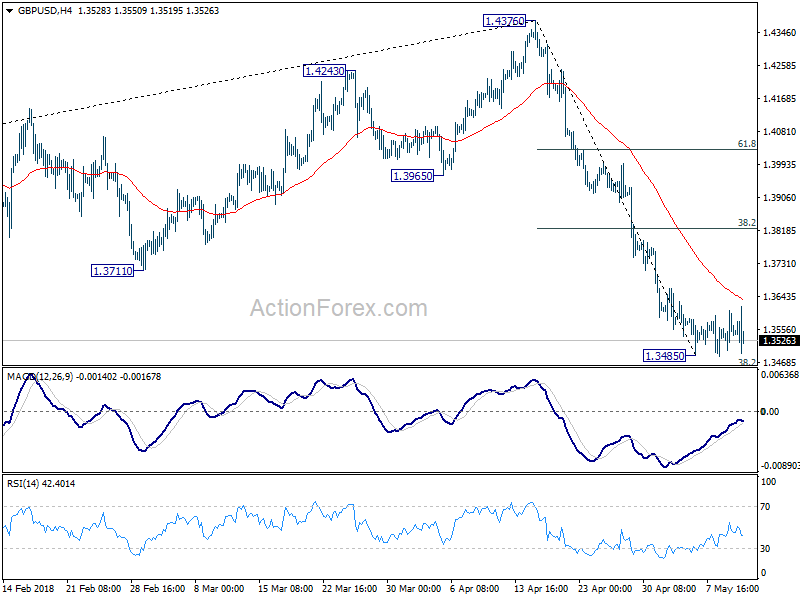
Intraday bias in GBP/USD remains neutral as consolidation from 1.3485 low is still extending. In case of another recovery, upside should be limited by 38.2% retracement of 1.4376 to 1.3485 at 1.3825 to bring fall resumption. Break of 1.3485 will resume the fall from 1.4376. Further break of 1.3448 fibonacci level will target 1.2874 and below.
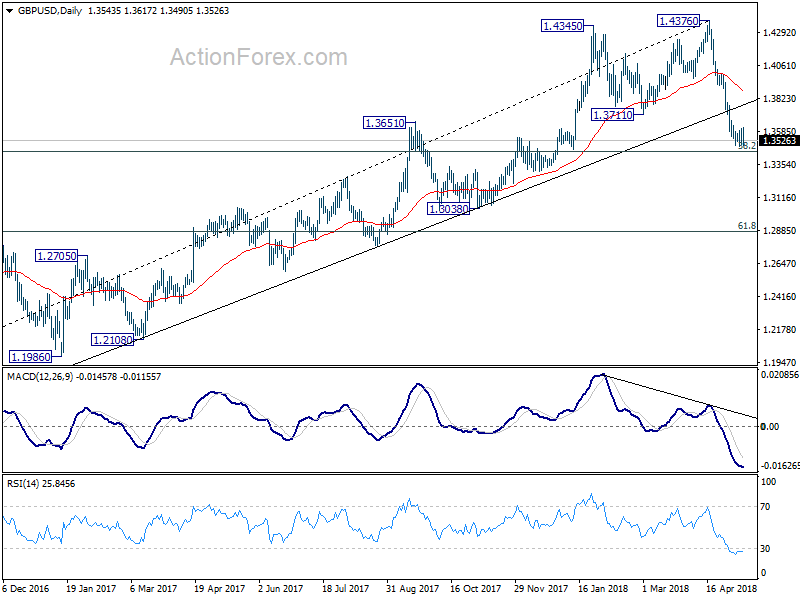
In the bigger picture, current development suggests that whole medium term rebound from 1.1936 (2016 low) has completed at 1.4376 already, with trend line broken, on bearish divergence condition in daily MACD, after rejection from 55 month EMA (now at 1.4223). Deeper decline should be seen to 38.2% retracement of 1.1936 (2016 low) to 1.4376 at 1.3448 first. Break will target 61.8% retracement at 1.2874 and below. Outlook will stay bearish as long as 55 day EMA (now at 1.3925) holds, even in case of strong rebound.
EUR/USD Mid-Day Outlook
Daily Pivots: (S1) 1.1816; (P) 1.1857 (R1) 1.1891; More....
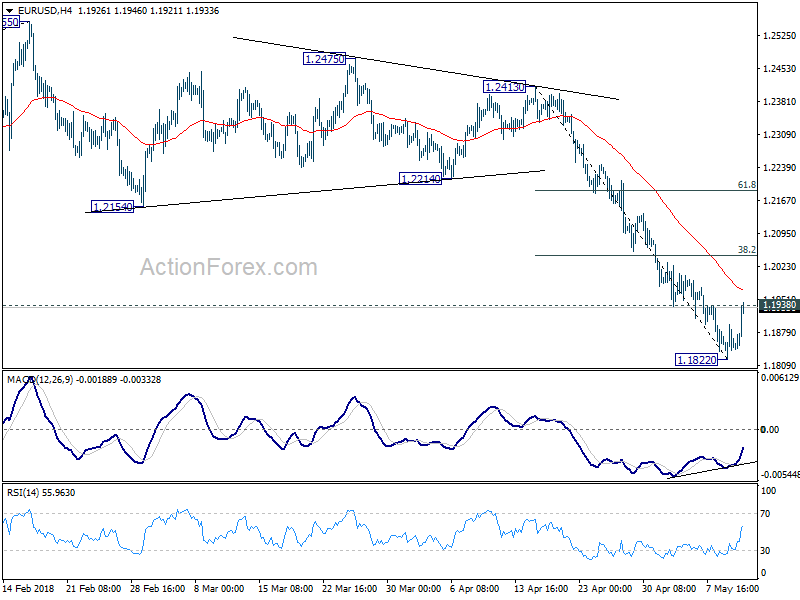
EUR/USD's break of 1.1938 minor resistance indicates short term bottoming at 1.1822, on bullish convergence condition in 4 hour MACD. Intraday bias is back on the upside for further recovery to 4 hour 55 EMA (now at 1.1971) and above. Though, we'd expect strong resistance form 38.2% retracement of 1.2413 to 1.1822 at 1.2048 to limit upside and bring another fall. On the downside, below 1.1822 will resume the whole decline from 1.255 and target 1.1708 medium term fibonacci level next.
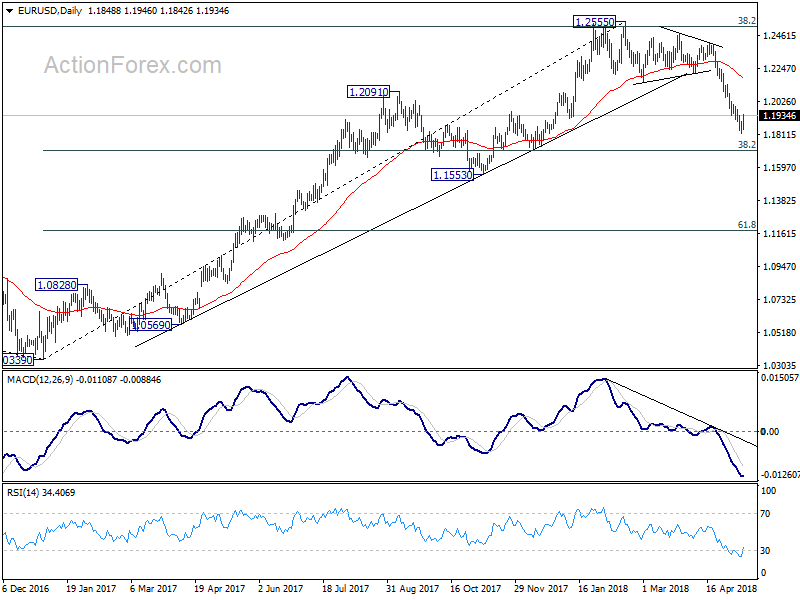
In the bigger picture, current decline and firm break of 1.2154 support confirms rejection by 38.2% retracement of 1.6039 (2008 high) to 1.0339 (2017 low) at 1.2516. A medium term top should be in place at 1.2555 and deeper decline would be seen back to 38.2% retracement of 1.0339 to 1.2555 at 1.1708 first. With current downside acceleration, there is prospect of hitting 61.8% retracement at 1.1186 before completing the decline. But still, we'll need to look at the structure before deciding if it's a corrective or impulsive move.
USD/CAD Mid-Day Outlook
Daily Pivots: (S1) 1.2794; (P) 1.2885; (R1) 1.2944; More....
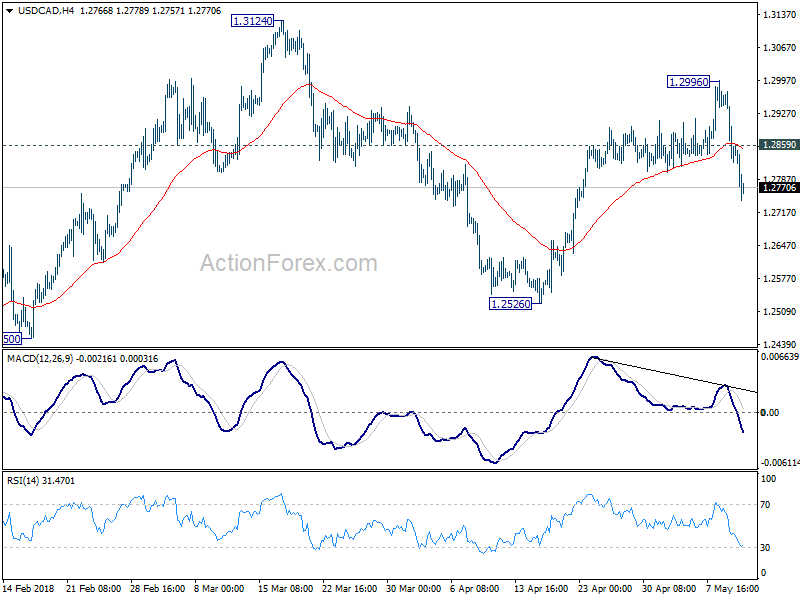
USD/CAD's sharp fall and break of 1.2802 indicates that rise from 1.2526 has completed at 1.2996 on bearish divergence condition in 4 hour MACD. Intraday bias is turned back to the downside for deeper retreat first. As long as 1.2526 support holds, we'd still favor the bullish case that rebound from 1.2061 hasn't completed. Above 1.2859 minor resistance will turn bias back to the upside for 1.2996 first. However, firm break of 1.2526 will resume the fall from 1.3124 to 1.2246 support and likely below.
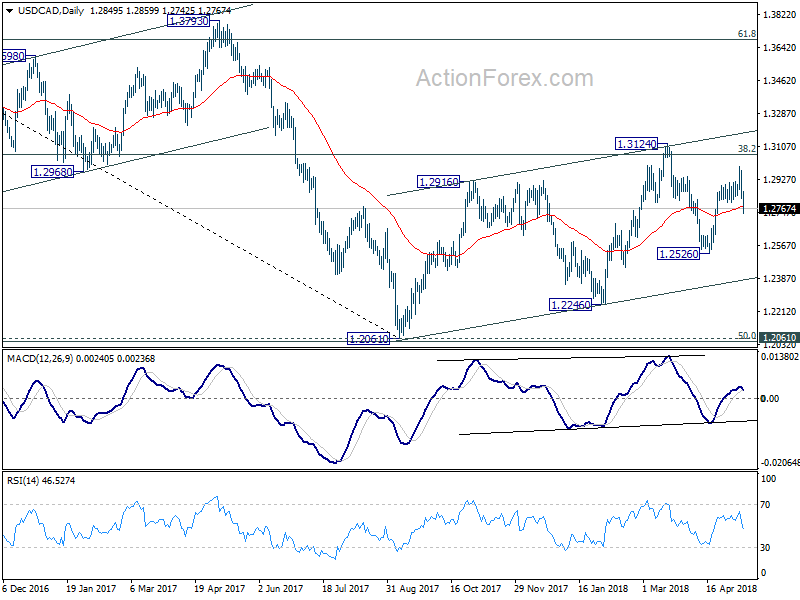
In the bigger picture, current development suggests that rebound from 1.2061 has not completed yet. Focus is back on 38.2% retracement of 1.4689 to 1.2061 at 1.3065. Sustained trading above there will confirm medium term bullish reversal. That is, down trend from 1.4689 has completed at 1.2061 already. In that case, next target will be 61.8% retracement at 1.3685. However, break of 1.2526 support will dampen this bullish view again. And, focus will be back on 1.2061 key support level, which is close to 50% retracement of 0.9406 (2011 low) to 1.4689 (2015 high) at 1.2048
BOE Downgraded Growth and Inflation Outlook. Market Bet for No Rate Hike This Year
BOE voted 7-2 to keep the Bank rate unchanged at 0.5% in May. The members voted unanimously to leave to asset purchase program unchanged at 435B pound. As we had mentioned in the preview (https://www.actionforex.com/action-insight/central-bank-analysis/92835-boe-could-be-more-dovish-than-hawkish-hold/), BOE’s message turned out more dovish than the market had anticipated. The staff revised lower GDP growth estimate for 2018 and inflation estimates over the forecasting horizon. As a result, the pound has dropped over 0.65% at one point against the euro and fluctuated around the 4-month low against US dollar. Although the central bank maintained the promise that interest rates would probably rise in the months ahead, the market has priced a no rate hike for the rest of the year after the announcement.
Acknowledging the weakness in the first quarter GDP growth, the central bank noted that it “had been consistent with a temporary soft patch, with few implications for ... the outlook for the UK economy”. At the press conference, Governor Mark Carney reiterated the judgment that the softening is a temporary problem, due to the snowy and icy weather which hit Britain earlier this year. He added that he labor market has remained robust, with the unemployment rate at 4-decade low. Yet, the minutes indicated that “there was value in seeing how the data unfolded over the coming months, to discern whether the softness in Q1 might persist”, suggesting the majority of voters preferred to keep the powder dry until it is confirmed that the first quarter weakness was due to temporary factors, instead of a trend. The staff revised lower the GDP growth forecast to 1.4% for 2018, down from +1.8% prior. The forecasts for 2019 and 2020 were unchanged at 1.7%. Inflation forecast was revised lower to +2.4% for this year, compared with +2.7% projected in February. For 2019 and 2020, inflation would slow further to +2.1% and +2%, from February’s estimates of +2.2% and +2.1%, respectively.
Brexit remains the biggest uncertainty to UK’s economic outlook. The minutes suggested that, “although business investment is still restrained by Brexit-related uncertainties, it is being supported, like exports, by strong global demand and accommodative financial conditions. Household consumption growth remains subdued, in line with the modest growth in real income over the forecast period”.
On the monetary policy outlook, the BOE largely left its stance unchanged. As the minutes suggested, “an ongoing tightening of monetary policy over the forecast period would be appropriate to return inflation sustainably to its target at a conventional horizon” if “the economy to develop broadly in line with the May Inflation Report projections”. It also affirmed that “all members agree that any future increases in Bank Rate are likely to be at a gradual pace and to a limited extent”. The market is now priced in no rate hike for the rest of the year. Indeed, the market has been losing confidence over communication of the BOE with Carney’s nickname of “unreliable boyfriend” returned. Carney has a track record of saying one thing and doing another since when he was the governor of Bank of Canada. Back in 2011, he had warned that monetary stimulus would be withdrawn. However, it was never realized by the time he left office in mid-2013.
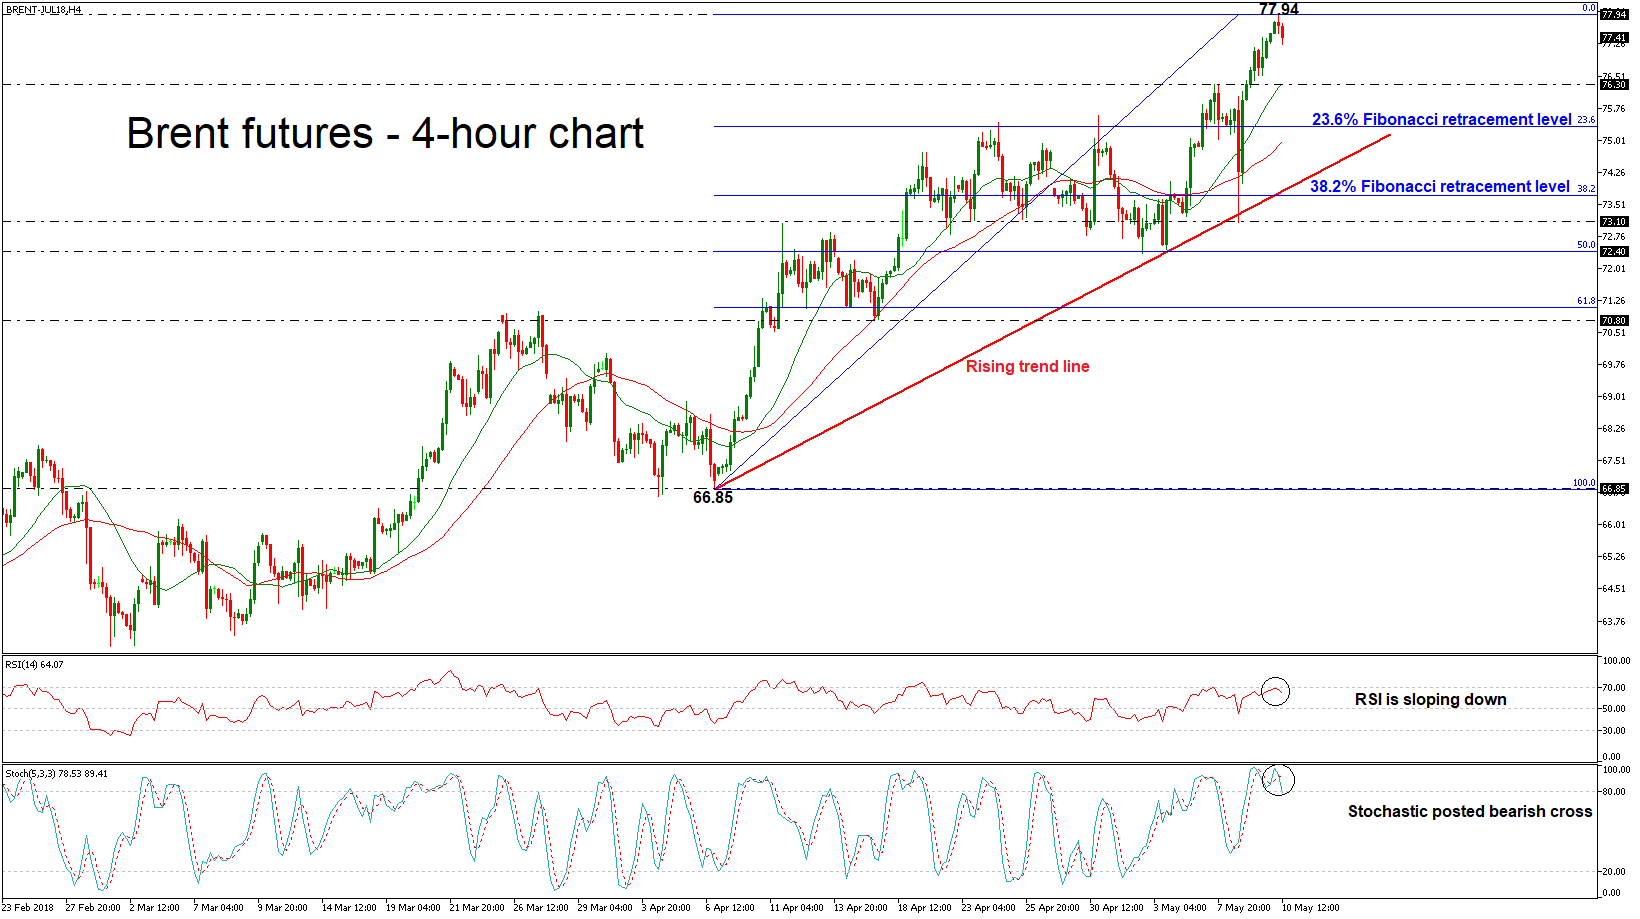
Brent Crude Oil Futures Erase Some Gains in the Near-Term after They Touch 3-Year High of 77.94
Brent crude oil has retreated over the last few hours after a sharp bullish rally in the past five days. On Thursday, the price posted a fresh more than three-year high of 77.94 and currently is paring some of its gains. However, the short-term technical indicators are bearish and point to more weakness in the market.
Looking at the 4-hour chart, oil prices are still developing above the 20- and 40-simple moving averages (SMAs) and are still pointing up. Meanwhile, the RSI indicator bounced off the overbought level and is losing ground, while the %K line of the stochastic oscillator posted a bearish cross in the overbought levels with the %D line, suggesting bearish retracement.
Upside moves are likely to find resistance at the more than three-year high of 77.94. Rising above this area would help shift the focus to the upside again towards the next immediate handle of 78.00. Breaking this level could see a test of the next psychological levels of 79.00 and 80.00.
In the short-term, the bearish phase remains in play especially if prices continue to trade below the high of the day. The next stop would come at 76.30, which coincides with the 20-SMA. Breaking this level, the price could move towards the 23.6% Fibonacci level of 75.33 of the upleg from 66.85 to 77.94. A successful close below this region could open the way for a touch of 38.2% Fibonacci mark of 73.71.
In the bigger picture, the market is bullish since April 6 following the rebound on 66.85.
EURUSD Extends Recovery after US Inflation Miss; Reversal Pattern is Forming on Daily Chart
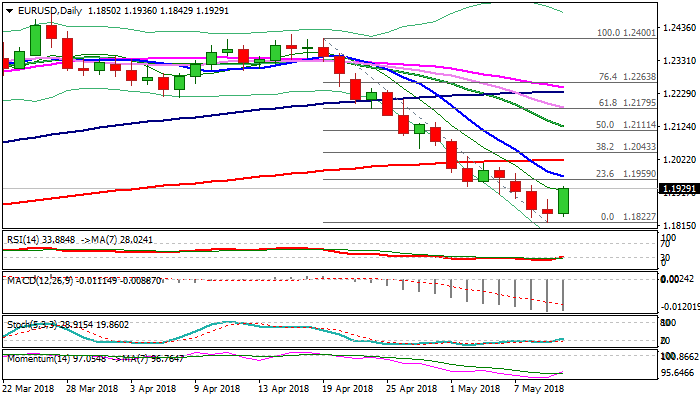
The Euro extended recovery above 1.19 handle as dollar fell after US inflation miss on Thursday.
US CPI rose 0.2% in April, undershooting forecast at 0.3% while core CPI also fell below expectations (2.1% in Apr vs 2.2% f/c) which could have negative impact on Fed’s interest rate path in 2018.
Profit-taking after steep fall also helped recovery as Wednesday’s Doji and today’s fresh acceleration higher are forming reversal pattern on daily chart.
Fresh acceleration higher needs lift above broken Fibo support at 1.1936 for bullish signal and close above falling 10SMA (1.1965) for confirmation of reversal to open way for stronger correction and expose next key barriers at 1.2017 (200SMA) and 1.2043 (Fibo 38.2% of 1.2400/1.1822 downleg).
North-heading momentum and daily RSI / slow stochastic emerging from oversold zone, support the notion.
Res: 1.1936; 1.1965; 1.2017; 1.2043
Sup: 1.1871; 1.1843; 1.1822; 1.1790