Sample Category Title
USD/CAD – Unchanged as US Consumer Inflation Matches Expectations
USD/CAD has ticked higher in the Tuesday session. In North American trade, USD/CAD is trading at 1.2850, up 0.05% on the day. On the release front, there are no Canadian indicators for a second straight day. Bank of Canada Stephen Poloz will speak at an event in Kingston, Ontario. In the US, CPI and Core CPI both slowed to 0.2%.
The Canadian dollar had a winning week, boosted by strong job numbers on Friday. The Canadian economy added 15.4 thousand jobs in February, after a sharp decline of 88 thousand a month earlier. This was below the estimate of 21.3 thousand, but investors were pleased with the strong turnaround. South of the border, employment numbers were a mix on Friday. Wage growth dropped to 0.1% in February, down from 0.3% a month earlier. This missed the estimate of 0.2%, and marked the lowest gain in four months. The news was much better from nonfarm payrolls, which soared to 313 thousand, crushing the estimate of 205 thousand.
The markets are keeping a close eye on the Federal Reserve, which holds its next policy meeting next week. The Fed is widely expected to raise rates for the first time this year, but the real question is how many hikes we’ll see in 2018. The Fed projection remains at three rate hikes, but strong economic data, especially from inflation indicators, could push the Fed to raise its forecast. Higher US interest rates makes the greenback more attractive to investors. With the Canadian economy showing more slack than its neighbor, and the uncertainties swirling around the future of NAFTA, it’s unlikely that the Bank of Canada will be able to match the Fed pace of rate hikes, meaning that strong headwinds could lay ahead for the Canadian currency.
Slowly But Surely, Inflation Pressures Firming
The headline consumer price index (CPI) rose 0.2% as expected in February. Inflation on a year-on-year basis moved up one tick to 2.2%.
After boosting headline inflation in January, energy prices took a breather, up only 0.1% on the month. Energy prices are up 7.7% versus a year ago, driven by double digit increases in the price of gasoline and fuel oil.
Core inflation was also up 0.2%, as expected, which left the year-on-year pace of core inflation unchanged at 1.8%. Shelter prices (0.2% m/m), apparel (+1.5%) and motor vehicle insurance (+1.7%) all contributed notably to the monthly increase in inflation. Prices for household furnishings and operations (+0.3%), education (+0.2%) and personal care also rose on the month. Declines for medical care (-0.1%), communication (-0.6%), new vehicles (-0.5%) leaned against the monthly gains.
Notably, core goods prices rose for the third consecutive month in February (0.1%). That hasn't happened in three years. Core goods prices are still down 0.5% versus a year ago, but that degree of deflation compares to a 1% decline last fall. Core services inflation has remained fairly steady at 2.6% year-on-year, roughly where it has been for about seven months.
Key Implications
There were few surprises in February's inflation report. Headline inflation rose modestly and core inflation remained steady, as it has for about the past five months. That is set to change in March. As the month-on-month decline in prices a year ago – driven in large part by new cell phone contracts that drove down communication prices – falls out of the data, even a modest increase in core prices in March will see year-on-year core inflation rise above 2%.
That does not include the inflationary impact of steel and aluminum tariffs that are set to come into force in the coming days. TD Economics estimates that these tariffs could lift CPI inflation by about 0.1 percentage point (see report). Beyond tariffs, the depreciation of the U.S. dollar also looks to be starting to show up in higher prices for core goods. This trend should also contribute to higher core inflation in the coming months, alongside increased government spending which is also expected to raise inflationary pressures.
The question for the FOMC is not if inflation is rising, but how much all of these forces – tax cuts, spending increases and now tariffs – will lift inflation, and how quickly the Fed should raise rates in response. For now, we are comfortable with our view for three hikes this year. But, there is certainly an upside risk to this view, with so many upward forces at play.
Further Firming in U.S. CPI Growth in February
Highlights:
- All items CPI rose 0.2% on a month-over-month basis in February after a 0.5% increase in January. The year-over-year rate ticked up to 2.2% from 2.1%
- Excluding food & energy products, core CPI also increased 0.2% on a month-over-month basis.
- Year-over-year core CPI growth held at 1.8% for a third straight month.
Our Take:
Consumer price growth showed further signs of firming in February. The headline rate continues to be boosted on a year-over-year basis by higher energy prices, which rose 7.7% from a year ago in February. Ex-food & energy prices have also shown signs of firming though. The year-over-year rate of core growth held steady at 1.8% for a third straight month but that rate is still being biased lower by a large drop in telecommunication prices last March. Even a ’trend-like’ month-over-month price increase next month would send the annual core rate up to 2% or above as that big monthly drop a year ago falls out of the year-over-year calculation. Indeed, month-over-month increases have been running closer to 2 1/2% (at an annualized rate) over the last half year on average.
To be sure, there is little evidence that inflation is anywhere close to getting out of control on the upside. More evidence of underlying firming, though, should only further reassure Fed policymakers that the U.S. economy is indeed operating close to if not somewhat beyond long-run capacity constraints even as it continues to grow at a somewhat above-trend pace. That is fully consistent with the view that — barring some unexpected shock — interest rates will continue to grind gradually higher towards long-run ‘neutral’ rates.
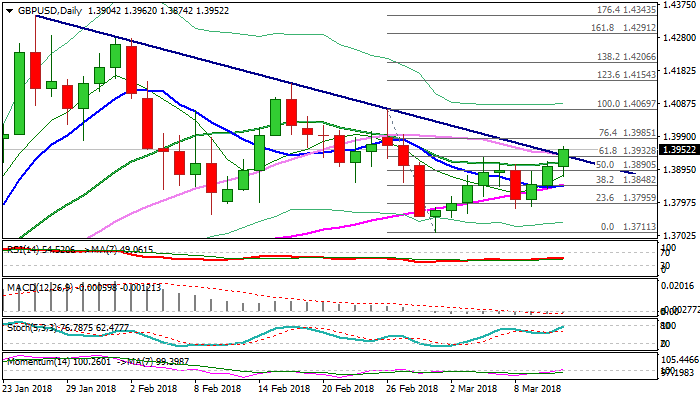
GBPUSD Rallies above Trendline Resistance on Weak US CPI; Brighter Outlook for the UK Economy
Cable surged through trendline resistance (1.3930) after data showed US inflation slowed in February.
CPI rose 0.2% previous month, matching the forecast but falling well below previous month’s 0.5% rise, signaling that expected pickup in inflation will be likely gradual.
Inflation report came after Jobs data last Friday which cooled expectations for stronger pace of US rate hikes in 2018, with weak CPI numbers expected to add further negative sentiment. Sterling was also supported by positive remarks from UK FinMin Hammond in his half-yearly update on the economy and public finances, showing brighter outlook for the UK economy. Lift above trendline resistance (which also marks Fibo 61.8% of 1.4069/1.3711 bear-leg) is strong bullish signal for acceleration towards initial barrier at 1.40 (daily cloud top) with possible extension towards 1.4069 (26 Feb lower top).
Close above bear-trendline is needed to confirm scenario.
Res: 1.3985; 1.4000; 1.4069; 1.4100
Sup: 1.3930; 1.3914; 1.3874; 1.3850
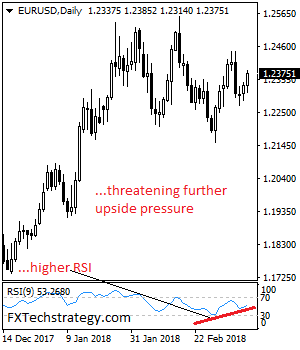
EURUSD: Looks To Recover Further Higher
EURUSD - With the pair retaining its corrective recovery threats, more strength is likely in the days ahead. On the upside, resistance comes in at 1.2400 level with a cut through here opening the door for more upside towards the 1.2450 level. Further up, resistance lies at the 1.2500 level where a break will expose the 1.2550 level. Conversely, support lies at the 1.2350 level where a violation will aim at the 1.2300 level. A break of here will aim at the 1.2250 level. Below here will open the door for more weakness towards the 1.2200. All in all, EURUSD faces further recovery threats.
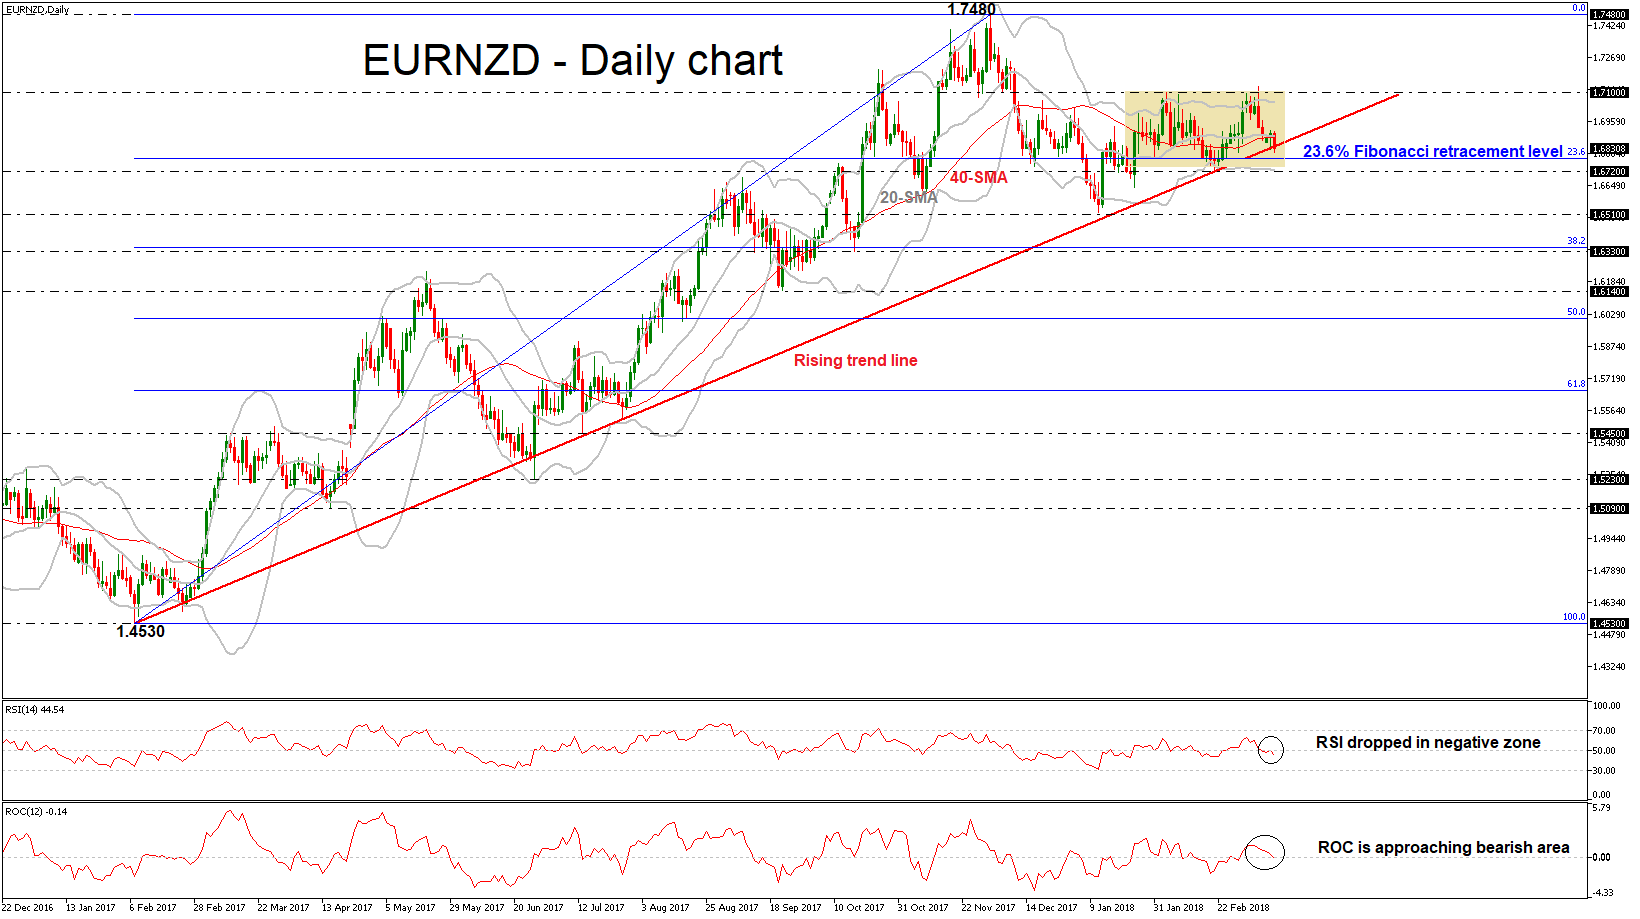
EURNZD Hits Rising Trend Line; Sign of Bearish Correction
EURNZD is touching the ascending trend line, which has been standing since February 2017. In the short-term timeframe, the price has been developing within a narrow range over the last two months with upper boundary the 1.7100 psychological level and lower boundary the 1.6720 support, which overlaps with the lower Bollinger band.
Technically, in the daily timeframe, the RSI indicator slipped below the 50 level following the pullback on the positive territory. Additionally, the ROC oscillator approached the zero line, crossing it to the downside, suggesting further losses.
If price action drops below the uptrend line, there is scope to test the 23.6% Fibonacci retracement level at 1.6780 of the last big upward movement from February 2017 low to December 2017 high. Slightly below the aforementioned support, the 1.6720 level is the next immediate barrier. A breach of this level would shift the short-term outlook from positive to negative and drive the pair towards 1.6510.
In the event of an upside reversal, the upper Bollinger band near 1.7100 would act as a strong resistance level for the bulls. In case of a climb above it, could hit the 1.7480 high taken from the peak on December 1.
U.S CPI As Expected, Four U.S Rate Hikes Questioned
U.S consumer prices rose moderately last month, at a slightly slower pace than in January.
The consumer-price index rose +0.2% in February after rising a seasonally adjusted +0.5% in January.
Ex-food and energy, the core prices rose +0.2%, compared to +0.3% in January.
Market expectations were looking for a headline print of +0.2%, and a +0.2% core print.
In the year to February, overall prices rose +2.2%, the largest annual increase since November, while core prices were up +1.8% on the year. The market was expecting a +2.3% increase in overall inflation and core prices to rise +1.9%.
Wages
Real average hourly earnings were flat last month and real average weekly earnings rose a seasonally adjusted +0.3% on the month.
Digging deeper, today’s report showed an index of energy prices rose +0.1% on the month, as gas and fuel oil costs both fell. The price index for new auto’s declined for the second consecutive month, falling -0.5%. Cloth prices rose +1.5% on the month and transportation services increased +1%.
Despite the slightly tamer inflations numbers, fed fund futures are pricing in a +88.8% chance of a +25 bps hike at next weeks FOMC meeting (March 20-21).
Note: Fed policy makers have penciled in three rate increases this year, and have been monitoring the inflation picture closely.
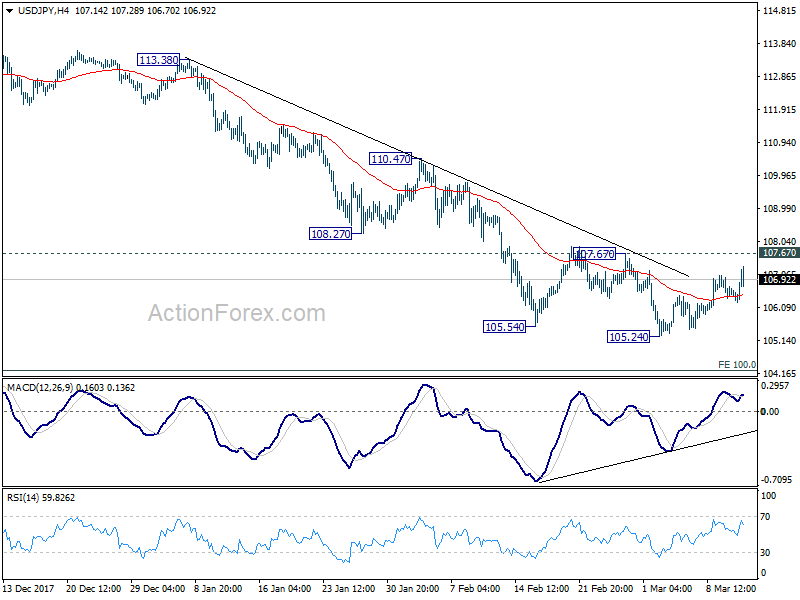
USD/JPY Mid-Day Outlook
Daily Pivots: (S1) 106.15; (P) 106.56; (R1) 106.82; More...
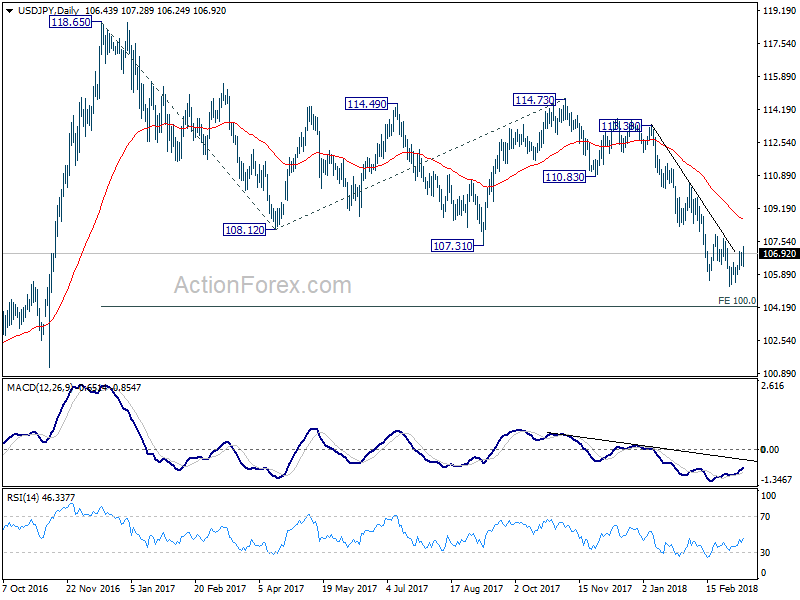
USD/JPY rebounds further today but stays below 107.67 resistance. Intraday bias remains neutral at this point. On the upside, firm break of 107.67 resistance will indicate near term reversal, on bullish convergence condition in 4 hour MACD. In such case, outlook will be turned bullish for 110.47 resistance next. But before that, another decline is still mildly in favor. Break of 105.24 will resume larger decline from 118.65 and target 100% projection of 118.65 to 108.12 from 114.73 at 104.20 next.
In the bigger picture, current development argues that the corrective pattern from 118.65 is extending. The solid break of 61.8% retracement of 98.97 to 118.65 at 106.48 now suggests that the pattern from 125.85 high is possibly extending. Deeper fall could be seen through 98.97 key support (2016 low). This bearish case will now be favored as long as 110.47 resistance holds.
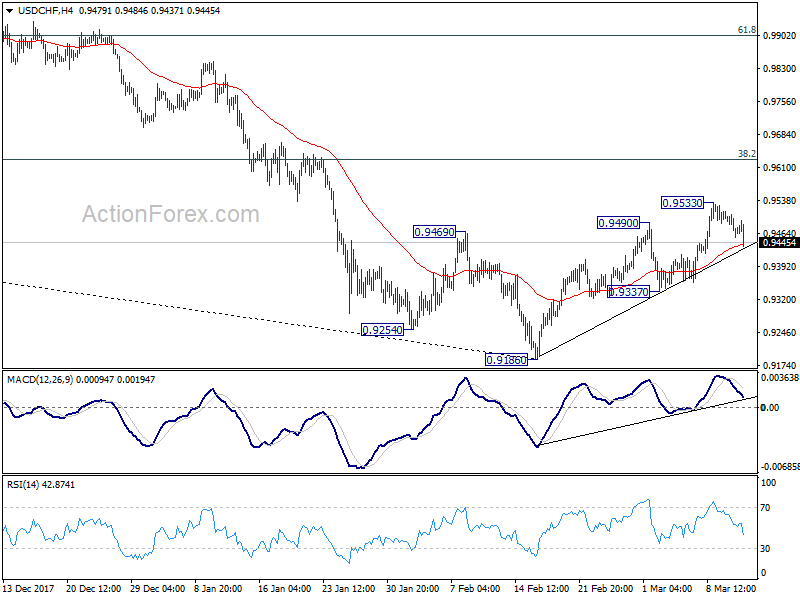
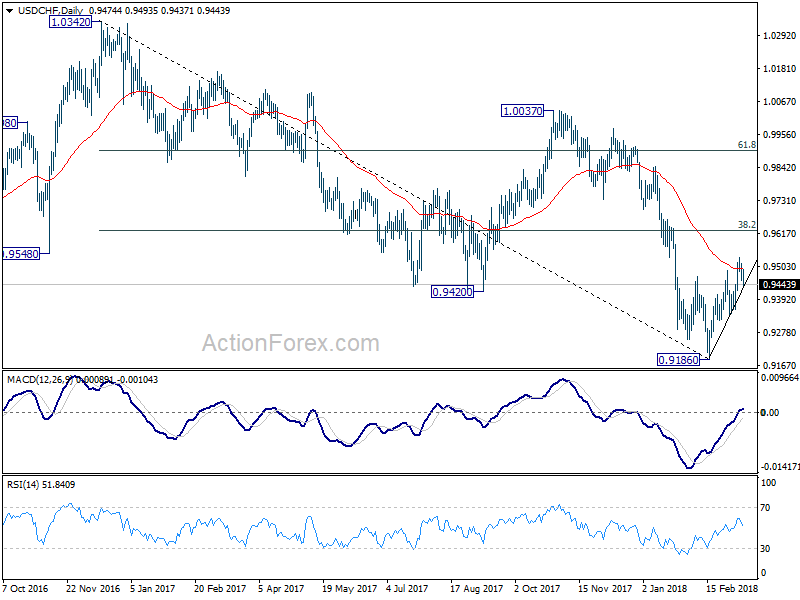
USD/CHF Mid-Day Outlook
Daily Pivots: (S1) 0.9452; (P) 0.9482; (R1) 0.9505; More...
USD/CHF drops sharply in early US session, but stays above 0.9337 minor support. Intraday bias remains neutral first. Another rise is expected as long as 0.9337 support holds. Above 0.9533 will target 0.9626 fibonacci level. However, break of 0.9337 will indicate that the rebound has completed. In such case, intraday bias will be turned back to the downside for retesting 0.9186 low.
In the bigger picture, fall from 1.0342 is seen as a medium term down trend. Current development is raising the chance that it is completed. But there is no confirmation yet. Focus will now be back on 38.2% retracement of 1.0342 (2016 high) to 0.9186 (2018 low) at 0.9626. Sustained break there will add much credence to the case of trend reversal and target 61.8% retracement at 0.9900 and above). However, rejection from 0.9626 will maintain medium term bearishness for another low below 0.9186.
EUR/USD Mid-Day Outlook
Daily Pivots: (S1) 1.2302; (P) 1.2323 (R1) 1.2357; More....
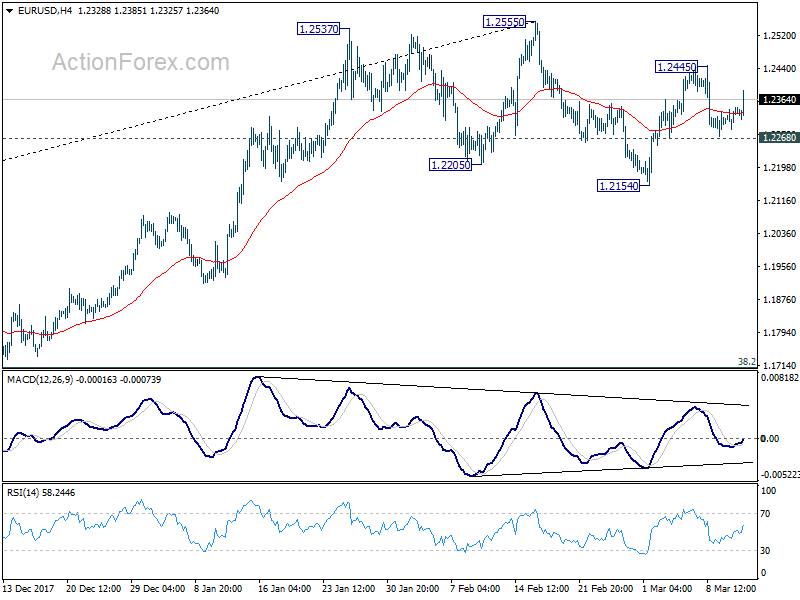
EUR/USD rebounds above 1.2268 minor support today. While intraday bias remains neutral, focus is back on 1.2445. Break there will turn bias back to the upside for 1.2555 high. Decisive break there will carry larger bullish implication. But again, break of 1.2268 will argue that fall from 1.2555 is likely resuming. And intraday bias will be turned back to the downside for 1.2154 support and below.
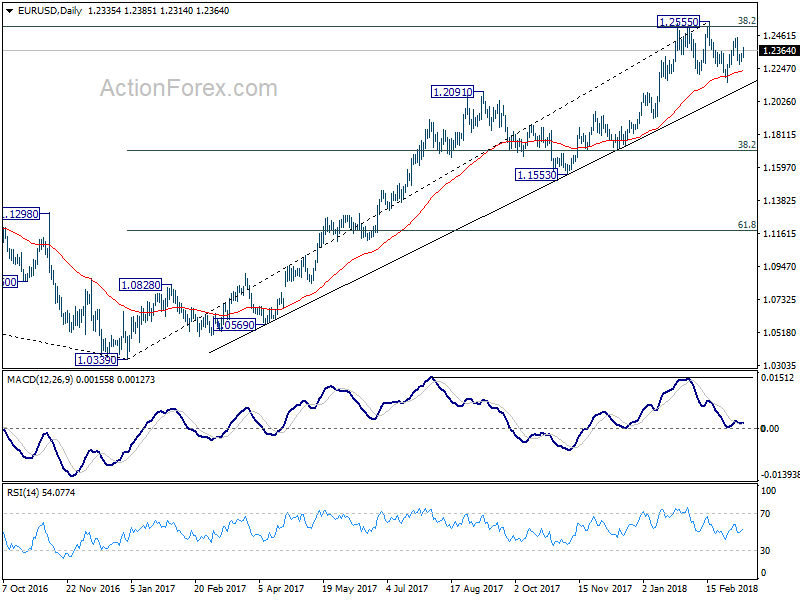
In the bigger picture, key fibonacci level at 38.2% retracement of 1.6039 (2008 high) to 1.0339 (2017 low) at 1.2516 remains intact despite attempts to break. Hence, rise from 1.0339 medium term bottom is still seen as a corrective move for the moment. Rejection from 1.2516 will maintain long term bearish outlook and keep the case for retesting 1.0039 alive. Firm break of 1.1553 support will add more medium term bearishness. However, sustained break of 1.2516 will carry larger bullish implication and target 61.8% retracement of 1.6039 to 1.0339 at 1.3862.