Sample Category Title
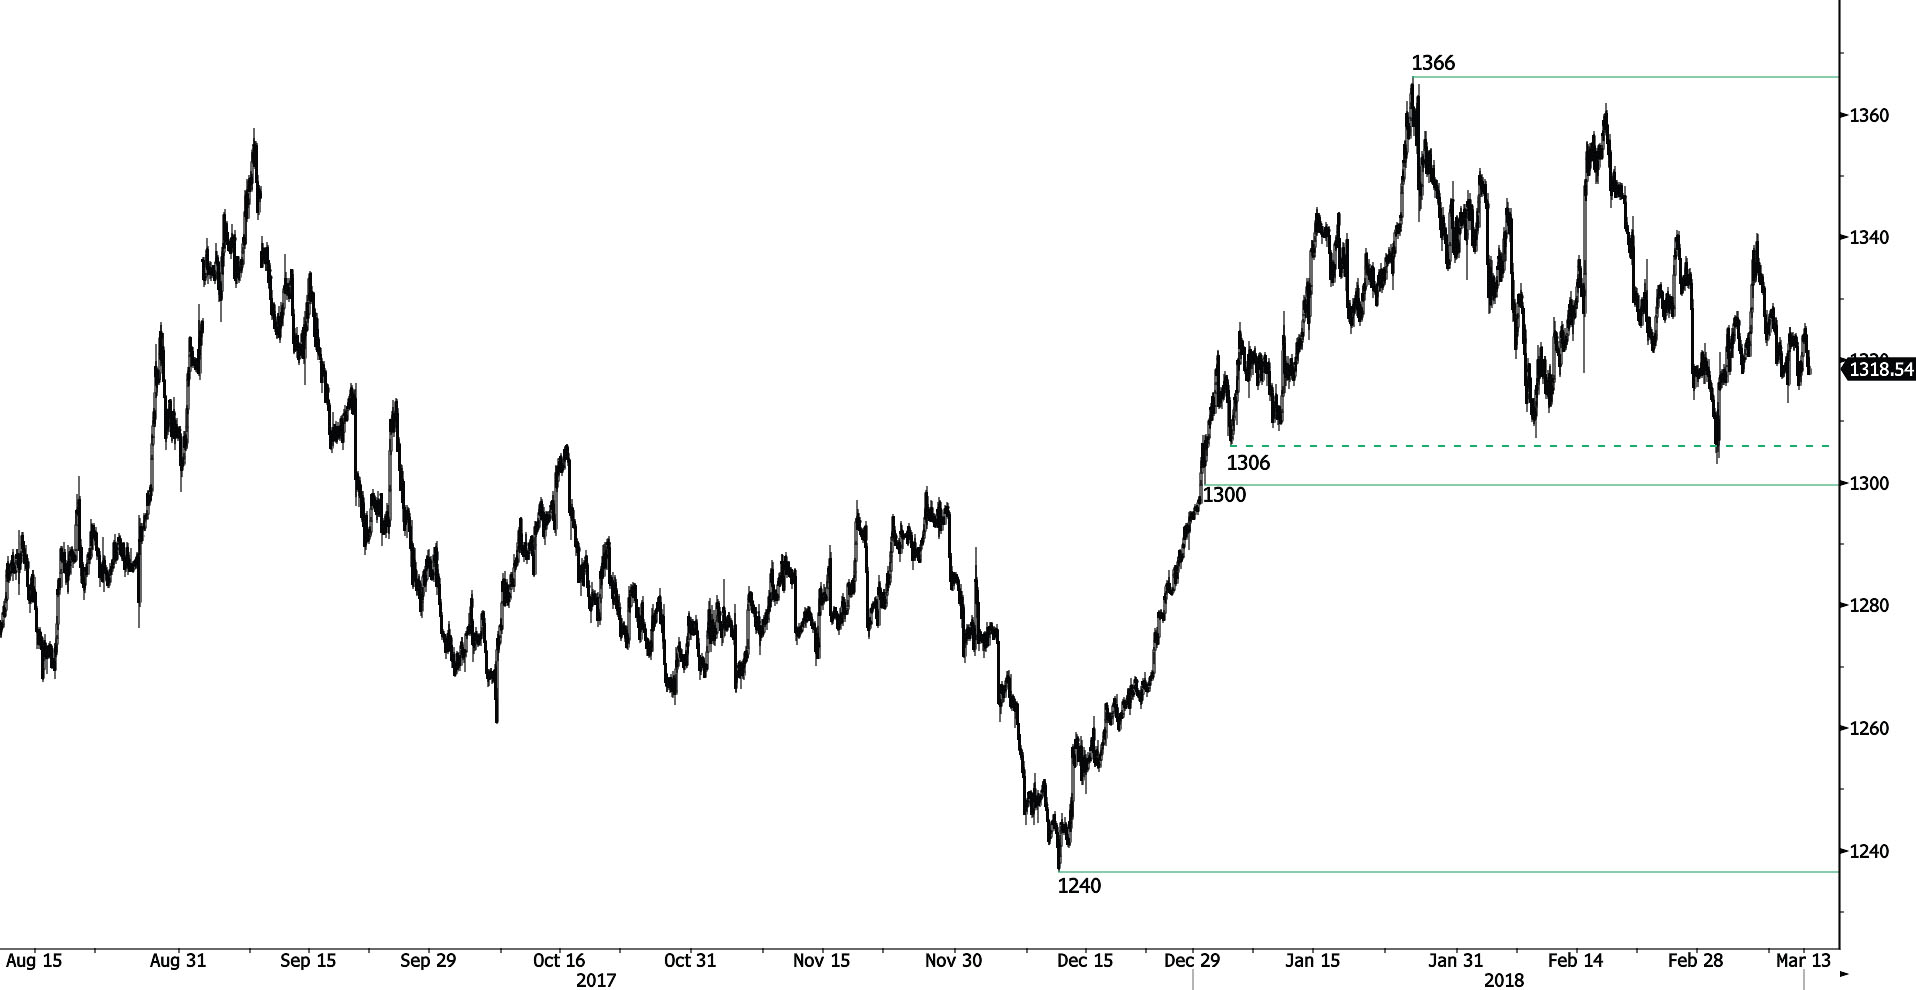
GOLD Moving Sideways
Gold is currently direction less. The pair is ready for another leg lower, approaching the 1325 range. The pair is contained between hourly support and resistance at 1300 (29/12/2017 low) and 1348 (20/02/2018 high). Expected to show further increase.
In the long-term, the technical structure suggests that there is a growing upside momentum. A break of 1'392 (17/03/2014) is required to confirm it. A major support can be found at 1'045 (05/02/2010 low).
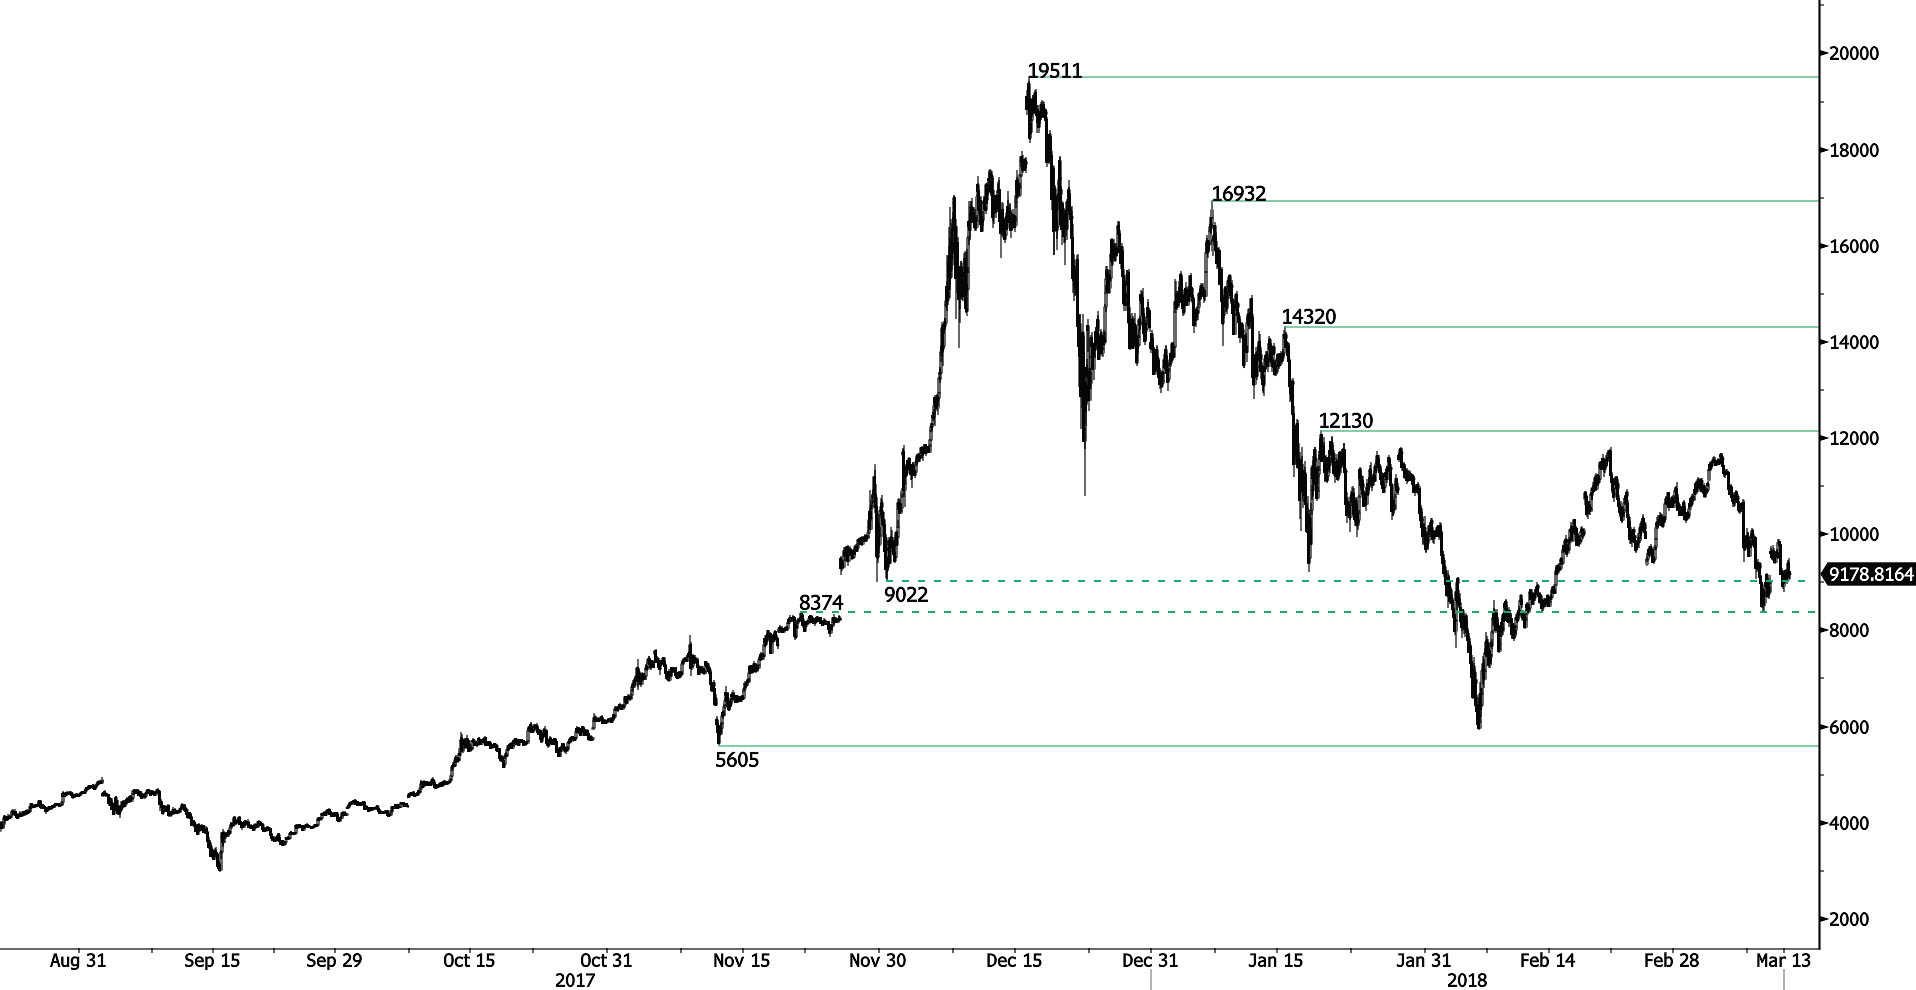
BITCOIN Slight Recovery
Bitcoin bounces back following its decline at 8368 and approaches the 10000 range. Expected to show short-term strength. Bitcoin is contained between hourly support and resistance at 7614 (02/02/2018 low) and 12130 (18/01/2018).
In the long-term, the digital currency has had an exponential growth but also presented important downturns. There is decent likelihood that the currency could stabilize between 7'000 - 12'000 in 2018. Bitcoin is approaching its 200 DMA (7000 range).
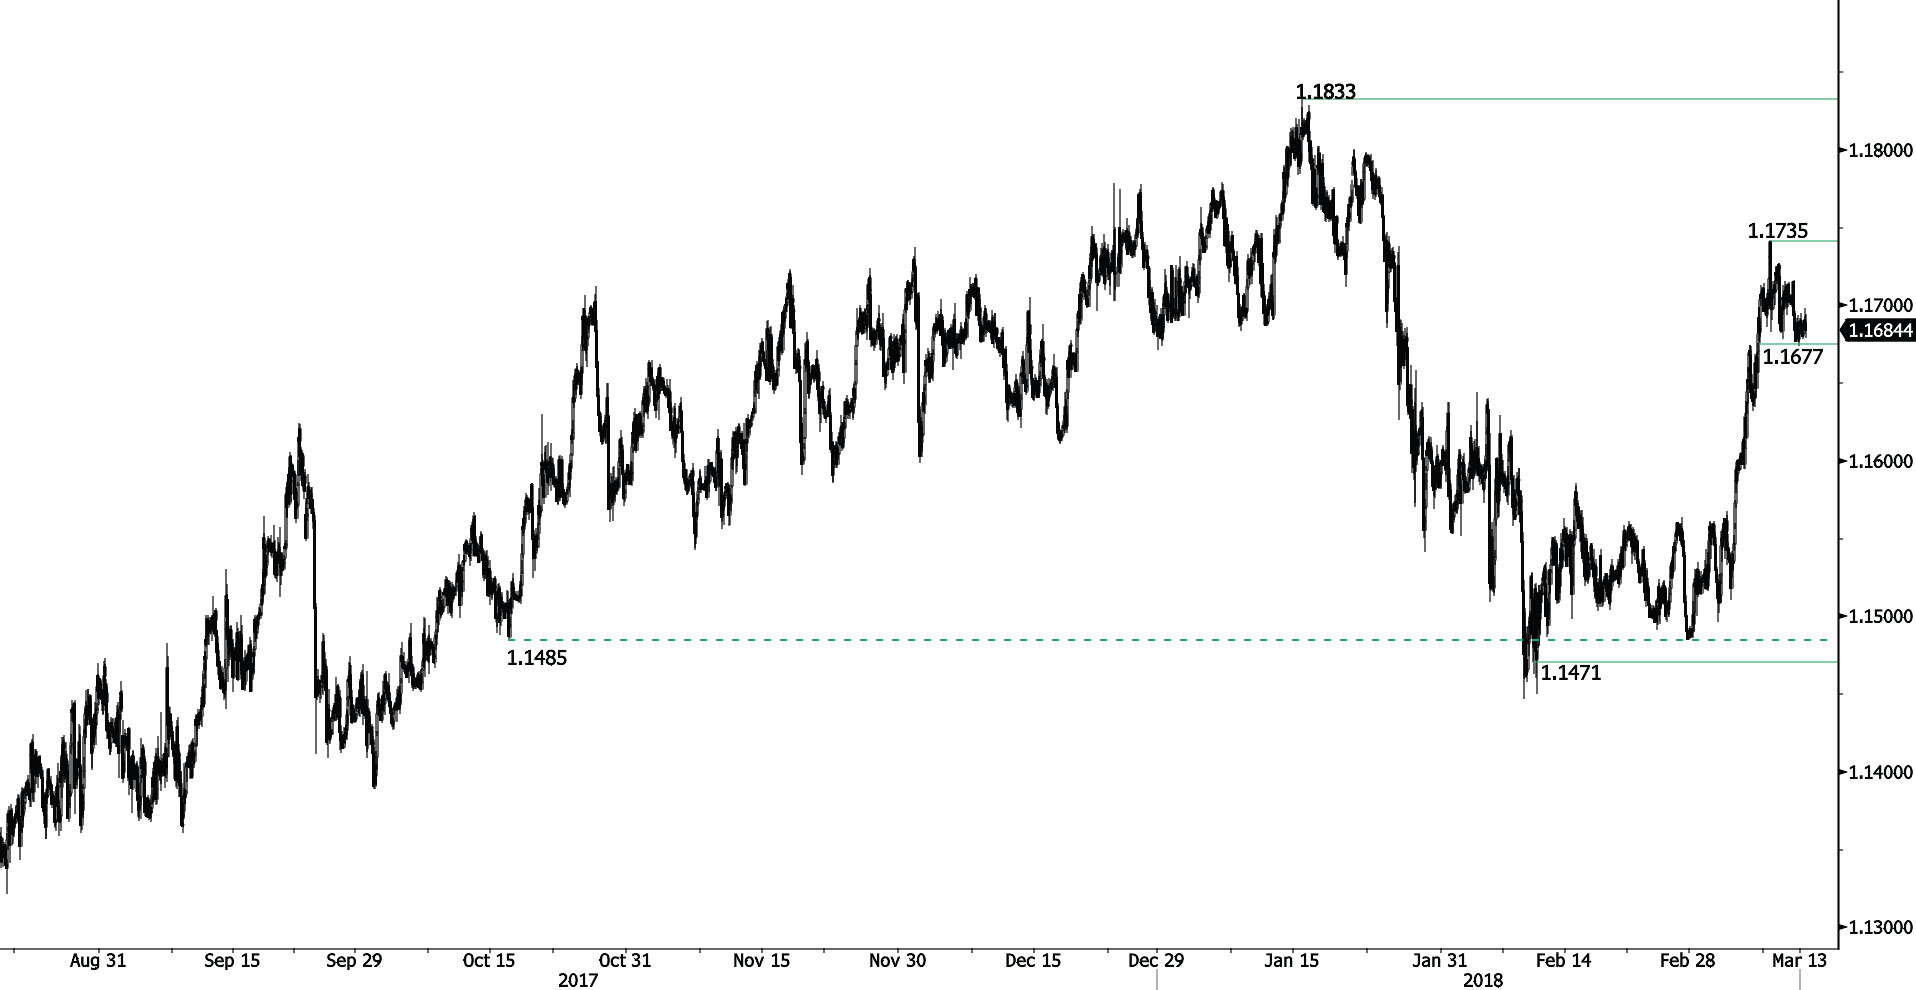
EUR/CHF Weak Bounce
EUR/CHF has now entered in a bearish momentum bouncing off 1.1677 support. Hourly support remains at 1.1659 (06/12/2017 low). The technical structure suggests further short-term increase.
In the longer term, the technical structure has reversed. Strong resistance is given at 1.20 (level before the unpeg). Yet, the ECB's slowing QE program is likely to cause buying pressures on the euro, which should weigh in favour of the EUR/CHF. Support can be found at 1.0234 (20/04/2015 low).
EUR/GBP Bearish Consolidation
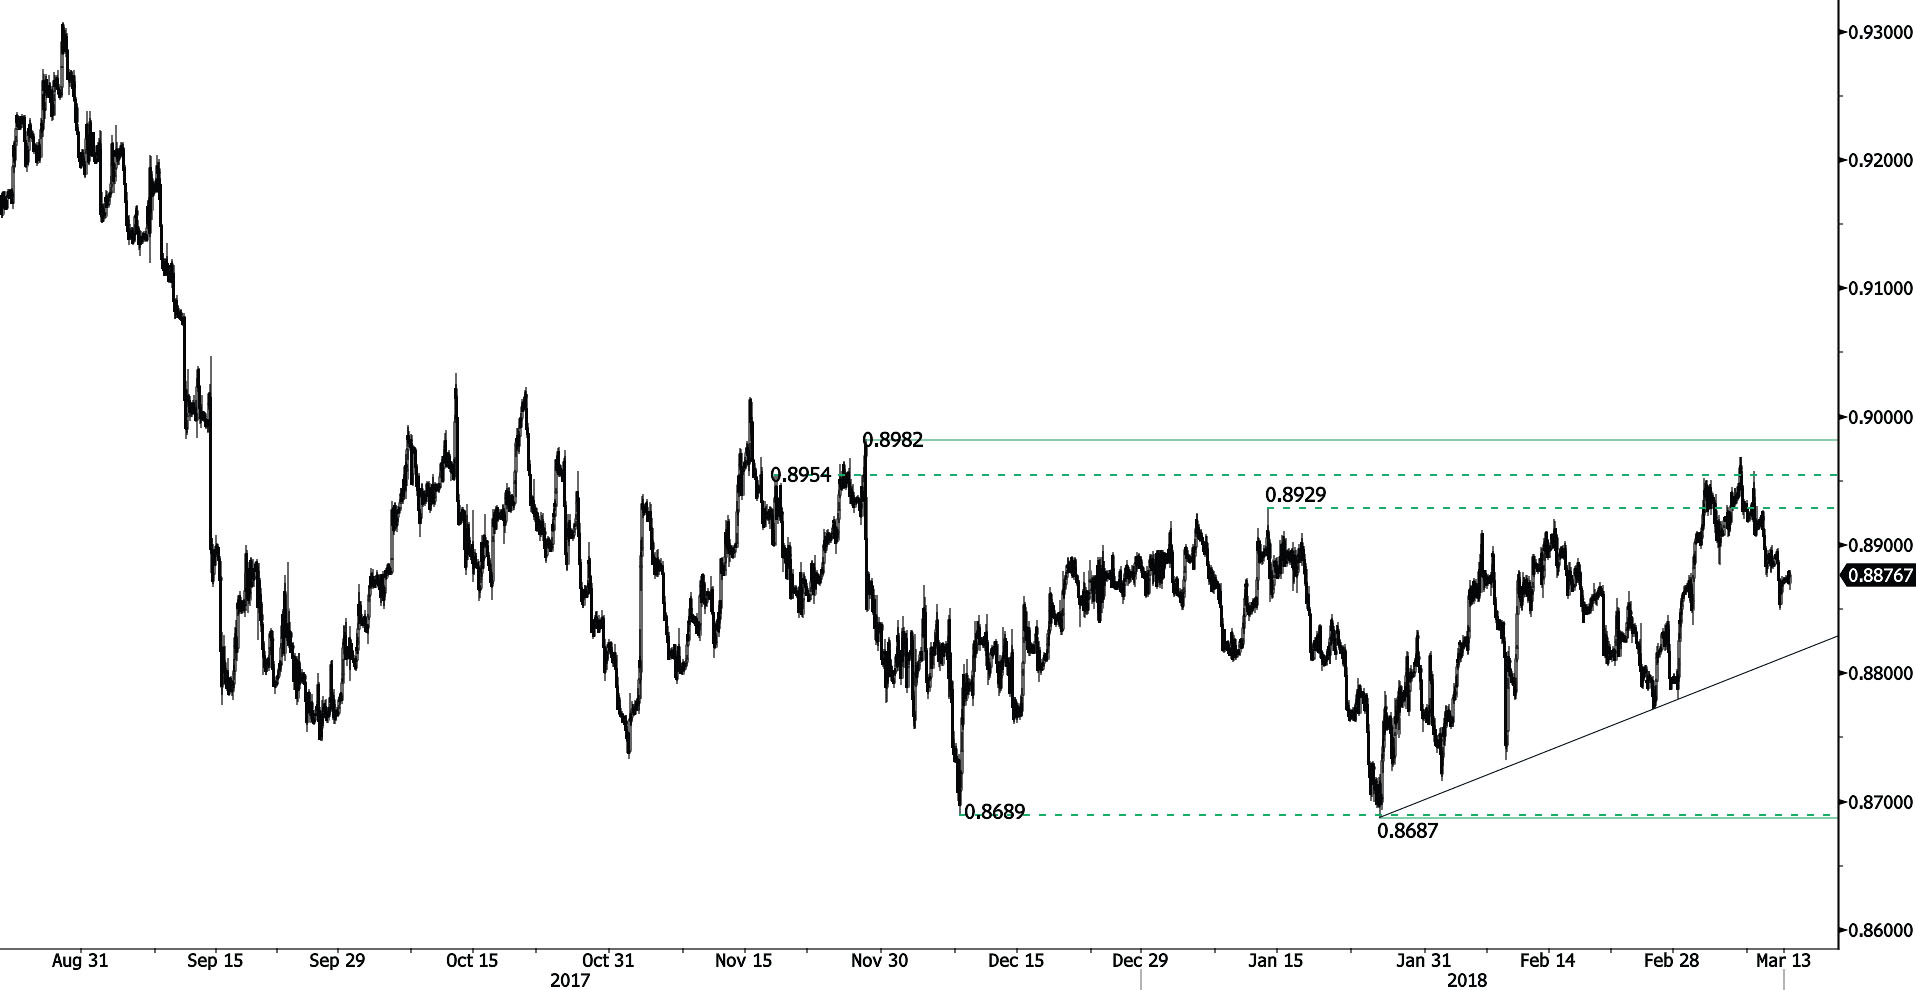
EUR/GBP bearish momentum continues. Hourly support and resistance are given at 0.8883 (13/11/2017 low) and 0.8982 (28/11/2017 high). The technical structure suggests shortterm sideway moves.
In the long-term, the pair has largely recovered from 2015 lows. The technical structure suggests further upside pressure. Strong resistance can be found at 0.9500 (psychological level) while support remains at 0.8304 (05/12/2016 low). The pair is trading above its 200 DMA.
AUD/USD Bearish Pause
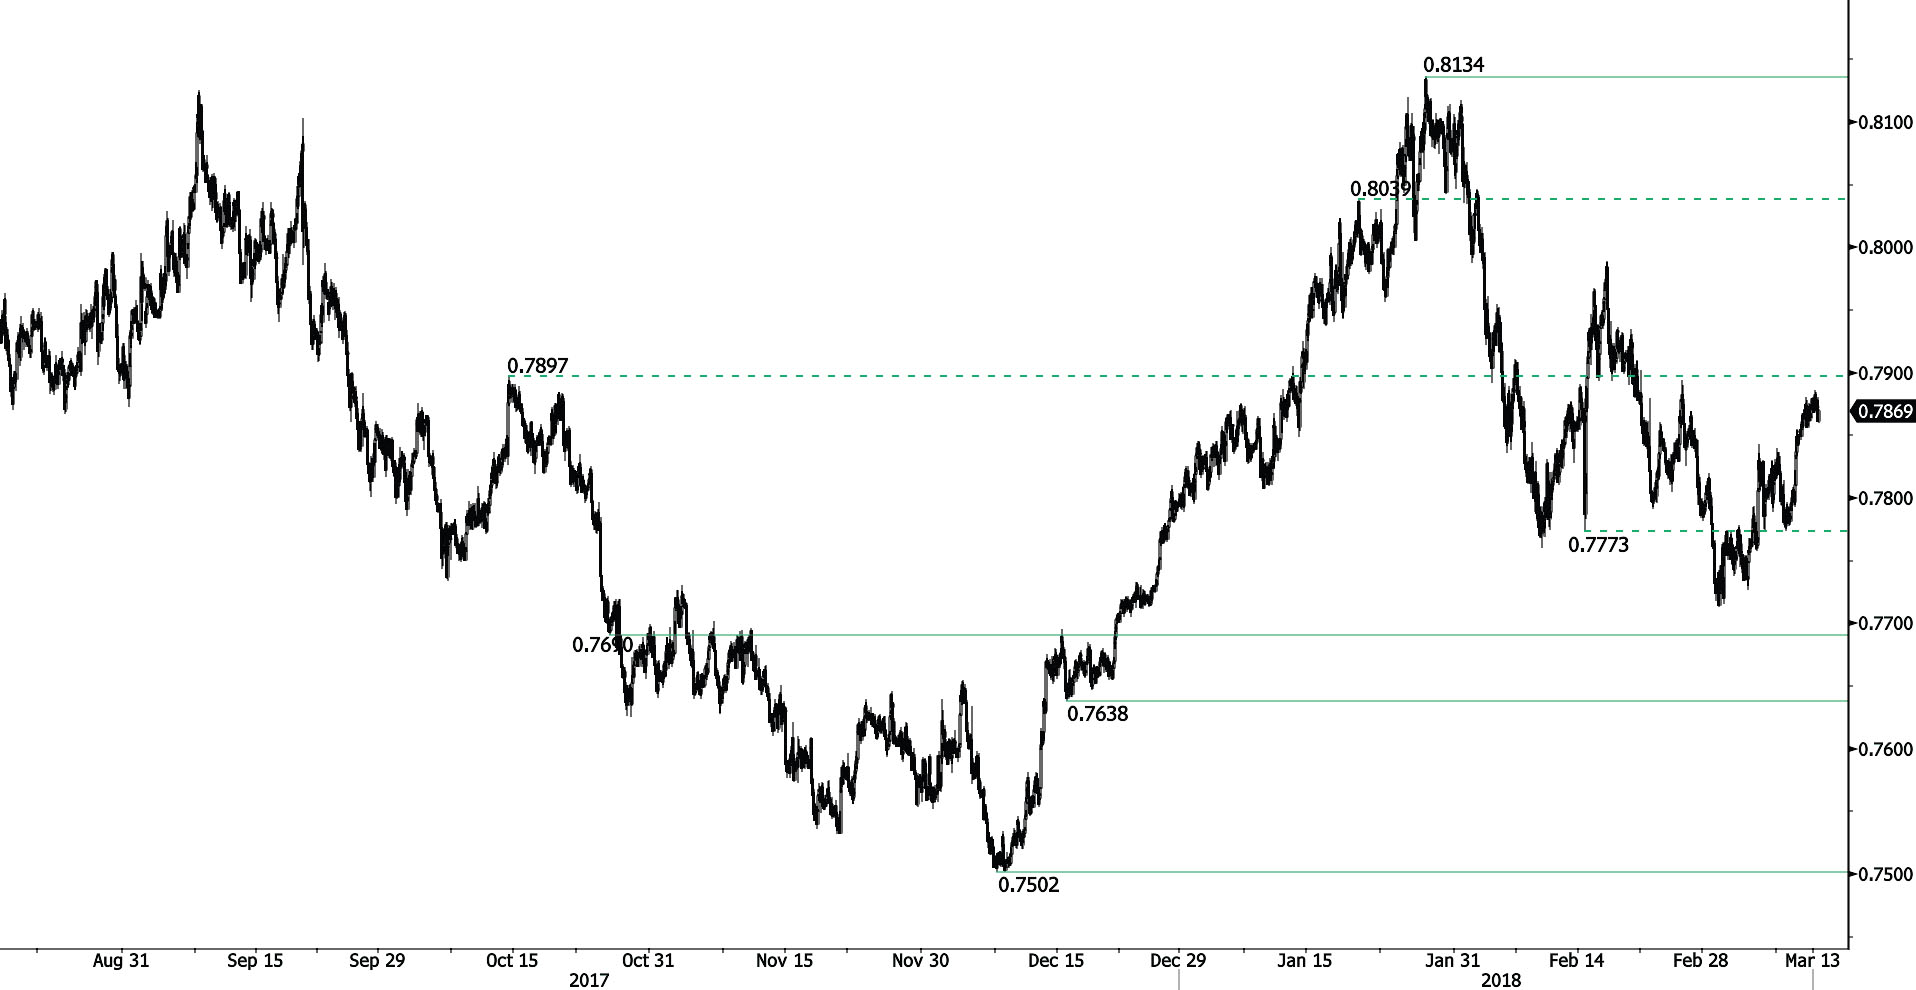
AUD/USD's momentum is fading. Hourly support is given at 0.7879 (21/02/2018 high). Further support and resistance are given at 0.7638 (15/12/2018 low) and 0.7999 (17/01/2018 high). The technical structure suggests shortterm upward moves.
In the long-term, the upward trend slows down after failing to reach key resistance at 0.8164 (14/05/2015 low). Key support stands at 0.6009 (31/10/2008 low). A break of the key resistance at 0.8164 (14/05/2015 high) is needed to invalidate our long-term bearish view.
USD/CAD Recovery Bounce
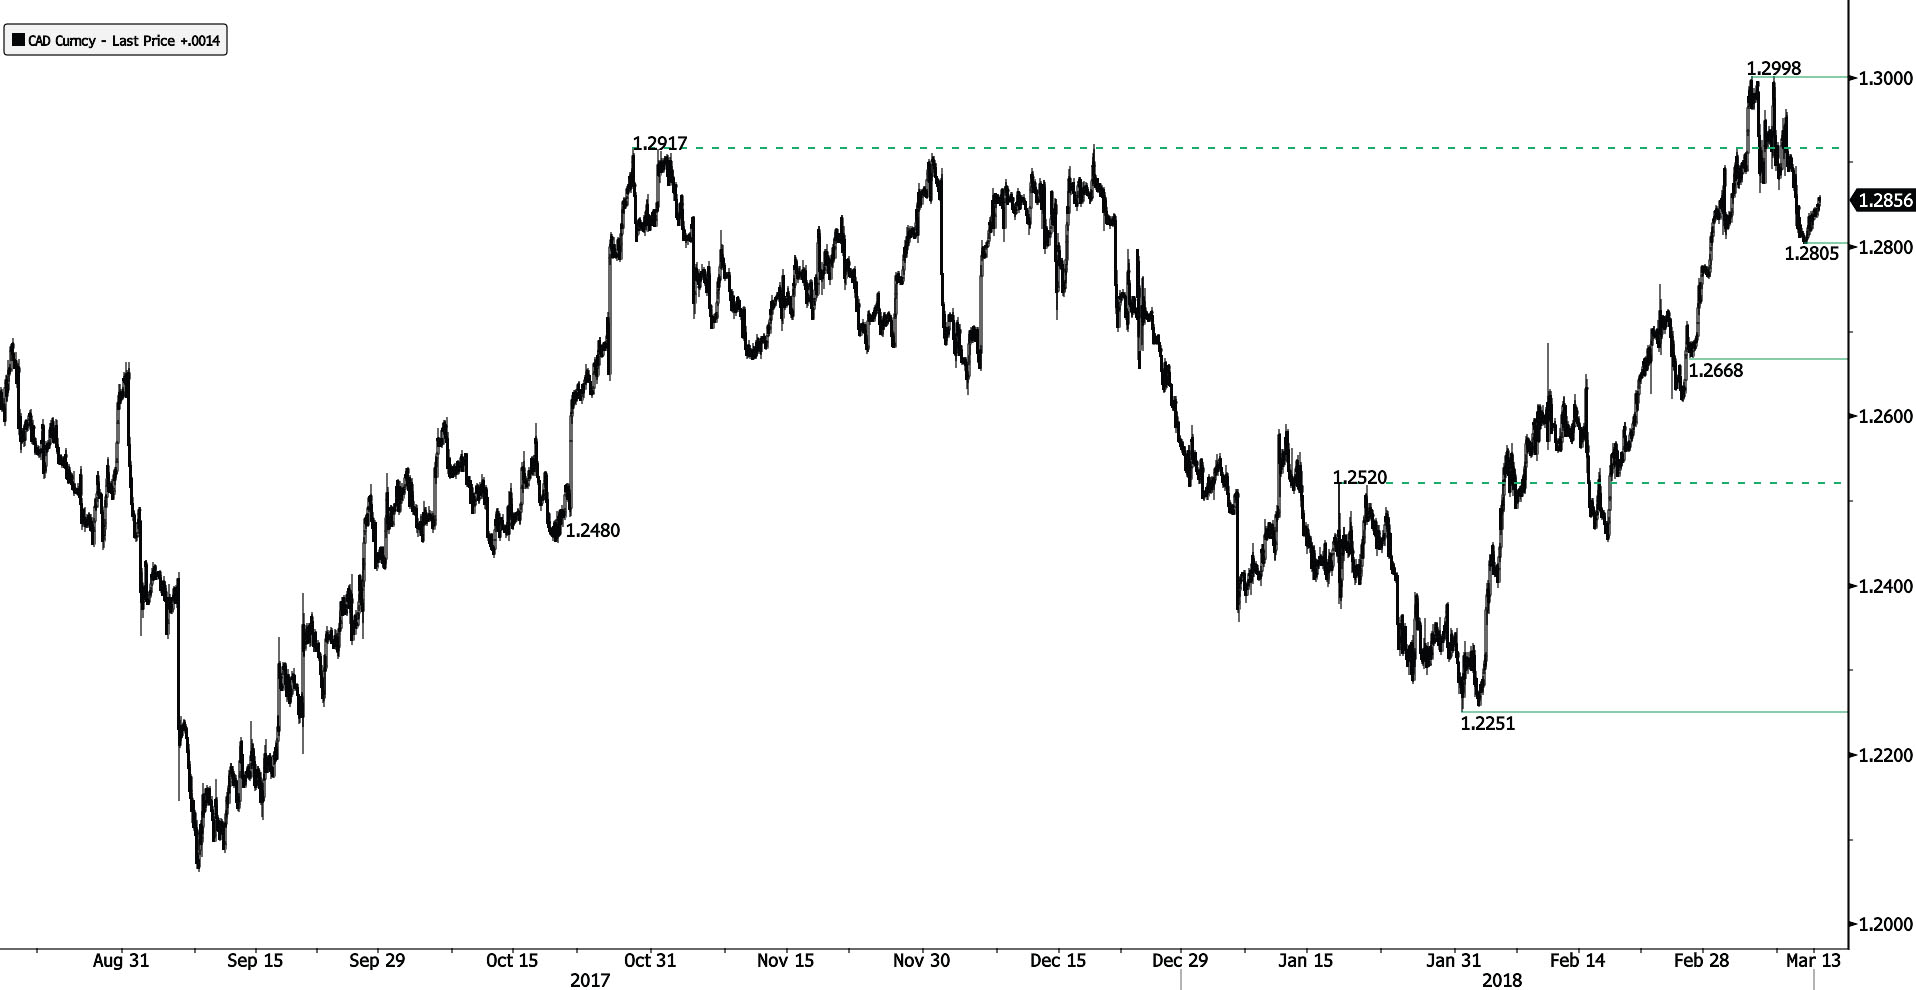
USD/CAD has bounced off 1.2805 low. The pair is contained between hourly support and resistance at 1.2668 (26/02/2018 low) and 1.3015 (05/07/2018 high). The short-term technical structure suggests further short-term sideway moves.
In the longer term, the pair is trading between resistance point at 1.3805 (05/05/2017 high) and support at 1.2128 (18/06/2015 low). Strong resistance is given at 1.4690 (22/01/2016 high). The pair is likely to head lower. The pairs is trading above its 200 DMA
USD/CHF Trying To Bounce
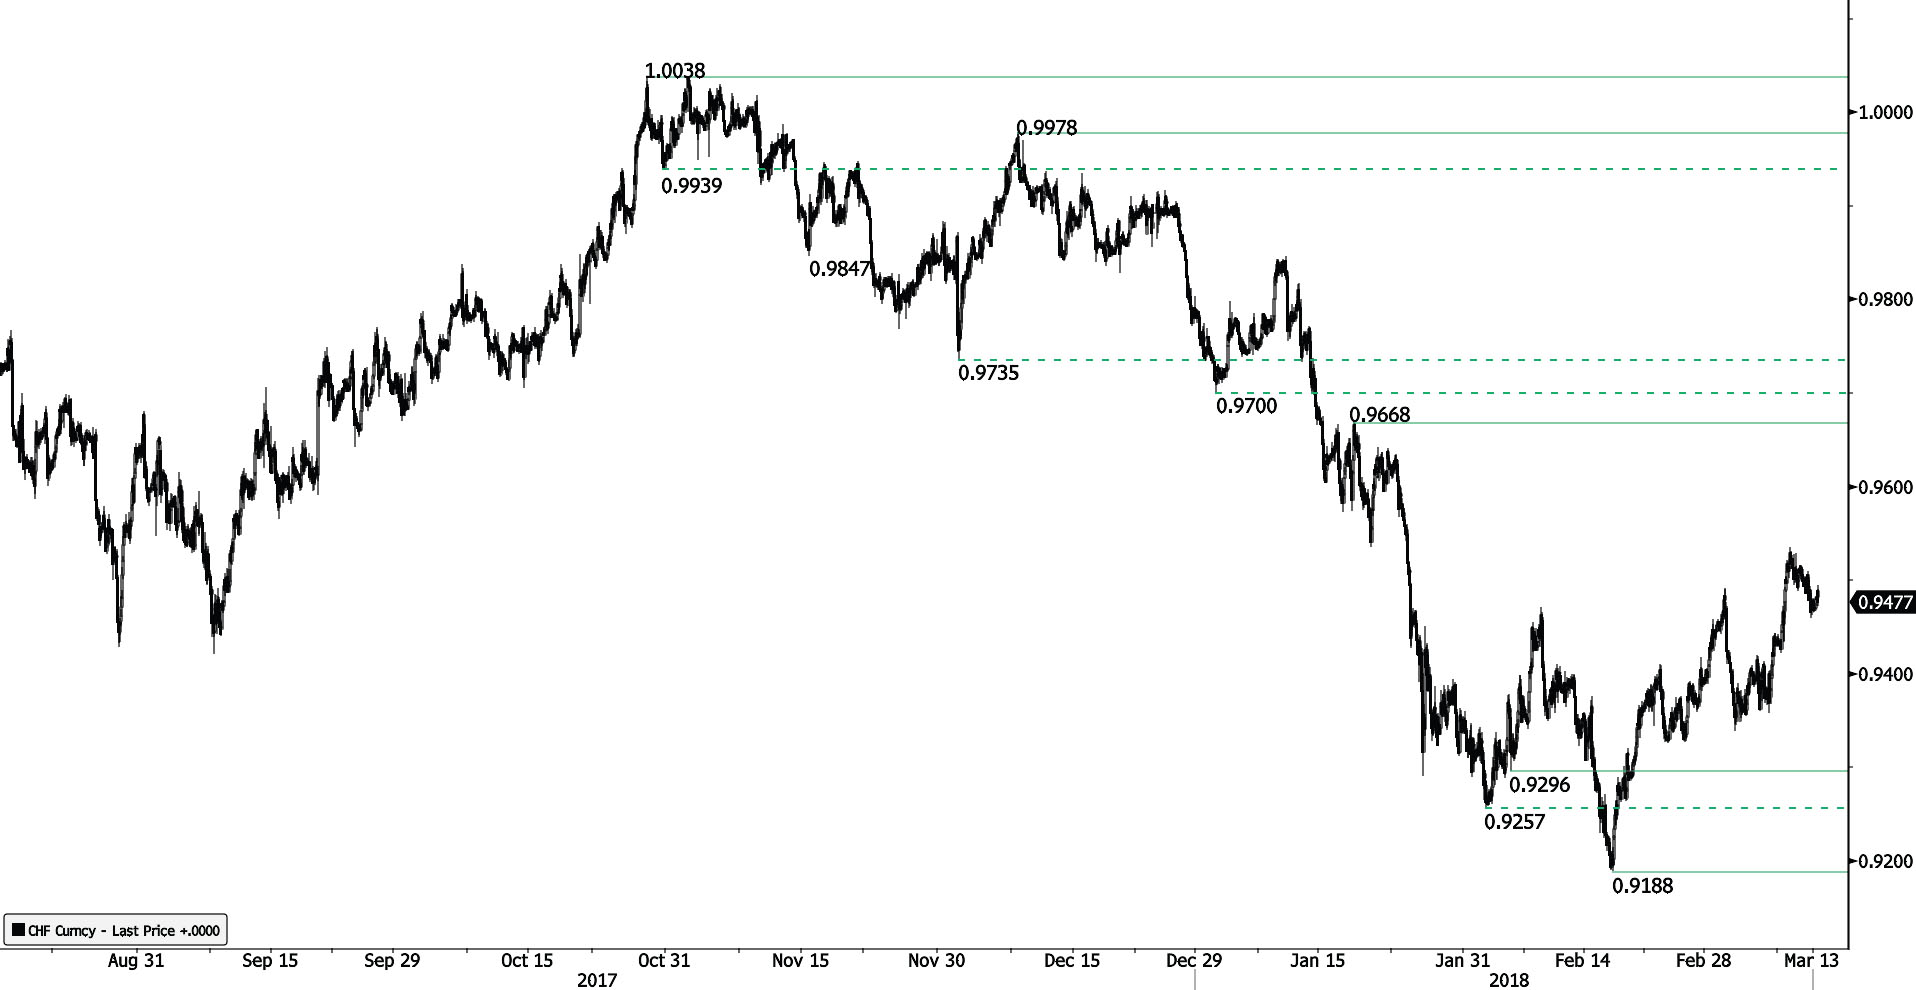
USD/CHF is showing further signs of bearish pressure. The pair currently trades between hourly support and resistance at 0.9296 (05/02/2018 low) and 0.9559 (24/01/2018 high). Expected to show short-term increase.
In the long-term, the pair is still trading in range since 2011 despite some turmoil when the SNB unpegged the CHF. Key support lies at 0.9072 (07/05/2015 low) while resistance at 1.0344 (15/12/2016 high) is distanced. The technical structure favours a long term bullish bias since the unpeg in January 2015.
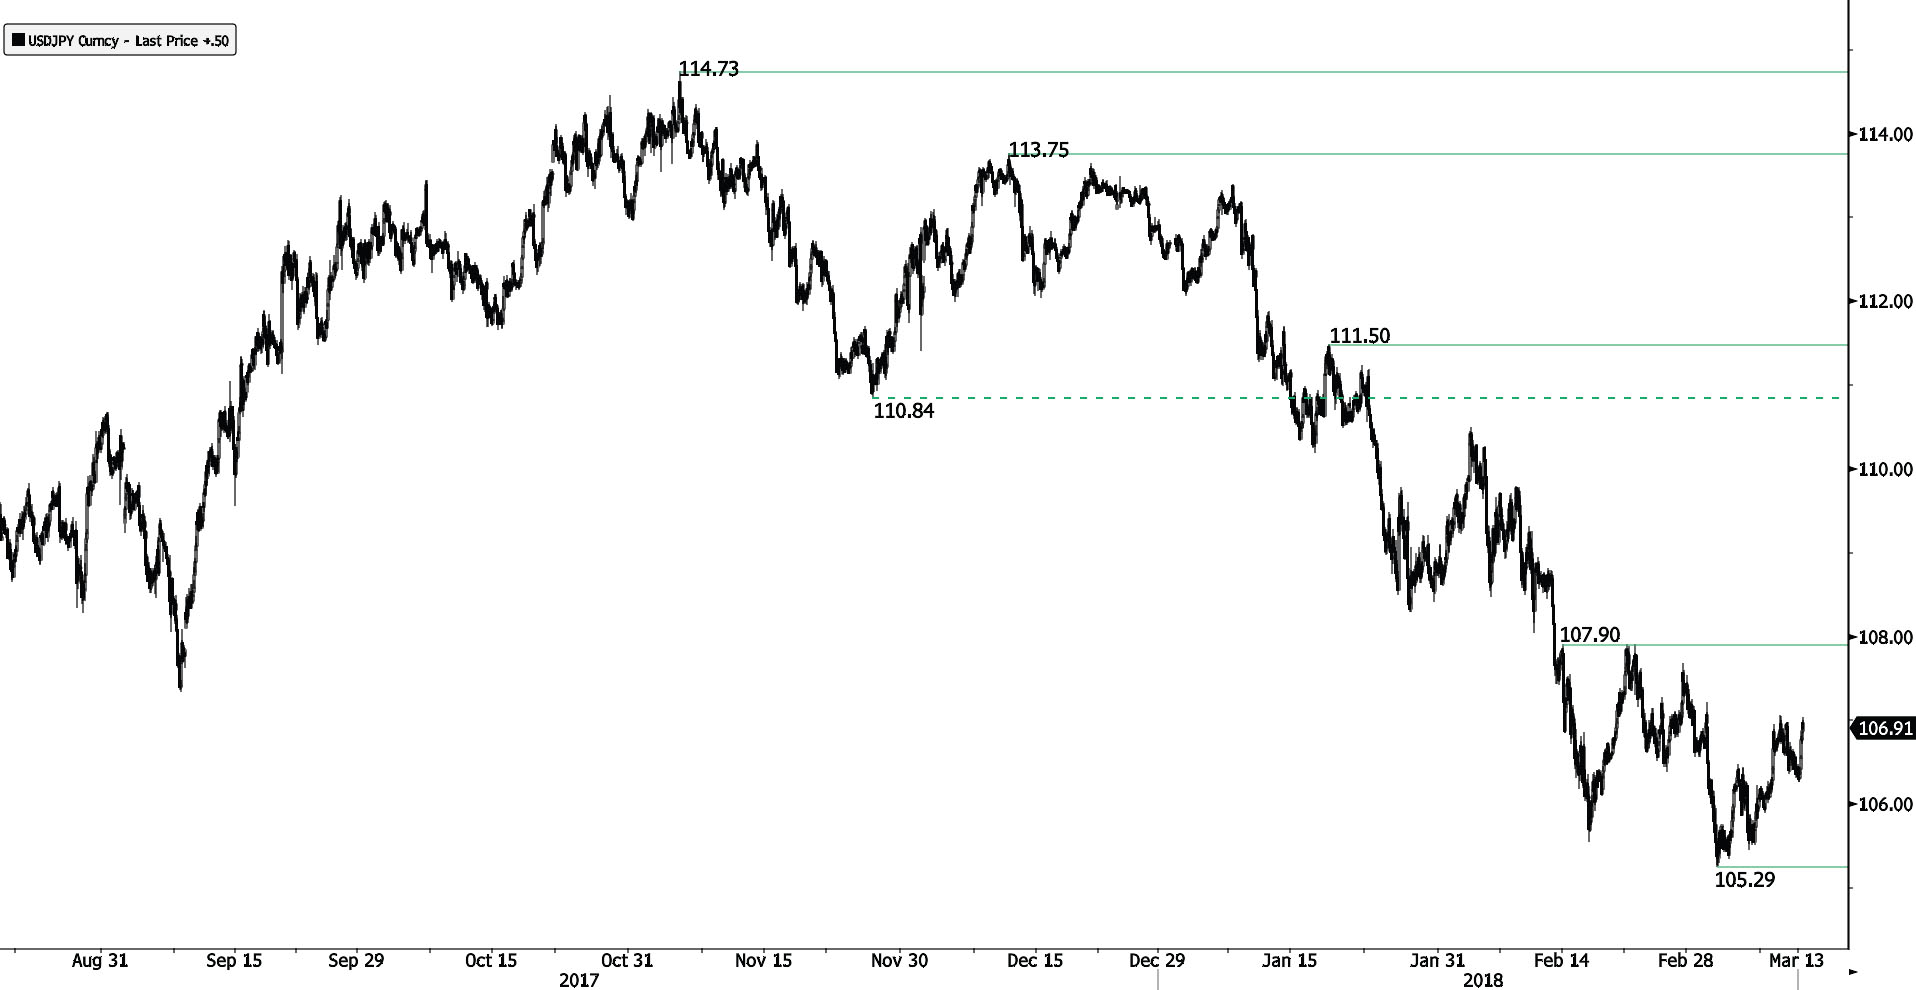
USD/JPY Bullish Consolidation
USD/JPY has now entered in a short-term bullish momentum, heading higher along the 106.70 range. Hourly support and resistance are given at 104.97 (11/10/2016 high) and 107.27 (25/02/2018 high). The bearish pattern started in January 2018 is maintained. The short-term technical structure suggests short-term increase.
We favor a long-term bearish bias. Support remains at 101.20 (09/11/2016 low). A gradual rise toward the major resistance at 125.86 (05/06/2015 high) seems unlikely. Expected to decline further support at 101.20 (09/11/2016 low). The pair trades largely below its 200 DMA.
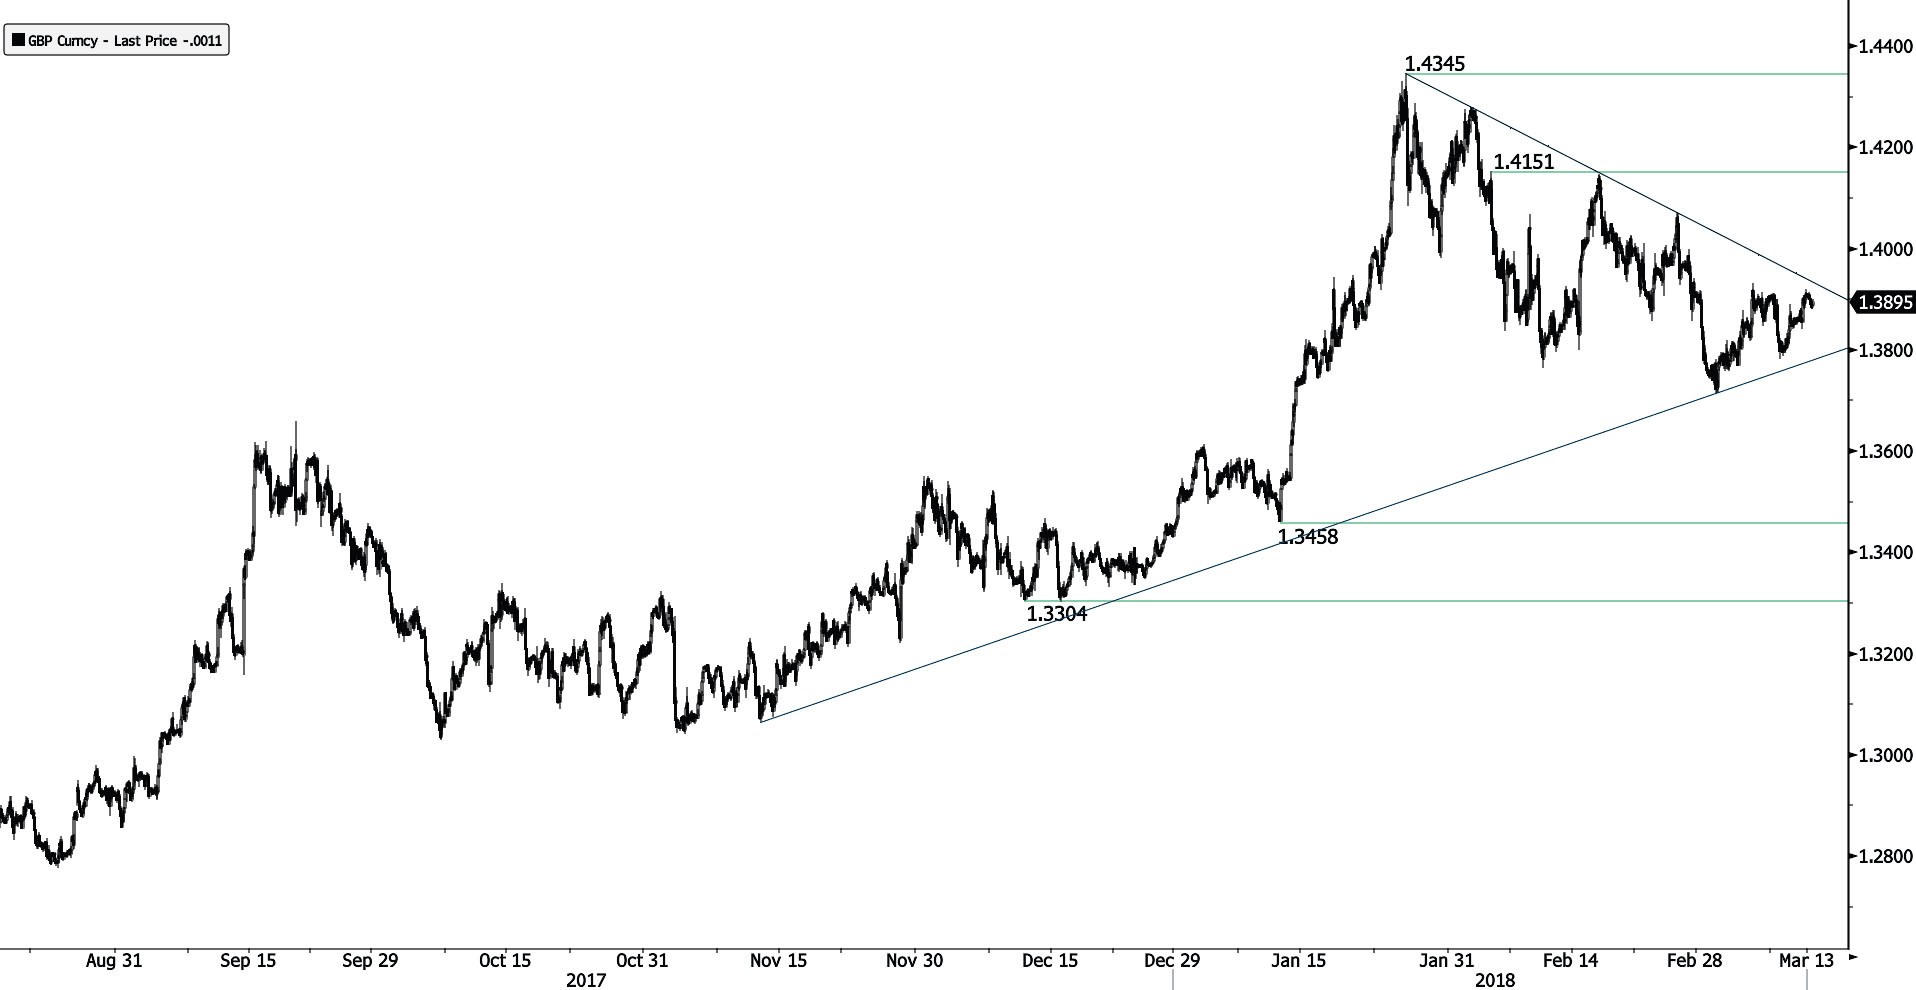
GBP/USD Lack Of Follow-Through
GBP/USD momentum is fading following its descent at 1.3782. The pair is trading between hourly support and resistance at 1.3678 (12/01/2018 low) and 1.3945 (19/01/2018 high). The technical structure suggests short-term increase.
The long-term technical pattern is reversing. The Brexit vote had paved the way for further decline but the pair is moving to 2016 highs. Long-term support and resistance are given at 1.1841 (07/10/2017 low) and 1.5018 (24/06/2016 high).
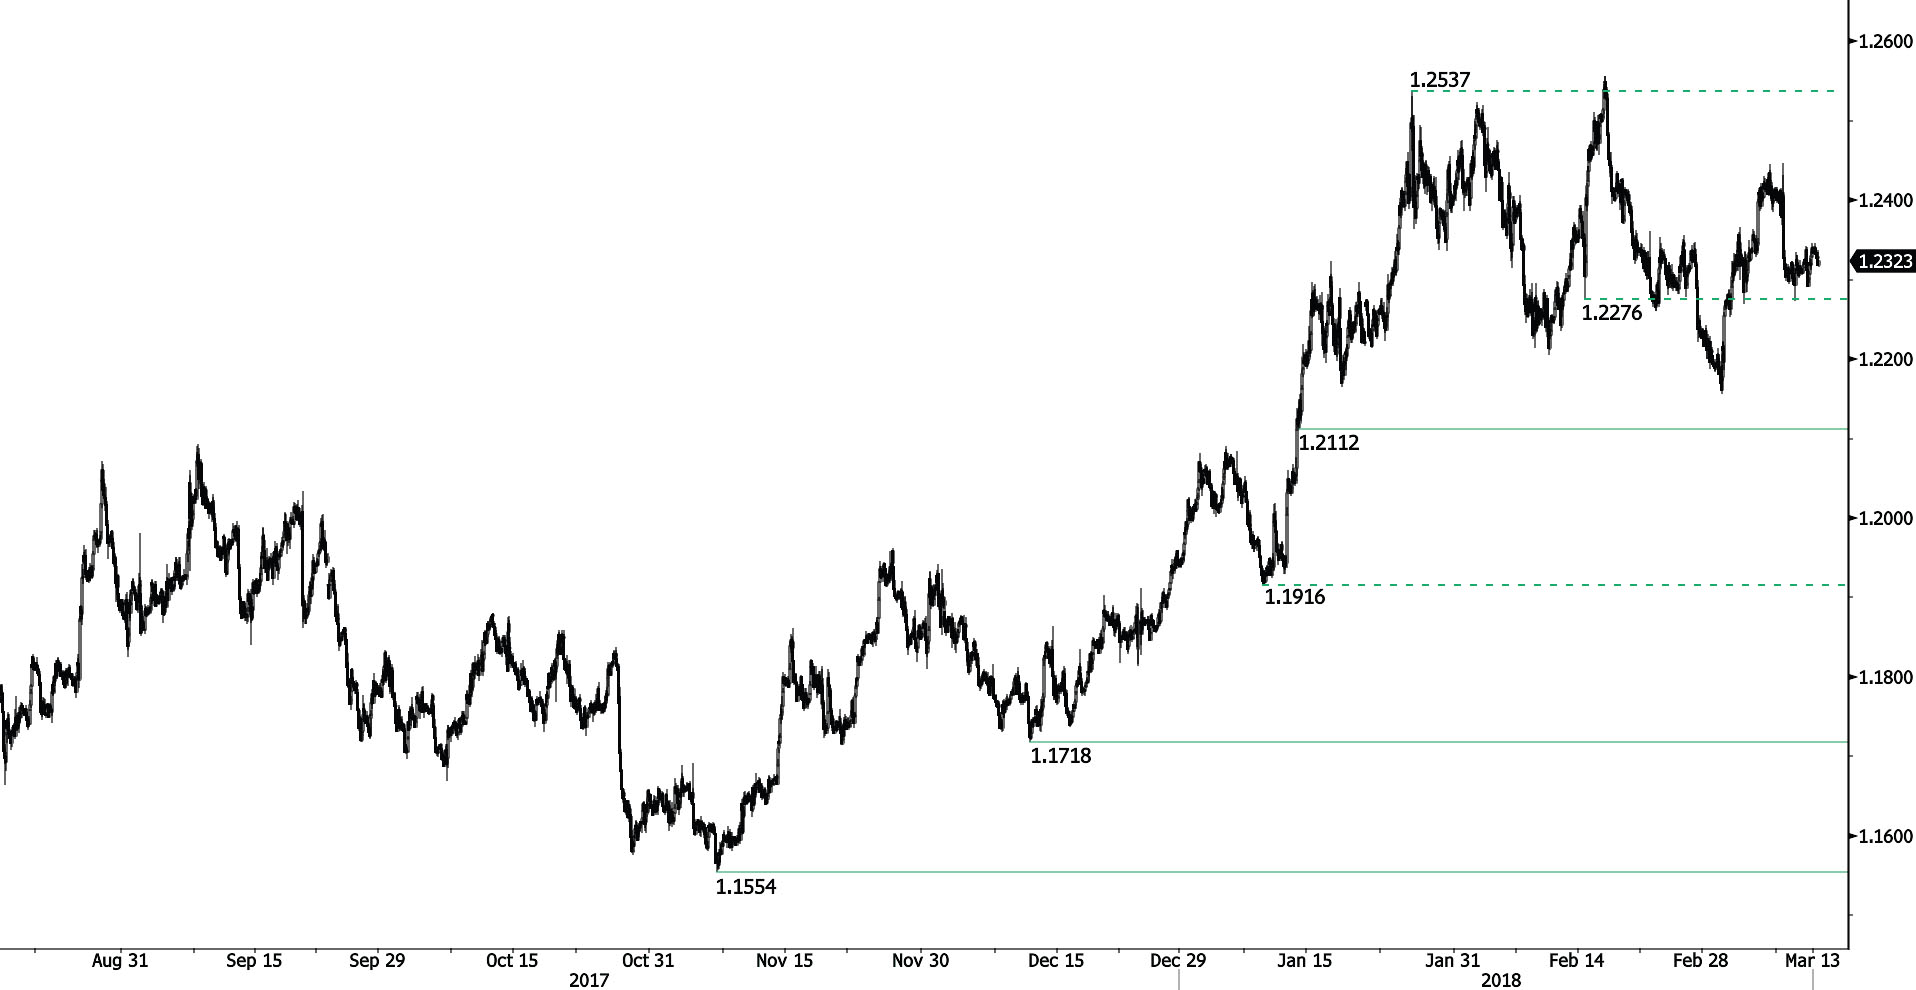
EUR/USD Rising Slowly
EUR/USD keeps pushing higher and is now consolidating. Hourly support and resistance are given at 1.2112 (12/01/2018 low) and 1.2475 (31/01/2018 high). The technical structure suggests further short-term sideway moves.
In the longer term, the momentum is turning largely positive. We favor a continued bullish bias. Key resistance is holding at 1.2886 (15/10/2014 high) while strong support lies at 1.1554 (08/11/2017 low).