Sample Category Title
USD/JPY Weakening
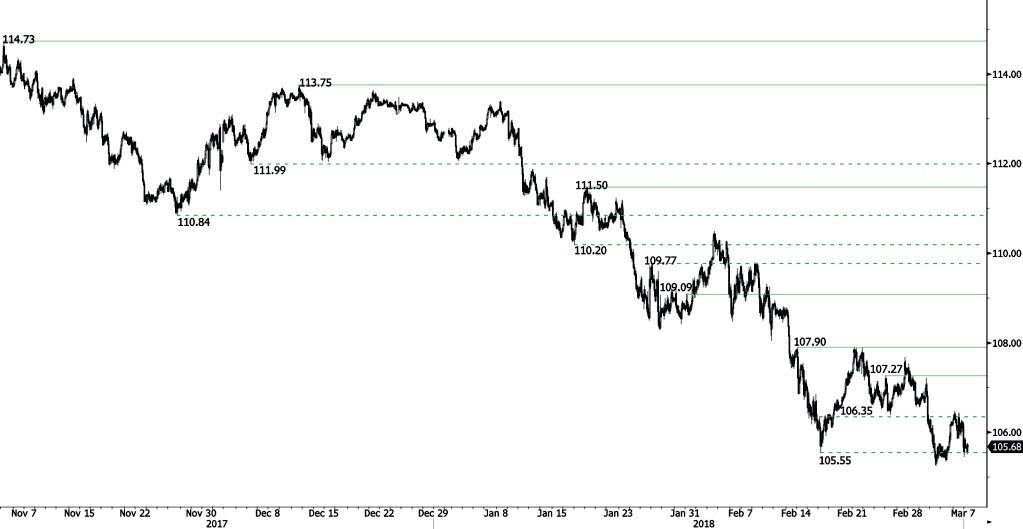
USD/JPY weakens back after reaching 106.46 and currently trading at the 105.75 range. Hourly resistance at 107.27 (25/02/2018 high) is distanced while hourly support at 104.97 (11/10/2016 high) approaches. The bearish pattern started in January 2018 is maintained. Hourly support is given at 106.35 (16/02/2018 high). The short-term technical structure suggests further short-term decrease.
We favor a long-term bearish bias. Support remains at 101.20 (09/11/2016 low). A gradual rise toward the major resistance at 125.86 (05/06/2015 high) seems unlikely. Expected to decline further support at 101.20 (09/11/2016 low).
GBP/USD Heading Higher
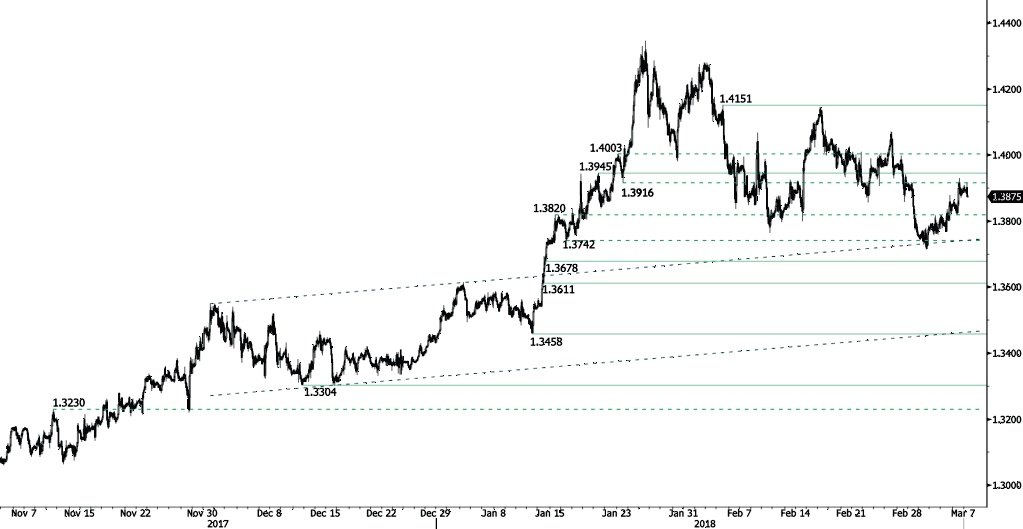
GBP/USD is recovering back, approaching hourly resistance at 1.3945 (19/01/2018 high) and heading for the 1.40 range. Hourly support is given 1.3678 (12/01/2018 low). The technical structure suggests short-term increase.
The long-term technical pattern is reversing. The Brexit vote had paved the way for further decline but the pair is moving to 2016 highs. Long-term support and resistance are given at 1.1841 (07/10/2017 low) and 1.5018 (24/06/2016 high).
EUR/USD Approaching Resistance At 1.2434
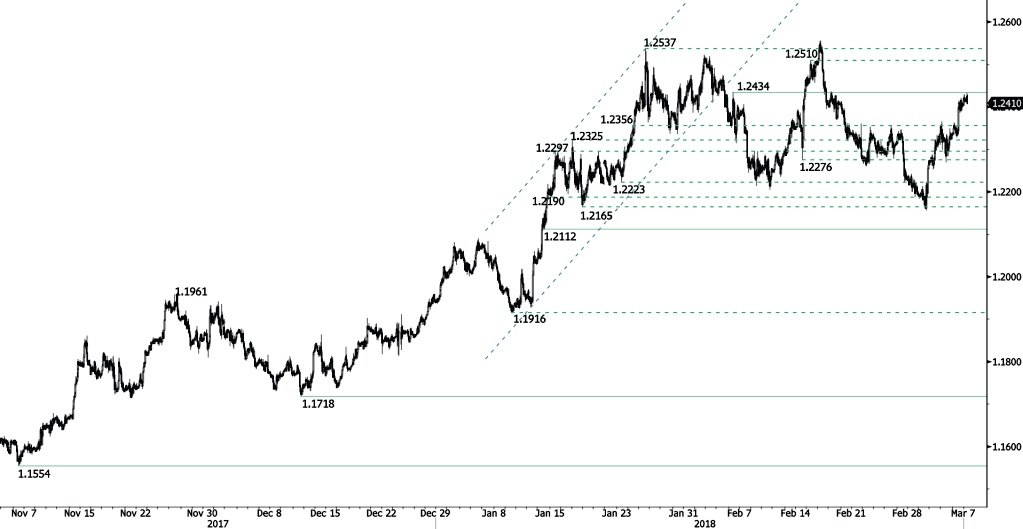
EUR/USD continues its rise, nearing hourly resistance at 1.2434 (26/02/2018 high) and largely recovering from 1.2155 low. Hourly resistance at 1.2112 (12/01/2018 low) is distanced. The technical structure suggests further upward moves.
In the longer term, the momentum is turning largely positive. We favor a continued bullish bias. Key resistance is holding at 1.2886 (15/10/2014 high) while strong support lies at 1.1554 (08/11/2017 low).
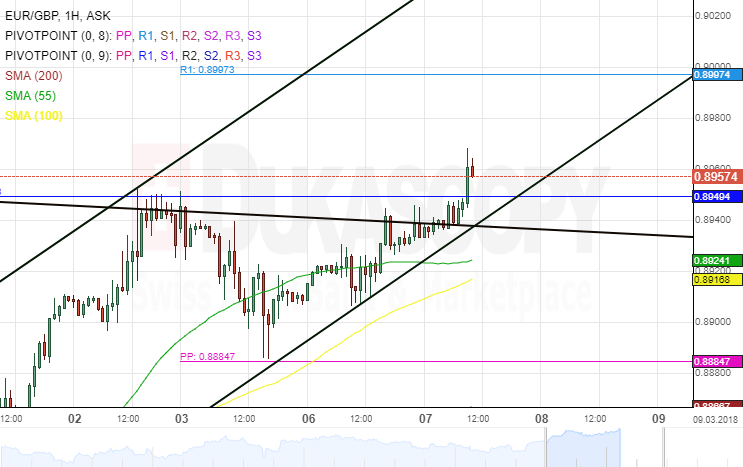
EUR/GBP 1H Chart: Set For Long-Term Surge
The common European currency has been trading in a large-scale triangle against the British Pound.
Following a breakout from the upper trend-line, this suggests that the bullish sentiment could continue dominating the exchange rate. However, it is important to note that the currency pair is likely to find a resistance at the weekly pivot point at 0.8949.
If the EUR/GBP pair manages to breach the aforementioned resistance level, the rate could be heading for a long-term surge. In addition, technical indicators favour bulls to grow stronger.
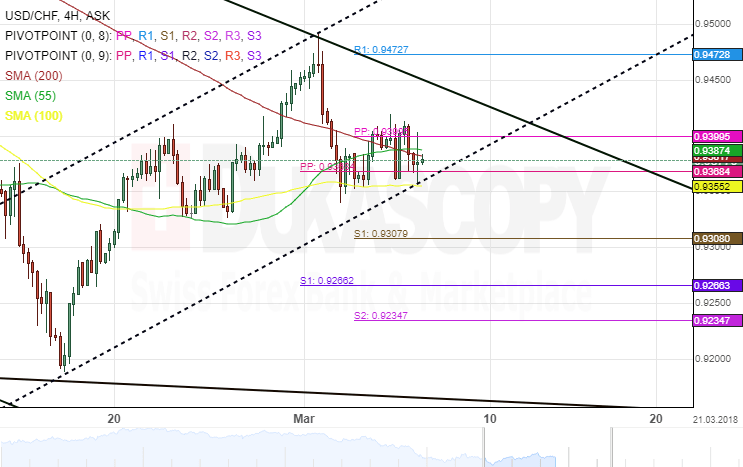
USD/CHF 4H Chart: Pair Fleshes Mixed Signal
The Greenback has started to gain strength against the Swiss Franc after the pair hit the lower boundary of a dominant channel. However, the surge was stopped by the weekly resistance at 0.9472.
Given that the currency pair has breached a resistance cluster set by the weekly and the monthly PPs with the combination of the 55– and 100-hour SMAs near 0.9387, the rate is likely to continue moving north for a test of the upper border of the dominant channel.
As for the nearest future, the USD/CHF pair could continue trading along the junior pattern during the following trading sessions.
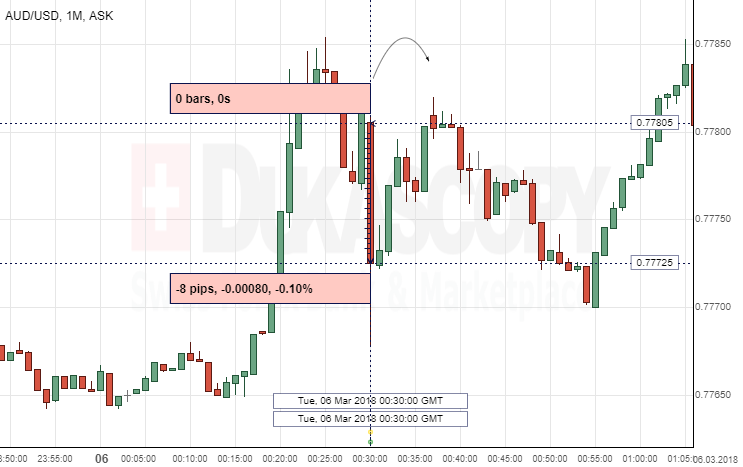
AUD/USD: Australia’s Retail Sales
The Aussie weakened against the Greenback after the release of January Australian retail sales data. The report caused a 0.10%, or 8 pips, drop in the pair, making it fall to the 0.7772 level and then continue fluctuating in the 0.7785 area.
The Australian Bureau of Statistics revealed that the country's retail sales contribution to the overall consumption faded more than anticipated in the reported month, following a decreased growth rate in the prior month.
The report revealed that retailers of brick-and-mortar stores, even by relentlessly competing with each other's sales prices, are powerless in enticing customers to increase their shopping basket due to the unsignificant wage growth and a considerable amount of debt.
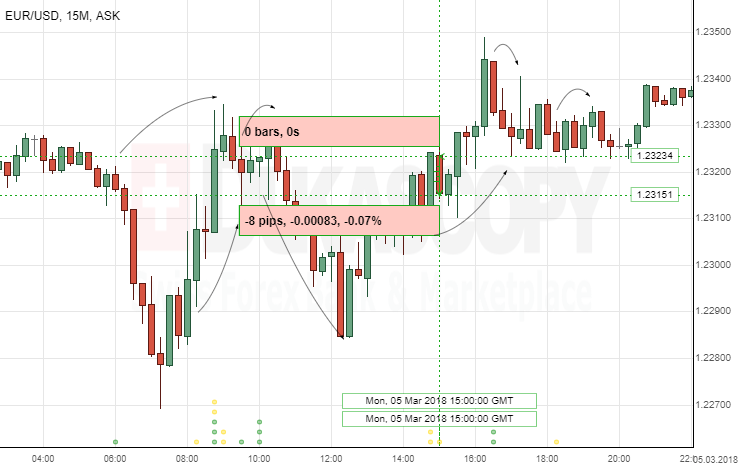
EUR/USD: US ISM Non-Manufacturing PMI
The EUR/USD currency pair was not strongly exposed to the influence of fundamentals on Monday. The Greenback strengthened against the European single currency eight base points, or 0.07%, reaching the 1.2315 level, to continue fluctuating and making the pair go back up and reach new intraday's highs.
The US economy kept expanding in February, data showed on Monday. The ISM revealed that its non-manufacturing PMI stepped lower to 59.5 points in the reported month, compared to 59.9 in January. Growth for the 103rd consecutive month, with 62.8% in February, was reflected by the non-manufacturing business activity index, showing 3% increase from the prior month.
Forex Analysis: US500 And Gold
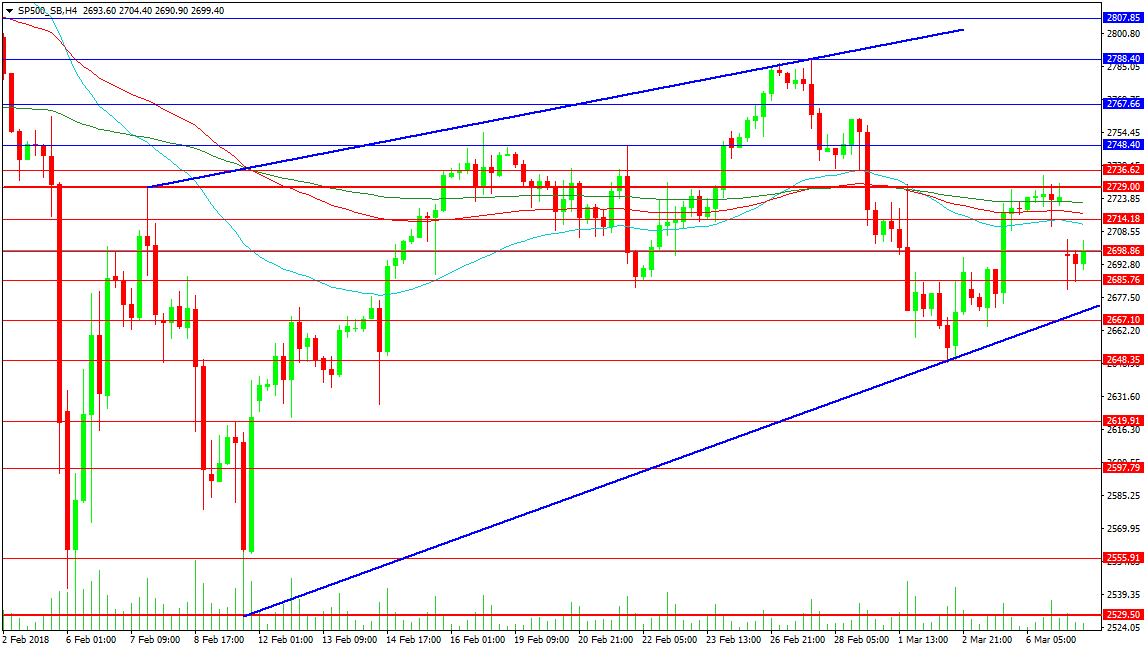
The US index has taken a fall lower with worries over trade tariffs. Today, it is opening with a gap down after the US Chief Economic Advisor to President Trump resigned last night. This raises the risk of a trade war taking place. The price has found support around the 2680.00 area and has a rising trend line adding support at 2671.50. A fall below this trend line suggests that the 2650.00 area could be targeted, with recent lows at 2647.30. A move under this area creates a lower low and can start taking out bullish stops down to 2600.00. Bearish traders are targeting the lows of 2018, around 2529.00 initially, with 2500.00 below.
Resistance can be found at 2700.00, with 2714.18 above, supported by the 4-hour moving averages in a tight band between 2711.00 and 2721.75. The next resistance comes at 2729.00 and 2736.62. Breaks higher above this area would create a higher high, which would be confirmed with a move through 2788.40, with trend line resistance at 2810.00.
 Gold
Gold
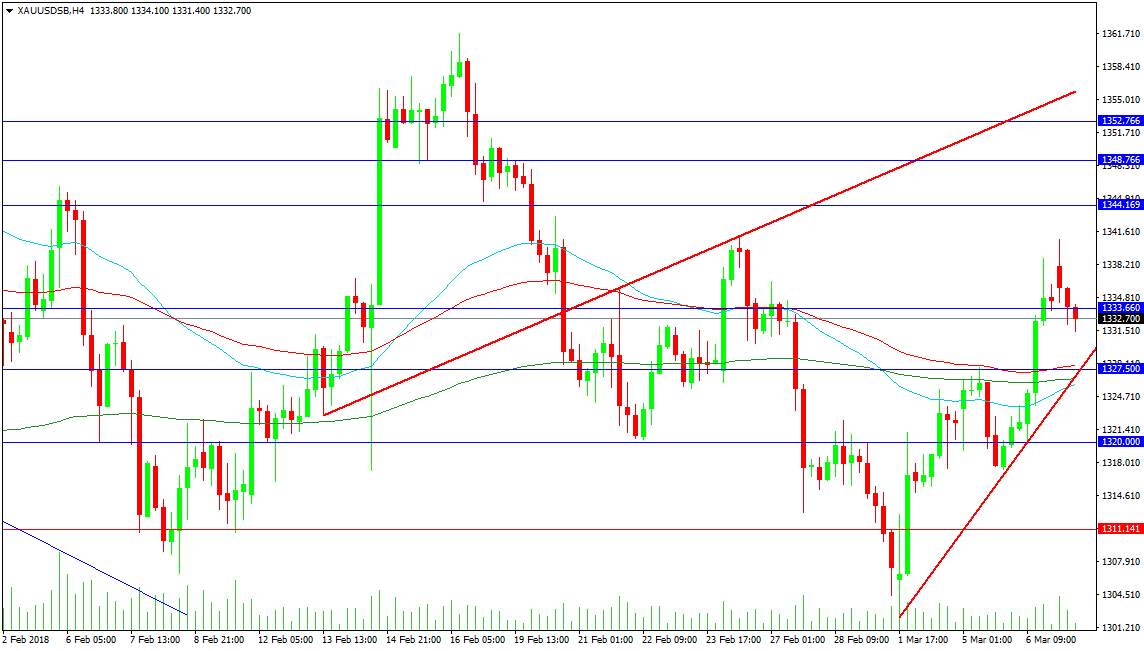
With risk-off sentiment in the markets and a flight to safety taking place, the precious metal has seen a modest recovery from the 1300.00 support area. This has resulted in a bullish move to test resistance at 1340.00, with price pulling back to support at 1331.50. Further support is firming up in the 1327.50 area as the moving averages in the 4-Hour timeframe turn higher and the supporting trend line of the bullish move rises up. Further support is seen at 1320.00 and the 1311.14 level. As mentioned, 1300.00 is a strong area extending down as far as 1290.00.
Resistance comes at the 1333.60 area, which price is currently struggling with. A break above this week’s highs targets the 1344.17 level, followed by the 1350.00 area and red trend line resistance at 1355.70. Above here, resistance is found at 1361.5 and 1365.00.
EUR/USD Analysis Diminishes Trading Range
The Asian session was relatively calm for EUR/USD on Tuesday. This lack of movement shifted significantly in favour of bulls mid-session when the rate surged 80 pips within a couple of hours. This surge was seemingly caused by uncertainty over global trade wars that weighted heavily on the US Dollar.
The Euro still managed to push higher in subsequent hours up to the monthly R1 at 1.2437; however, falling short from the upper boundary of the one-week channel up.
Even though technical indicators have been pushed in the overbought territory, they continue flashing bullish signals. Thus, the Euro might still approach the upper channel line of a six-week channel and the weekly R2 at 1.2480 before reversing to the downside. A possible southern target for today is the 1.2350 mark.
GBP/USD Analysis Likely Tended North
Following a rather quite morning on Tuesday, the Sterling took advantage of the weaker US Dollar later in the day and eventually dashed through the strong resistance of the monthly and weekly PPs and the 200-hour SMA circa 1.3870. Further advance did not follow, as the pair entered a minor period of consolidation.
Despite technical indicators flashing bearish signals, it is likely that the breached resistance succeeds at supporting the rate near 1.3860. This level also coincides with the 55-hour SMA and the prevailing one-week tend-line.
By and large, it is expected that the Sterling pushes higher within the following trading sessions until a downward-sloping trend-line and the 38.20% Fibo retracement is reached near 1.3950.