Sample Category Title
USD/CAD Consolidating Before Further Hike
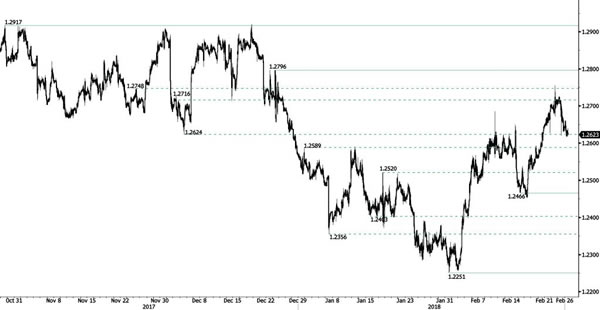
USD/CAD fell after reaching 1.2755 (22/02/2018 high) on Friday, and is heading for further recovery. January upward pattern is maintained, approaching hourly resistance at 1.2796 (25/12/2017 high). Hourly support is maintained at 1.2466 (15/02/2018 low). The technical structure indicates that continued rise is expected in the short-term.
In the longer term, the pair is trading between resistance point at 1.3805 (05/05/2017 high) and support at 1.2128 (18/06/2015 low). Strong resistance is given at 1.4690 (22/01/2016 high). The pair is likely to head lower. The pairs is trading below its 200 DMA
USD/CHF Sideways Trading
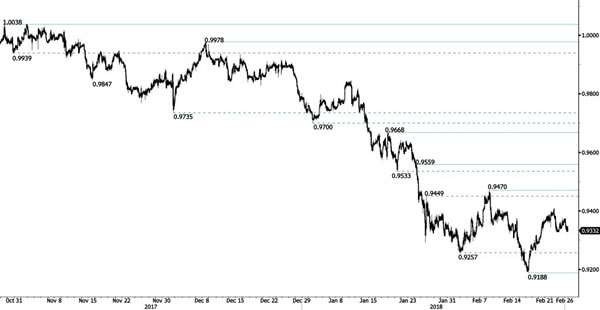
USD/CHF slightly decreased following its increase at 0.9408 (22/02/2018 high) on Friday and is currently stabilizing at 0.934. Hourly resistance stands at 0.9470 (08/02/2018 high) while hourly support remains at 0.9188 (16/02/2018 low).
In the long-term, the pair is still trading in range since 2011 despite some turmoil when the SNB unpegged the CHF. Key support lies at 0.9072 (07/05/2015 low) while resistance at 1.0344 (15/12/2016 high) is distanced. The technical structure favours a long term bullish bias since the unpeg in January 2015
USD/JPY Decline Maintained
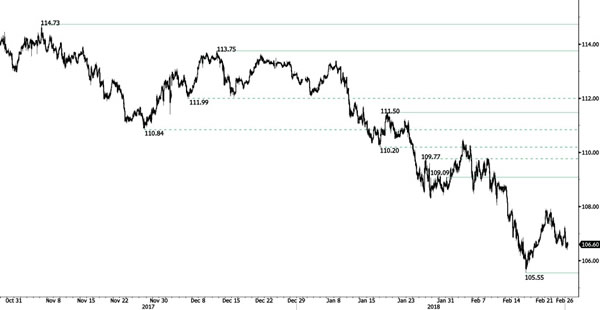
USD/JPY bearish trend continues and approaches range at 106.66. Hourly support and resistance are given at 105.55 (16/02/2018) and 109.09 (31/01/2018 high). The technical structure suggests short-term downside moves.
We favor a long-term bearish bias. Support at 105.55 (03/05/2016 low) is almost reached. A gradual rise toward the major resistance at 125.86 (05/06/2015 high) seems unlikely. Expected to decline further support at 101.20 (09/11/2016 low).
GBP/USD Increase Maintained
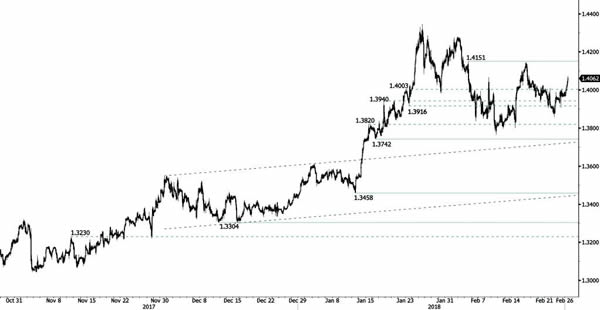
GBP/USD reached the 1.40 range, the upward momentum is maintained. Edging higher along resistance at 1.4151 (05/02/2018). Hourly support is given at 1.3742 (16/01/2018 low). The technical structure suggests further short-term upside move.
The long-term technical pattern is reversing. The Brexit vote had paved the way for further decline but the pair is moving to 2016 highs. Long-term support and resistance are given at 1.1841 (07/10/2017 low) and 1.5018 (24/06/2016 high).
EUR/USD Increasing
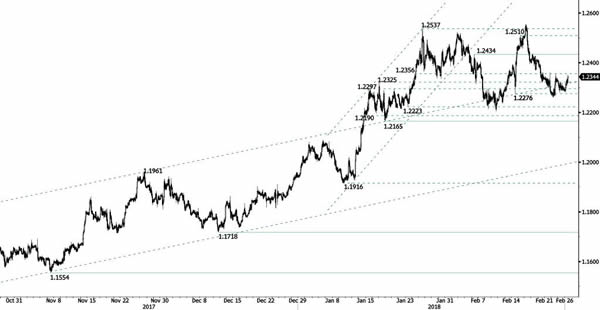
EUR/USD is turning positive, heading higher for hourly resistance at 1.2434 (06/02/2018 high). Hourly support remains at1.2165 (17/01/2018 low). The technical structure suggests upside moves.
In the longer term, the momentum is turning largely positive. We favor a continued bullish bias. Key resistance is holding at 1.2886 (15/10/2014 high) while strong support lies at 1.1554 (08/11/2017 low).
Stocks Bounce Back As The Greenback Grinds Lower
What higher US interest rates mean
The greenback started the week off the wrong foot and erased partially last week’s gains. The dollar fell across the board as the risk sentiment continued to improve. The dollar index was off 0.40%, down to 89.51, while stocks across the globe rallied, while Treasury yields eased slightly. US Treasury yields have increased substantially for the last few months but it failed to translate in to a strong USD. Why is this happening?
Lately, financial markets have been increasingly worried about the potential acceleration of inflation pressures. How investors did come from being worried about not enough inflation, to being worried about too much inflation, and this in just a couple of months? Indeed, the market spent the last few years monitoring closely inflation measures, hoping for stronger price pressure. At that time, an upward surprise in either the core CPI or the core PCE would trigger a dollar rally on speculation that the Fed would accelerate its tightening pace.
More recently, the opposite happened. The buck takes a dive every time economic data points toward stronger inflation. Lately, the publication of the January job report, which saw a surprise increase in wage growth, and to some extend the January CPI report, illustrates perfectly the situation. This tend to suggest that the market has reached different conclusion regarding the consequences of the Fed unwinding its massive balance and tightening short-term interest rates. Indeed, one could assume that higher interest rates implies a stronger dollar amid improving investment environment. However, higher interest rates also mean a higher cost of debt.
This has various implications, particularly for the US government and private companies. Regarding the former, the consequences are significant as higher short and long-term Treasury rates mean that the federal government’s borrowing costs will rise, which affects the budget and the national debt. The era of low-cost borrowing is ending for the government, which means higher deficit and a challenging path to fiscal sustainability. On the top of it, Trump’s tax cuts could only exacerbate budget deficit and debt. The markets are therefore right to be worried.
Regarding the effects on private companies, higher interest rates will obviously increase the cost of debt. It goes without saying that many companies will therefore become less profitable as financing costs increase. However, for companies highly indebted, which still exist only because interest rates were so low for so long, the consequences are worse. Combined with investors’ insatiable appetite for yields, the fall will be hard. Deleveraging means that many “zombie” companies will pay a high price. Eventually, higher interest rates could mean higher unemployment and slower economic growth.
The rapid surge of stocks’ volatility and the persistent weakness of the greenback suggest that financial markets are finally taking this situation seriously – and for good reasons. This is hard to tell what will be the medium and long-term consequences. However, one can assume that it won’t be smooth sailing as both private companies and the US government will be heavily impacted by this change of paradigm. It is therefore reasonable to assume that the US dollar will keep grinding lower, while the recent spike in equity volatility may just have been a warning shot. After all, there is a reason why the Fed has been so cautious in normalizing monetary policy.
Indian Economy growing at a faster pace than expected
Indian economy 4Q Gross Domestic Product is about to be released in February 28th 2018. Estimates anticipate a September – December growth of 6.90% (previous: 6.30%), its fastest pace since December 2016. Indian 4th quarter Gross Value Added, which provides a productivity measure for the entire economy is to be published at 6.60% (previous: 6.10%), its highest rate in 2017. Both indicators, as a matter of fact, have been strongly impacted by a low base year, mainly caused by recent Government’s demonetization measures. Recent GDP growth will give further support to a rate hike in April 2018, following Royal Bank of India’s hawkish minutes on February 21st 2018 (between 75-100 bps).
Since RBI’s minutes last week, Indian Sensex trades 542 points higher, at 34’395 (+1.60%) while 10-year Government yields decreased by -0.29% at 7.69%. USD/INR appreciated since last week, currently trading at 64.74 (+0.80%).
Technical Outlook: WTI OIL – Bulls Eye Next Targets At $64.27/62
WTI oil price is consolidating under new 2 ½ week high at $63.88, posted today, in extension of strong rally on Thu/Fri.
Oil price was boosted on Friday by closure of oil field in Libya, with strong bullish sentiment supported by comments by Saudi Arabia’s officials over the weekend, saying that the country would continue with reduced output, to support OPEC-led efforts to stabilize oil market by cutting global supplies.
Strong bullish signal was generated on Friday’s close above $63.36 pivot (Fibo 61.8% of $66.64/58.06 bear-leg), which would boost oil price for extension towards $64.16/27 (06/07 Feb double upside rejection) and 64.62 (Fibo 76.4% of $66.64/$58.06).
Supports at $63.36 (broken Fibo 61.8%) and $63.05 (30SMA) should ideally contain consolidation and keep immediate bulls intact.
Lower pivot lies at $62.26, provided by 20SMA and break here would sideline bulls and risk deeper pullback
Res: 63.88, 64.27, 64.62, 65.00
Sup: 63.36, 63.05, 62.35, 62.26
Forex Technical Analysis: EUR/USD, USD/JPY, GBP/USD
EUR/USD
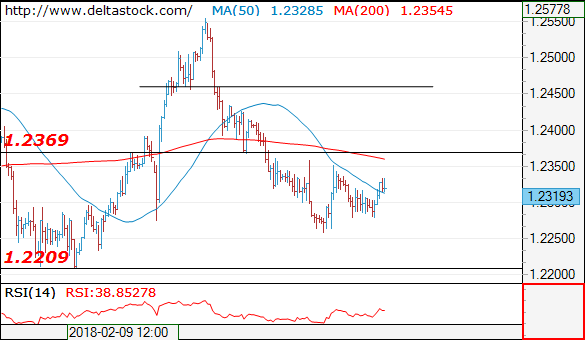
Current level - 1.2319
Despite the slow pace, the bias is positive, for an attack of 1.2370 resistance and a break through the latter will challenge 1.2460.
| Resistance | Support | ||
| intraday | intraweek | intraday | intraweek |
| 1.2370 | 1.2460 | 1.2260 | 1.2210 |
| 1.2460 | 1.2560 | 1.2210 | 1.2090 |
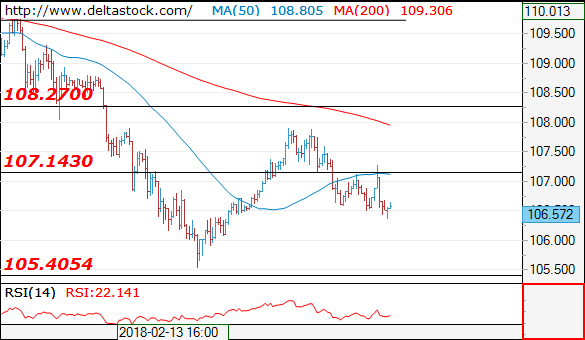
USD/JPY
Current level - 106.57
The recent rebound to 107.26 was corrective in nature and the bias is bearish, for a slide towards 105.50 low.
| Resistance | Support | ||
| intraday | intraweek | intraday | intraweek |
| 107.20 | 108.30 | 106.40 | 105.40 |
| 107.90 | 110.40 | 105.40 | 102.40 |
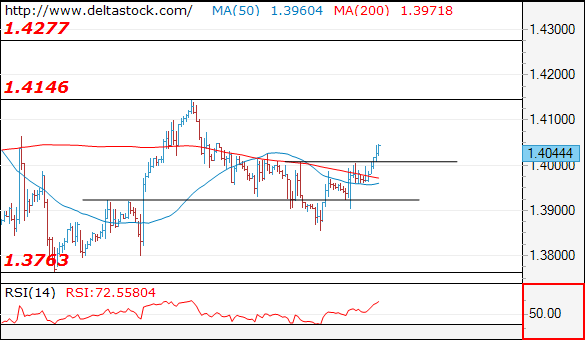
GBP/USD
Current level - 1.4044
My outlook is positive above 1.4000 intraday support, for a rise towards 1.4150 hurdle. A violation of the latter will challenge 1.4280.
| Resistance | Support | ||
| intraday | intraweek | intraday | intraweek |
| 1.4150 | 1.4280 | 1.4000 | 1.3760 |
| 1.4280 | 1.4340 | 1.3900 | 1.3620 |
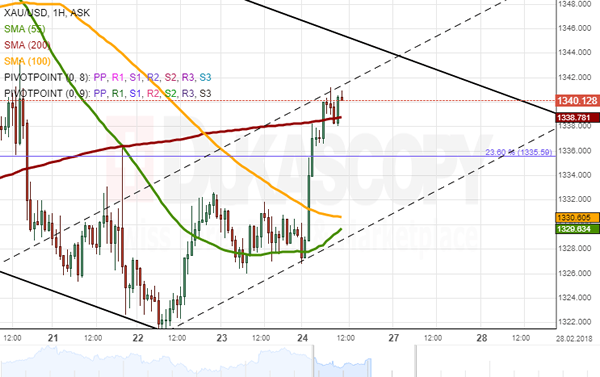
Gold Analysis: Strengthens Against US Dollar
The yellow metal was consolidating in a narrow range against the US Dollar on Friday, as neither bulls nor bears could overcome the 55– and 100-hour SMAs that bounded at the time.
A change in sentiment occurred early today when the US Dollar weakened against major currencies. Gold was not an exception, thus allowing the pair to surge 0.93% up to the 200-hour SMA circa 1,340.00.
It is likely that the pair tries to edge higher towards its upper boundary or the weekly R1 near 1,345.00. However, this scenario would occur solely if the rate breached the combined resistance of the 200-hour SMA and the monthly PP at 1,338.50 which was being tested at the time of this analysis.
In terms of support, Gold is should not fall below the 55– and 100-hour SMAs circa 1,330.00.
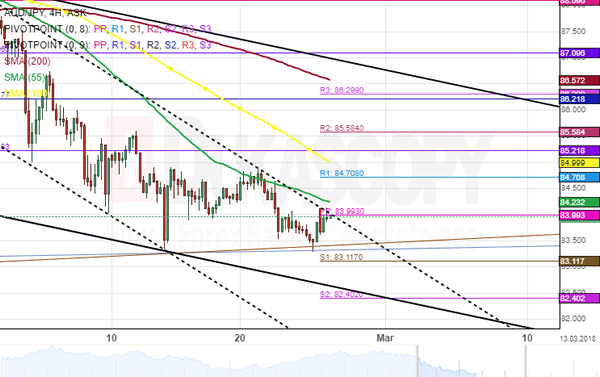
AUD/JPY 4H Chart: Poised For Further Decline
The price movement of AUD/JPY has been guided by several channels, the most important of which for long-term trading is the dominant channel down. Its upper boundary was reached late January when the pair made a U-turn from the monthly R1 at 88.97.
The currency exchange rate is likely to continue depreciating within the following trading sessions in line with the junior channel. The pair could breach the upper boundary of the junior channel in the short term; however, the combined resistance of the 55—hour SMA and the weekly PP near the 84.24 regions could force the price south.
In the meantime, technical indicators flash bearish signals. This suggests that bears' dominance over the rate is likely to grow stronger.