Sample Category Title
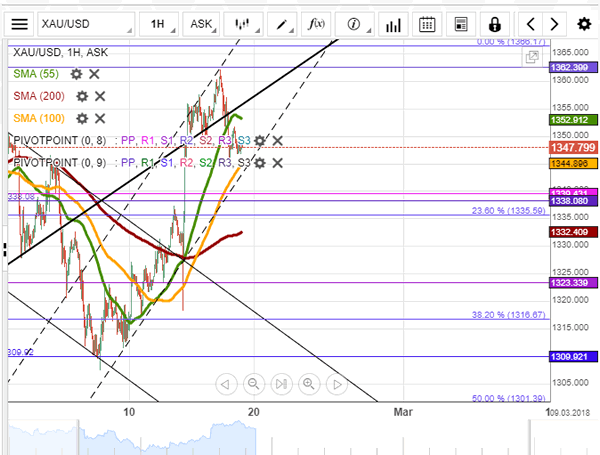
XAU/USD Analysis: Likely To Consolidate
The yellow metal has remained stable against the US Dollar during the following two weeks. Along the way, the rate did manage to reach a new 2017/2018 high at 1,360.00. The rate has since edged slightly lower and breached the 55-hour SMA.
Technical indicators demonstrate that some slight downside potential still exists in the market. But given that the pair is facing a strong support of the 100-hour SMA and the weekly and monthly PPs, losses should not exceed 1,338.10. From the upside, Gold is restricted by the 55-hour SMA circa 1,355.00.
Banks in the US are closed today; thus, the market is unlikely to introduce significant changes to the pair's positioning. The rate might even consolidate and remain between the 55– and 100-hour SMAs. If bulls are to prevail, gains could be capped at 1,360.00.
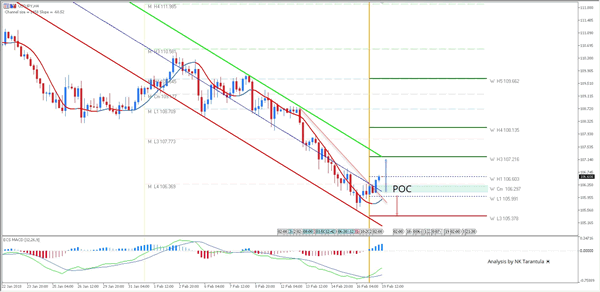
USD/JPY Possibly Up To 107.20 If 106.60 Breaks
The USD/JPY has been rejecting the POC zone 106.16-30 and the price formed a V-shaped bottom. The recent USD recovery aims for 106.60 and if the price makes a 4h close above 106.60 we could see 107.20. At this point the pair is supported but for bulls to dominate 106.60 must be broken. A steep retracement trend line break suggest further up, but if the price breaks below 106.00, we could see bears dominating again and the price might turn down to 105.40 zone.
W H3 -Weekly Camarilla Pivot (Weekly Interim Resistance)
W L3 - Weekly Camarilla Pivot (Weekly Interim Support)
W H3 - Weekly Camarilla Pivot (Weekly Interim Resistance)
W H4 - Weekly Camarilla Pivot (Strong Weekly Resistance)
D H4 - Daily Camarilla Pivot (Very Strong Daily Resistance)
D L3 – Daily Camarilla Pivot (Daily Support)
D L4 – Daily H4 Camarilla (Very Strong Daily Support)
POC - Point Of Confluence (The zone where we expect price to react aka entry zone)
European Markets Building Gain | Yen Shows Strength | Economic Data That Matters
Trading volume is going to remain low
The recent selloff was clearly an opportunity
The dollar index is still not showing any clear sign of robustness
European markets are picking up a bullish sign from Asian trading session although some of the countries are still celebrating the Chinese Lunar New Year holidays. Trading volume is going to remain low as the US markets are also closed due to a national holiday- President's Day. Qualms are lingering again over in the US about Russia interfering in the US election in 2016 and this impacted the last trading session over in the US. Nonetheless, this is something which investors have heard way too many times and the impact on the markets of this particular event is minimal. The S&P500 index closed the week on a higher note with a weekly gain of 4.3%.
Global equities are also showing more healthy signs as the recovery continues. The recent selloff was clearly an opportunity and bargain hunters have taken an advantage of this opportunity.
The energy in the Japanese yen is something which forex traders are paying close attention as the currency is drifting around a 15-month high. The Japanese economic data, export and import, confirmed that the economy is in a healthy condition and both numbers grew strongly in January from a year ago. In today's data, we have seen the import numbers picking up more steam and this resulted in a trade deficit- something not witnessed since May 2017.
The dollar index is still not showing any clear sign of robustness and it appears that the overall bearish trend could continue. It is likely that the index could touch the level of 85 in the coming months if the momentum continues in this manner. The weaker dollar is boosting the gold shine. The precious metal could test the resistance of 1384 and this is despite the fact that the Fed could change its stance towards a more hawkish monetary policy. Gold is also an option for an inflation hedge trade and a more aggressive monetary policy by the Fed, could trigger the risk off trade. Both of these affairs are working in gold's favour.
This is an important week for the equity and forex market. The GBP/USD touched the high of 1.4345 on January 25th but since then we have seen a correction for the pair. We have a slew of UK economic data due this week which includes the fourth-quarter GDP and employment figures. We know that some members of the BOE have adopted a more hawkish stance towards the monetary policy. If the numbers are overwhelming, it is likely that we could see more strength for Sterling.
A number of Fed's policymakers are speaking this week, not to mention that we also have the FOMC minute due on Wednesday. The Fed is behind the curve and inflation is picking up more steam, hence the Fed would have to adopt a more aggressive stance towards their monetary policy. This is the angle through which forex traders will be gauging the message from the Fed committee.
The ECB's monetary policy meeting accounts due on Thursday, something which will give us an idea if the ECB is going to end their tapering program as per the plan. It won't be long before the market participant would expect the ECB to start talking about the increase in the interest rate. Such an event would be highly bullish for the euro traders.
In terms of earning, equity traders are going to keep an eye on consumer sector and Wallmart is the important name. HSBC and Barclays are the two prominent names in the banking space coming up with their earnings. In the mining area, we will be paying attention towards BHP Billiton's earning.
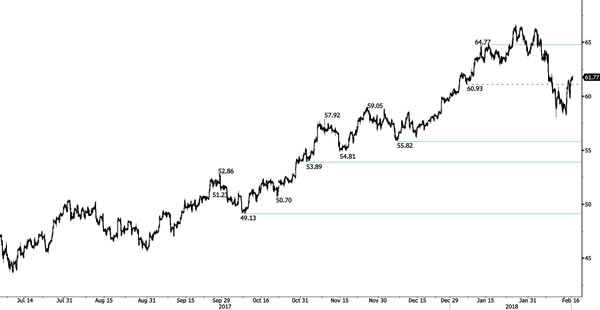
CRUDE OIL Continued Recovery Rally
Crude oil increases back, trading above 62 range and heading higher. Crude oil is contained between resistance at 64.77 (11/01/2017) and support at 55.82 (07/12/2017 low). The technical structure suggests short-term upside moves.
In the long-term, crude oil has recovered after its sharp decline last year. However, we consider that further weakness is very likely. For the time being, the pair lies in an upside trend since June 2017. Support lies at 42.20 (16/11/2016) while resistance is located at 77.83 (20/11/2014). Crude oil is trading largely above its 200 DMA.
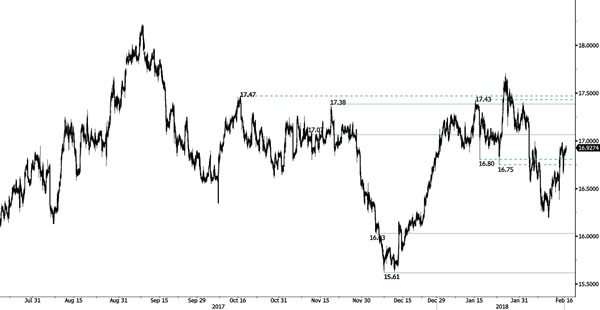
SILVER Bearish Breakout
Silver is heading lower following recent sideways trading. Silver lies between hourly resistance and support at 17.07 (09/11/2018 high) and 16.03 (05/12/2017 low). The technical structure suggests further short-term weakness.
In the long-term, the trend remains negative/ sideways. Further downside is very likely. The pair is trading below its 200 DMA. Resistance is located at 21.58 (10/07/2014 high). Strong support can be found at 11.75 (20/04/2009).
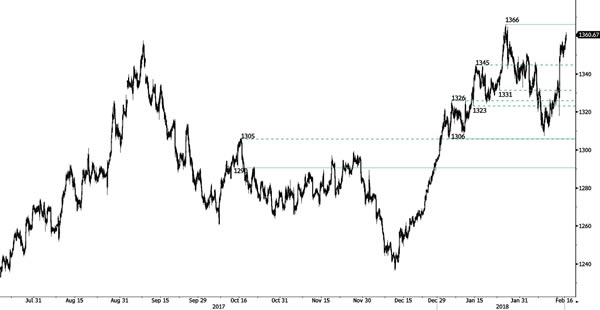
GOLD Bullish Trend Maintained
Gold is bouncing back to 1360 after failing to reach hourly resistance at 1366 (25/01/2018 high). Hourly supports given at 1306 (04/01/2018 low) and 1290 (16/10/2017) remain. The technical structure suggests further upside moves.
In the long-term, the technical structure suggests that there is a growing upside momentum. A break of 1'392 (17/03/2014) is required to confirm it. A major support can be found at 1'045 (05/02/2010 low).
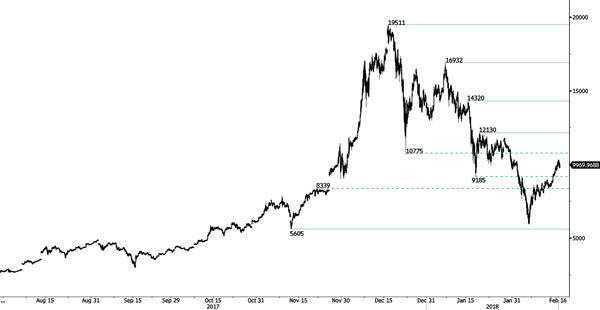
BITCOIN Heading Toward Resistance At 12130
Bitcoin is trading above 10000, confirming its upward trend and approaching resistance at 12130 (18/01/2018 high). Strong support remains at 5605 (13/11/2017 low). The short-term technical structure suggests further upside moves.
In the long-term, the digital currency has had an exponential growth but also presented important downturns. There is decent likelihood that the currency could stabilize between 7'000 - 12'000 in 2018. Bitcoin is trading above its 200 DMA (6'500 range).
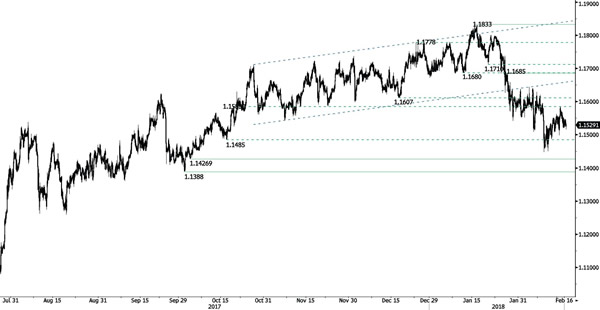
EUR/CHF Indistinct Trading
EUR/CHF is trading sideways at the 1.15 range. Hourly resistance is at 1.1685 (26/01/2018 high) while strong resistance remains at 1.1833 (15/01/2018 high). Hourly support is given at 1.1388 (02/10 2017 low). The technical structure suggests further short-term sideways moves.
In the longer term, the technical structure has reversed. Strong resistance is given at 1.20 (level before the unpeg). Yet, the ECB's slowing QE program is likely to cause buying pressures on the euro, which should weigh in favour of the EUR/CHF. Support can be found at 1.0234 (20/04/2015 low).
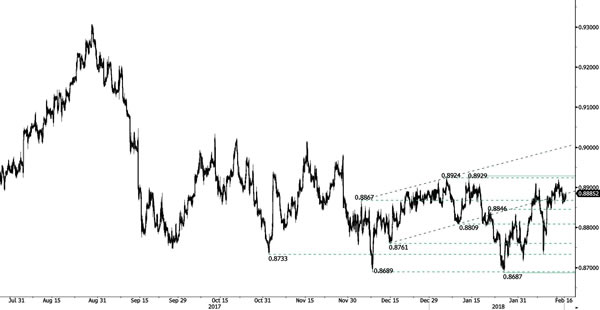
EUR/GBP Pause Continues
EUR/GBP is maintained close of hourly resistance at 0.8929 (12/01/2018 high). Hourly support at 0.8687 (25/01/2018) remains distant. The technical structure suggests further shortterm sideways move.
In the long-term, the pair has largely recovered from 2015 lows. The technical structure suggests further upside pressure. The pair is trading above its 200 DMA. Strong resistance can be found at 0.9500 (psychological level) while support remains at 0.8304 (05/12/2016 low).
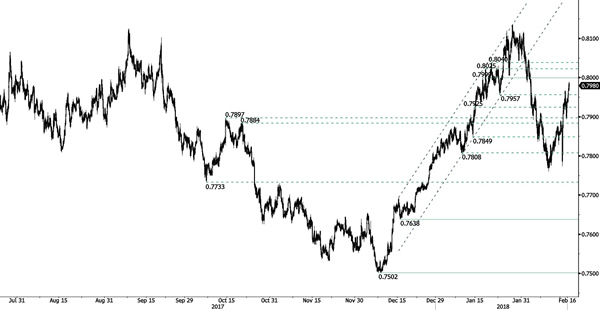
AUD/USD Slowly Weakening
AUD/USD is slightly falling after its short-term bullish momentum and remains near hourly resistance at 0.7999 (17/01/2018 high). Hourly support remains at 0.7638 (15/12/2017 low). The technical structure suggests further short-term upside moves.
In the long-term, the upward trend resumes after failing to reach key resistance at 0.8164 (14/05/2015 low). Key support stands at 0.6009 (31/10/2008 low). A break of the key resistance at 0.8164 (14/05/2015 high) is needed to invalidate our long-term bearish view.