Sample Category Title
USDCHF – Halts Weakness, Threatens Recovery
USDCHF - With the pair weakening further on Thursday, more decline is likely. On the downside, support lies at the 0.9250 level. A turn below here will open the door for more weakness towards the 0.9200 level and then the 0.9150 level. On the upside, resistance resides at the 0.9300 level where a break will clear the way for more strength to occur towards the 0.9350 level. Further out, resistance comes in at the 0.9400 level. Above here if seen will turn attention to 0.9450. All in all, USDCHF faces further upside pressure on correction.
Don’t Go Barking Up The Wrong Tree In The Year Of The Dog
Don't go barking up the wrong tree in the Year of the Dog
A predictable wave of profit taking and risk reduction, as is standard form ahead of US long weekends, dominated Friday session leading to USD gains as US yields pulled back. And while the broader US dollar negativity continues to seep through capital markets, some traders are suggesting of potential shifts in conviction levels while others believe Friday to be little more than pre-weekend risk reduction. But one thing that's clear, even the most prolific purveyors of price action are baffled regarding the breakdown of historical correlations across most asset classes.
One telling feature, however, is long-term investors continue to shun the greenback and this should continue to weigh on near-term sentiment. So no don't go barking up the wrong tree in this Year of the Dog, stick to the basics and follow the flow.
By way of the ordinary course of developments, the various market holiday observances might challenge liquidity conditions. Golden Week celebrations continue across Asia through Wednesday, while both the US and Canada take holidays Monday. Still, it could be an actionable week with numerous Fed speakers on tap and the FOMC minutes are sure to liven things up. Keep in mind; March rate hike is all but entirely priced-in so the markets will be keying on forwarding guidance.
As the markets pivot to Fed speak and the FOMC minutes this week, “deficit mania” is sounding a few decibels lower this morning.But none the less, ongoing concerns about swelling deficit's and the Feds sequence of interest rate normalisation should be the markets key focus this week and the primary drivers of near-term volatility.
And while US Bond yields eased on Friday, traders see icebergs ahead suggesting Friday's price action was little more than a reprieve amidst a bear market.
Equity Markets
Equity markets continue climbing the wall of worry despite inflationary fears gaining momentum and Bond Yields moving higher.Eventually, something has to give, but so far investors are betting on corporate earning rather than the shifting macro narratives.
Oil markets
Oil prices finished modestly higher on Friday to chalk up a weekly gain as prices continue to see-saw between the binary descriptions from OPEC's ongoing efforts to blow out the worldwide glut against the indications of rising U.S. production.Although Fridays price movements were likely position sensitive amid USD risk reduction and book squaring ahead of tomorrows Oil contract expiration
We should expect the WTI whipsaw to continue as debate rages between US shale and OPEC, but we're starting to carve out near-term ranges as longer-term oil bulls remain in dip buying mode with shale oil hedger looking to sell upticks.
Gold Markets
Gold prices eased late Friday as the dollar tentatively lifted off the canvas, despite taking a standing eight count earlier in the session when the DXY hit a three year low. A couple of hours USD short covering is unlikely to change the broader USD negativity, but when coupled with inflationary concerns heightening and a probable follow-up correction in equities markets around the corner, golds haven demand should continue to glitter.
On the physical side of demand, China Lunar New Year has seen few gold bars change hands despite physical premiums easing as futures prices continue to grind higher.
G-10 Currency Markets
Japanese Yen
Although the reappointment of Kuroda and the reshuffle of deputy governors is slightly more dovish BoJ, it is hard to reverse USDJPY downside given that continuous USD weakness could further drag USDJPY into the abyss. With the tables turned upside down on ten year US yield to JPY correlation and the US ” deficit mania. ” likely to return, USDJPY is in a precarious position.
Predictably we heard from Japan as Currency Chief Asakawa that he's readying the necessary action to prevent “one-sided” currency moves, but with the Buck getting pounded against all major currencies, Japans verbal intentions are falling on deaf ears.
The Euro
The pace of the EURUSD rally post-CPI last week surprised everyone but none the less if not for timely comments( seems always to happen when EUR rallies) from ECB Cœuré, we should have closed closer to the 1.2500 rather than 1.2400 handles. His remarks spooked the markets in pre-weekend risk reduction mode after he suggested policymakers are unanimous in sequence when market positioning was suggesting the Hawks were gaining the upper hand. But at some juncture, the market will ignore this verbal balderdash, and in reality, 1.3000 shouldn't be unimaginable before long predicated on strong fundamentals, the realisation of more hawkish ECB guidance but also the mechanics of the taper could reverse bond outflows.
Asia FX
Malaysian Ringgit
External drivers and specifically the broader USD moves will dictate the Ringgit momentum this week with the critical focus on USDJPY 106 level.But on the positive side of the equation, one of the primary headwinds that we considered to be a negative for the Ringgit was higher US yields which typically and historically have supported the USD. But the US interest rate to FX correlation broken, and despite USD bond yields pushing much higher t, the USD continues to sell off.
The markets are still feeling the hangover effect from the Chinese Lunar New Year, and risk appetite is waning and with a plethora of Fed speak along with the FOMC minutes likely to cause an uptick in volatility this week, offshore demand could remain muted. None the less, 106 level USDJPY will be a crucial US dollar sentiment gauge, and if the market pushes through again this week, we could see the Ringgit move to 3.87 and below as traders would then set sights on the critical 3.85 level.
Singapore Dollar
The US CPI fallout was somewhat unusual; triggering moves out of the dollar and into riskier currencies, so the SGD benefited as the CNH rallied hard this week.But CNH could start to underperform. Let me qualify this next comment as no one, and I mean no one knows what the Pboc are going to do. So we can only make hay from innuendo and strategically placed criticisms from regulators in HK press. But there seems to be a pickup in debate onshore about the merits of further RMB appreciation which could dent SGD appeal. But in the mean times, we should enjoy the SGD strength ( not because I get paid in SGD, although that is always a welcome bonus). But there is some real value appeal that has emerged in SGD ahead of this weeks budget, as a rosier outlook in the statement could be the precursor to monetary tightening.But also appealing to foreign investors is the government will take measures to cover the current operating fiscal deficit gap.
EUR/USD Weekly Outlook
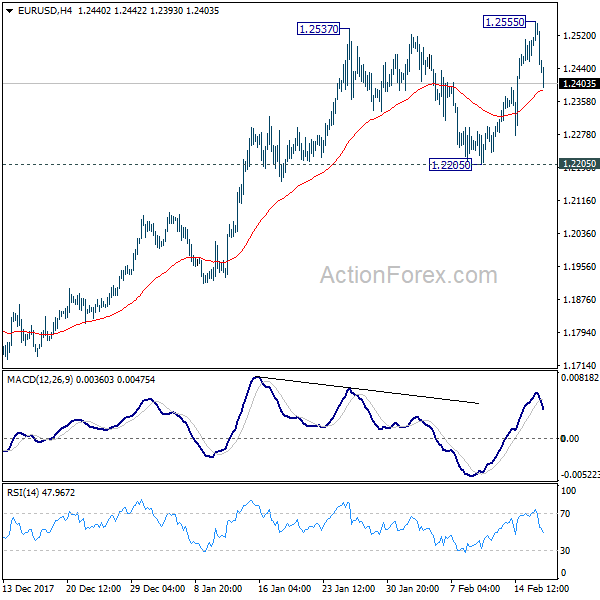
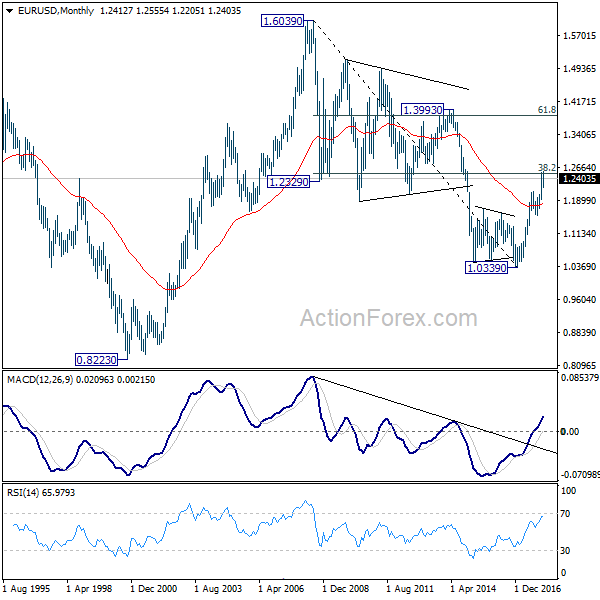
EUR/USD breached 1.2537 high to 1.2555 last week but quickly retreated. Initial bias is turned neutral this week first. On the upside, break of 1.2555 will revive the bullish case of up trend resumption and target 100% projection of 1.0569 to 1.2091 from 1.1553 at 1.3075. However, break of 1.2205 will confirm rejection by 1.2516 key fibonacci level and trend reversal.
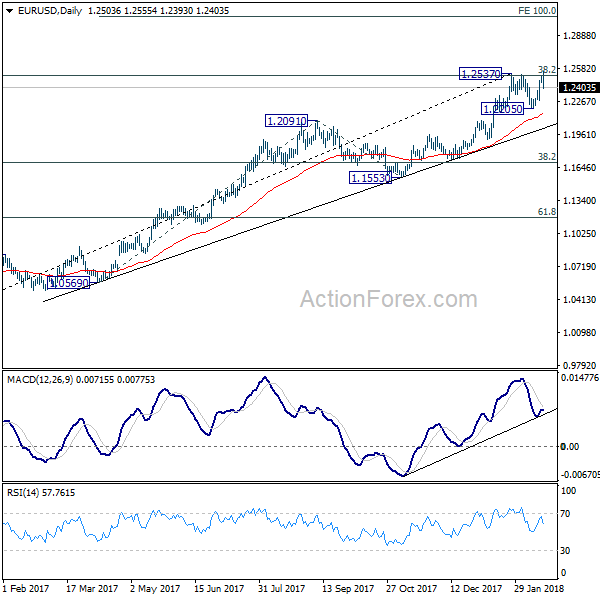
In the bigger picture, key fibonacci level at 38.2% retracement of 1.6039 (2008 high) to 1.0339 (2017 low) at 1.2516 remains intact despite attempts to break. Hence, rise from 1.0339 medium term bottom is still seen as a corrective move for the moment. Rejection from 1.2516 will maintain long term bearish outlook and keep the case for retesting 1.0039 alive. However, sustained break of 1.2516 will carry larger bullish implication and target 61.8% retracement of 1.6039 to 1.0339 at 1.3862.
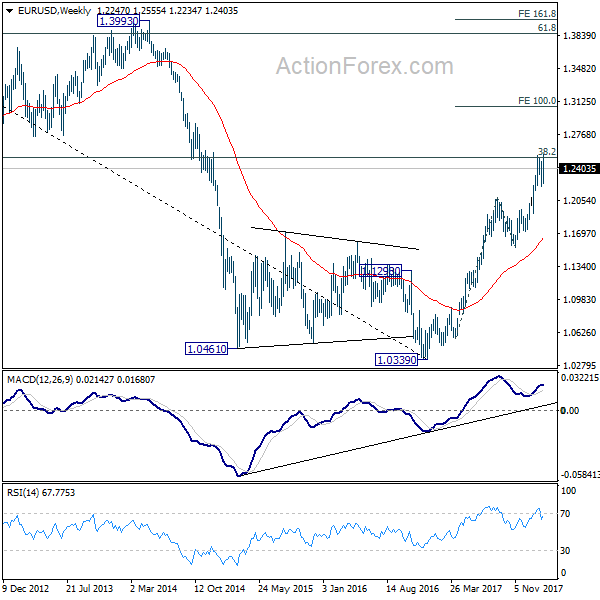
In the long term picture, 1.0339 is seen as an important bottom as the down trend from 1.6039 (2008 high) could have completed. It's still early to decide whether price action from 1.0339 is developing into a corrective or impulsive pattern. Reaction to 38.2% retracement of 1.6039 to 1.0339 at 1.2516 will give important clue to the underlying momentum.
USD/JPY Weekly Outlook
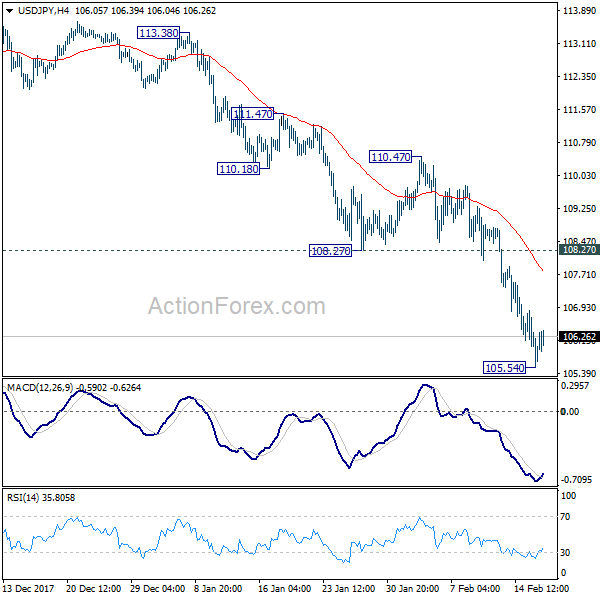
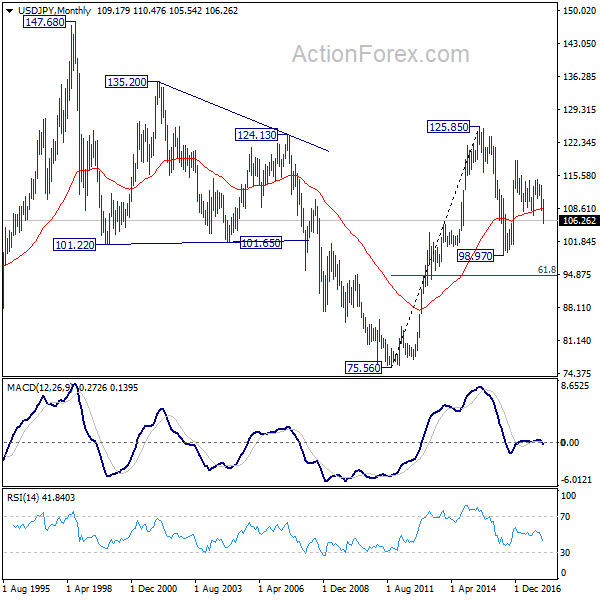
USD/JPY's down trend continued last week and reached as low as 105.54. A temporary low was formed with 4 hour MACD crossed above signal line. Initial bias is neutral this week for consolidation first. But recovery should be limited below 108.72 support turned resistance and bring fall resumption. Below 105.54 will target 100% projection of 118.65 to 108.12 from 114.73 at 104.20 next.
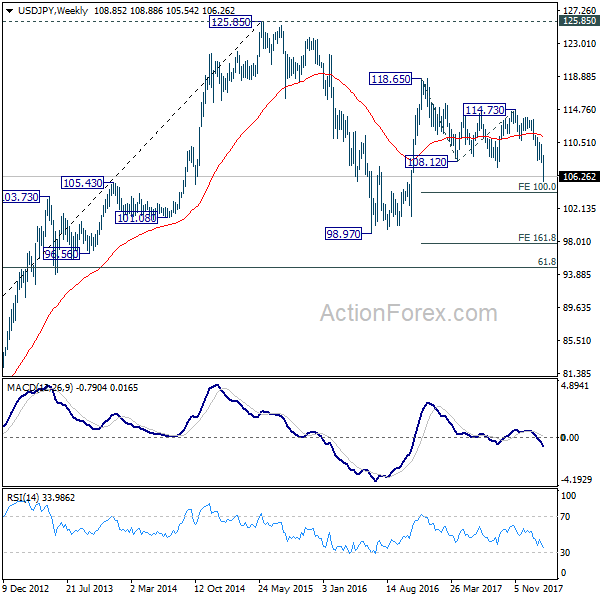
In the bigger picture, current development argues that the corrective pattern from 118.65 is extending. The solid break of 61.8% retracement of 98.97 to 118.65 at 106.48. now suggests that the pattern from 125.85 high is possibly extending. Deeper fall could be seen through 98.97 key support (2016 low). This bearish case will now be favored as long as 110.47 resistance holds.
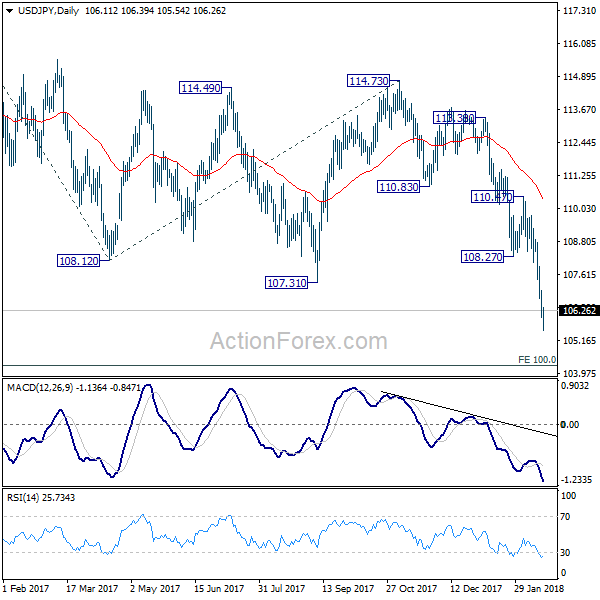
In the long term picture, the rise from 75.56 (2011 low) long term bottom to 125.85 top is viewed as an impulsive move, no change in this view. Price actions from 125.85 are seen as a corrective move which could still extend. In case of deeper fall, downside should be contained by 61.8% retracement of 75.56 to 125.85 at 94.77. Up trend from 75.56 is expected to resume at a later stage for above 135.20/147.68 resistance zone.
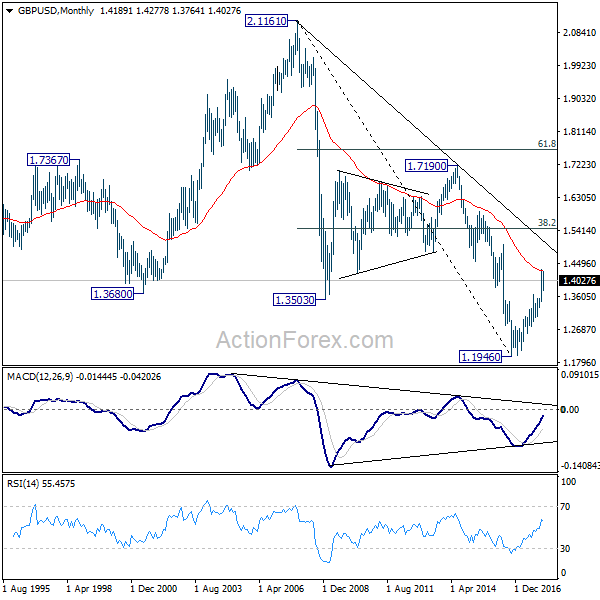
GBP/USD Weekly Outlook
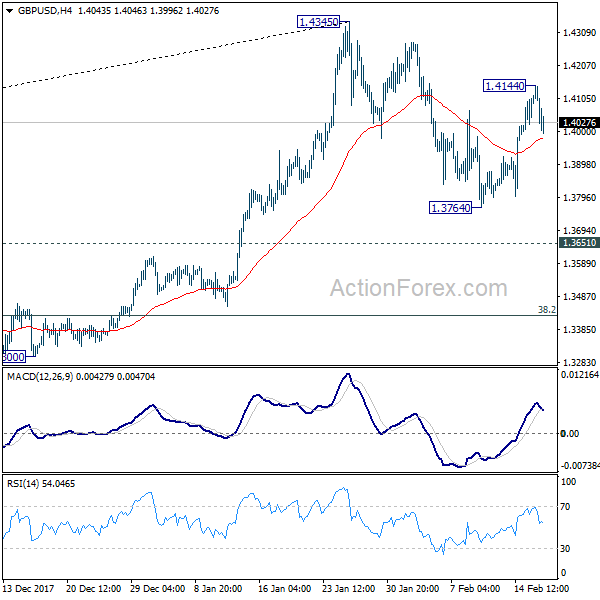
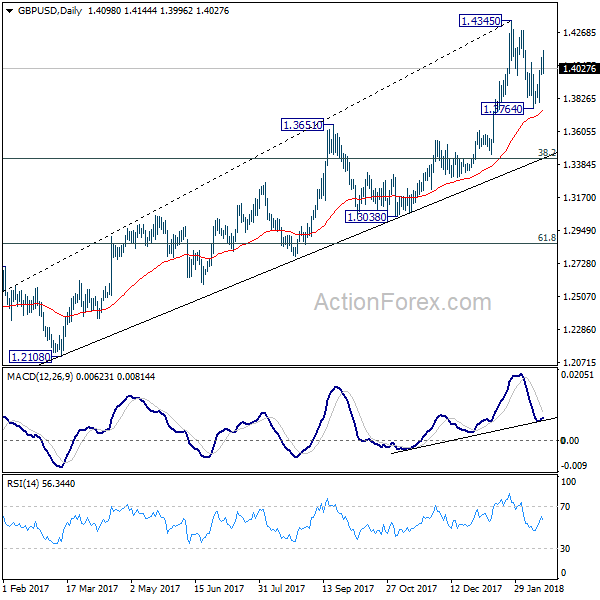
GBP/USD rebounded to 1.4144 last week but formed a temporary top there and retreated. Initial bias is neutral this week first. The pull back from 1.4345 should have completed with three waves down to 1.3764. Above 1.4144 will target 1.4345 first. Break will resume larger up trend and target long term trend line resistance (now at 1.5105). On the downside, below 1.3764 will extend the correction to 1.3651 resistance turned support instead.
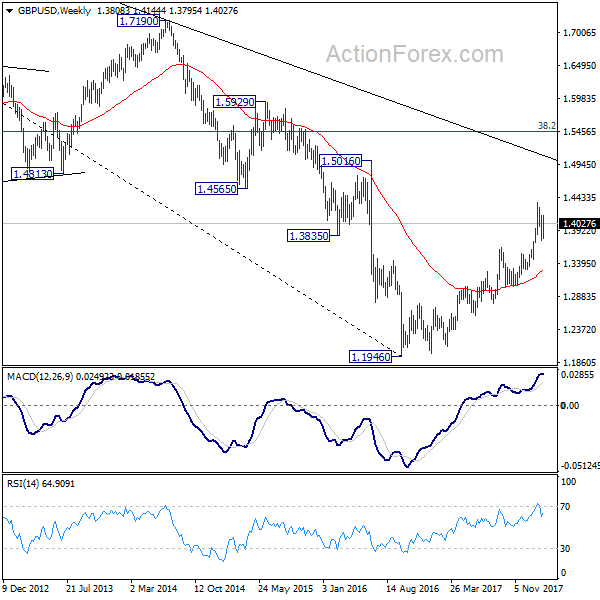
In the bigger picture, as long as 1.3038 support holds, medium term outlook in GBP/USD will remains bullish. Rise from 1.1946 is at least correcting the long term down from 2007 high at 2.1161. Further rally would be seen back to 38.2% retracement of 2.1161 (2007 high) to 1.1946 (2016 low) at 1.5466. However, GBP/USD fails to sustain above 55 month EMA (now at 1.4279) so far. Break of 1.3038 support, will suggests that rise from 1.1946 has completed and will turn outlook bearish for retesting this low.
In the longer term picture, rise from 1.1946 should at least be correcting the whole long term down trend form 2.1161 and should target 38.2% retracement of 2.1161 (2007 high) to 1.1946 (2016 low) at 1.5466. It too early to tell if it's developing into a long term up trend. We'll monitor the upside momentum and reaction to 1.5466 to decide later.
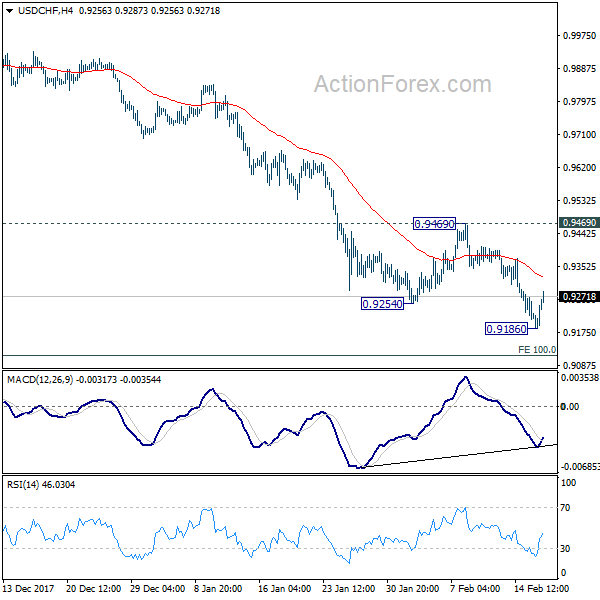
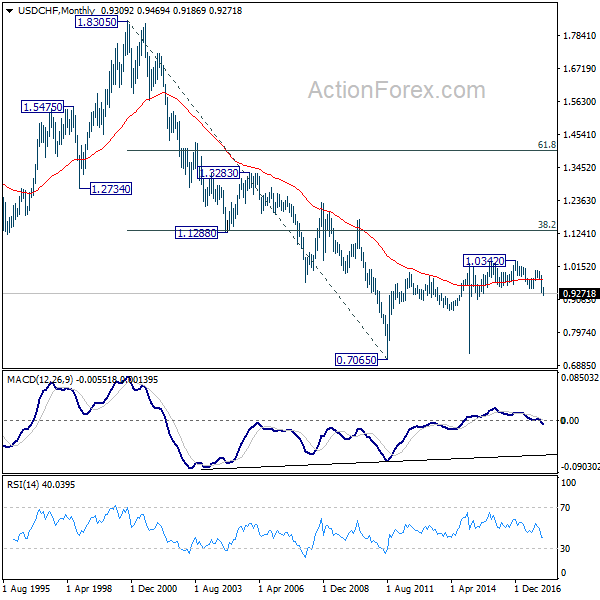
USD/CHF Weekly Outlook
USD/CHF's down trend resumed last week and reached as low as 0.9186. As a temporary low was formed, initial bias is neutral this week first. Upside of recovery should be limited by 0.9469 resistance to bring fall resumption. Below 0.9186 will target 0.9115 medium term projection level next. However, considering bullish convergence condition in 4 hour MACD, break of 0.9469 will indicate near term reversal and turn outlook bullish for 55 day EMA (now at 0.9564).
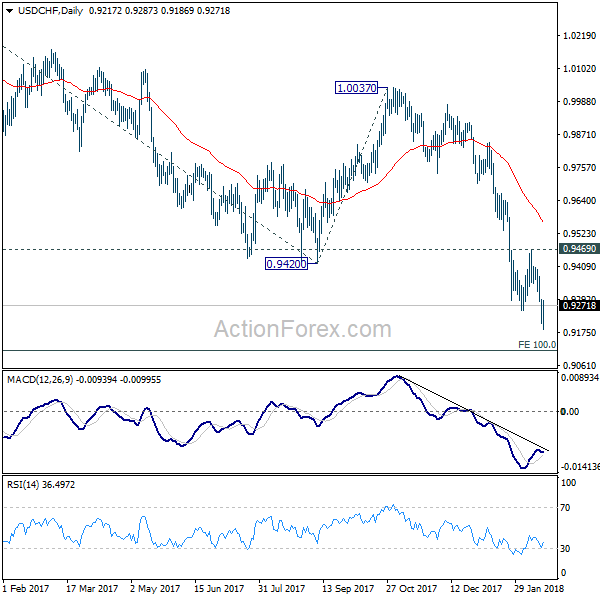
In the bigger picture, fall from 1.0342 is developing into a medium term down trend. Deeper decline should be seen to 100% projection of 1.0342 to 0.9420 from 1.0037 at 0.9115. Break will target 161.8% projection at 0.8545. In any case, sustained trading above 55 day EMA is needed to be the first sign of medium term reversal. Otherwise, outlook will stay bearish even in case of strong rebound.
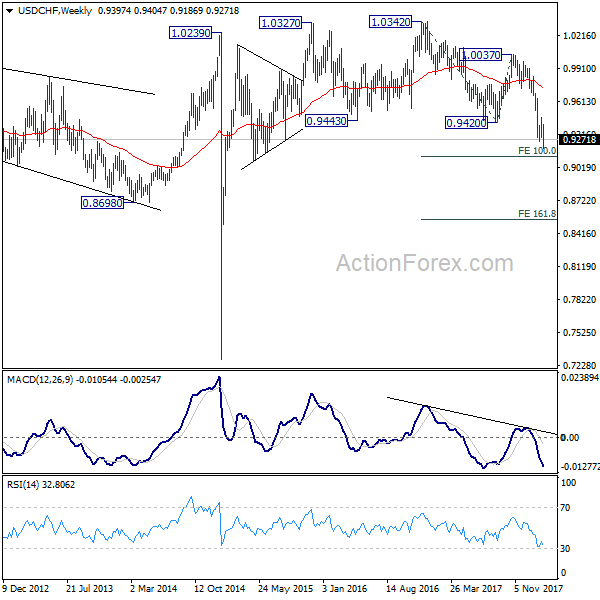
In the long term picture, the strong break of 0.9420 support and downside acceleration turns the long term outlook rather bearish. Corrective rebound from 0.7065 (2011 low) could have already completed at 1.0342. 0.8698 support will be a key level to watch. Sustained break there could bring retest of 0.7065.
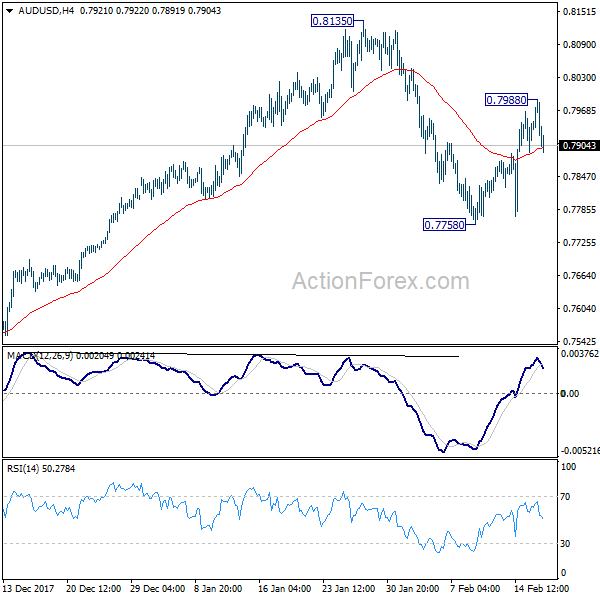
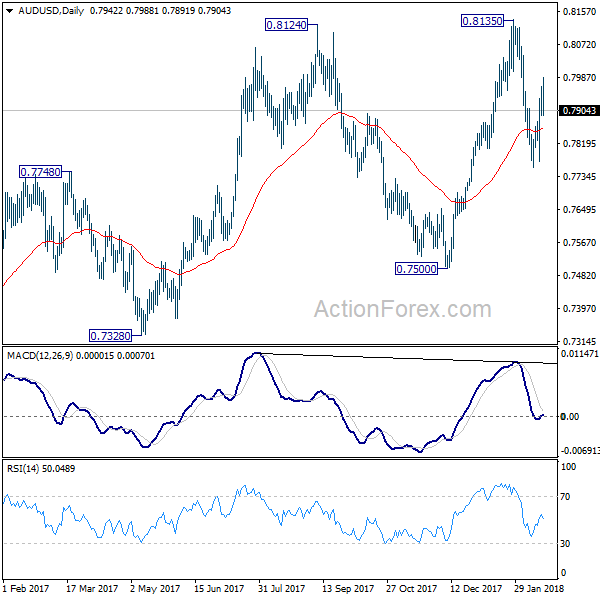
AUD/USD Weekly Outlook
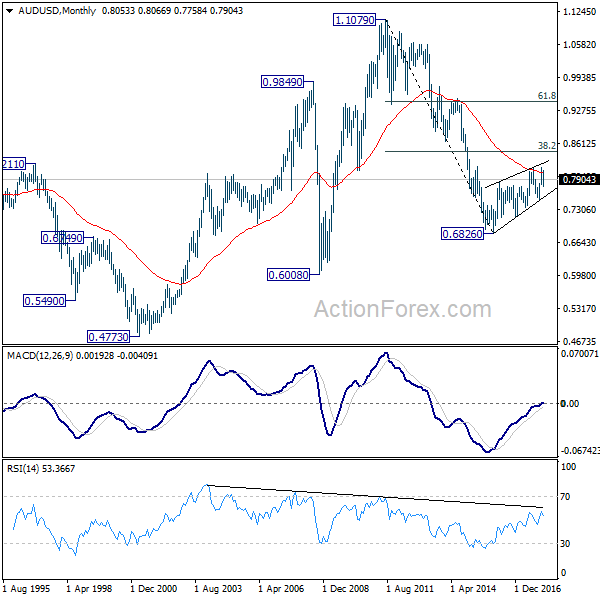
AUD/USD rebounded strongly to 0.7988 last week but lost momentum since then. Initial bias is neutral this week first. On the upside, above 0.7988 will extend the rebound to retest 0.8135. On the downside, below 0.7758 will resume the fall from 0.8135 and target 0.7500 key near term support. At this point, there is no strong case for a range breakout yet and 0.7500/8135 could hold for a while.
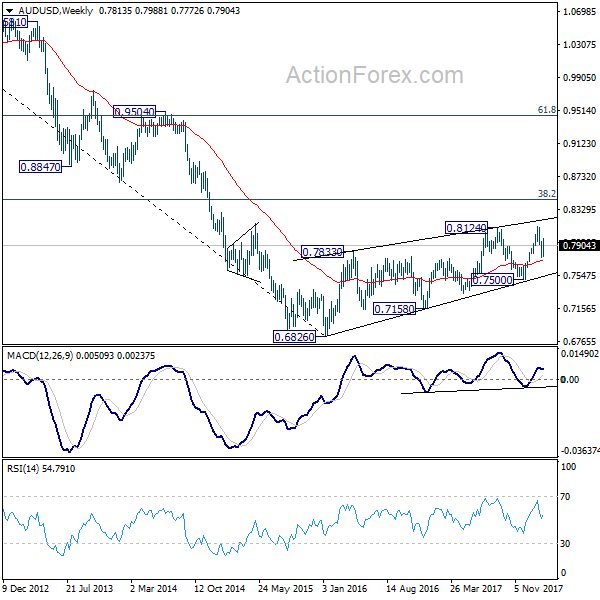
In the bigger picture, medium term rebound from 0.6826 is seen as a corrective move. It might still extend higher but we'd expect strong resistance from 38.2% retracement of 1.1079 to 0.6826 at 0.8451 to limit upside to bring long term down trend resumption. On the downside, break of 0.7500 support will now be an important signal that such corrective rebound is completed.
In the longer term picture, 0.6826 is seen as a long term bottom. Rise from there could either reverse the down trend from 1.1079, or just develop into a corrective pattern. At this point, we're favoring the latter. And, as long as 38.2% retracement of 1.1079 to 0.6826 at 0.8451 holds, we'd anticipate another decline through 0.6826 at a later stage. But strong support should be seen between 0.4773 (2001 low) and 0.6008 (2008 low).
USD/CAD Weekly Outlook
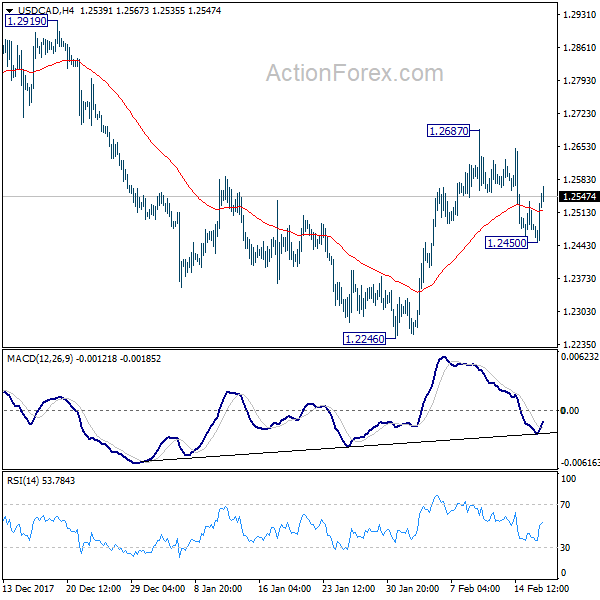
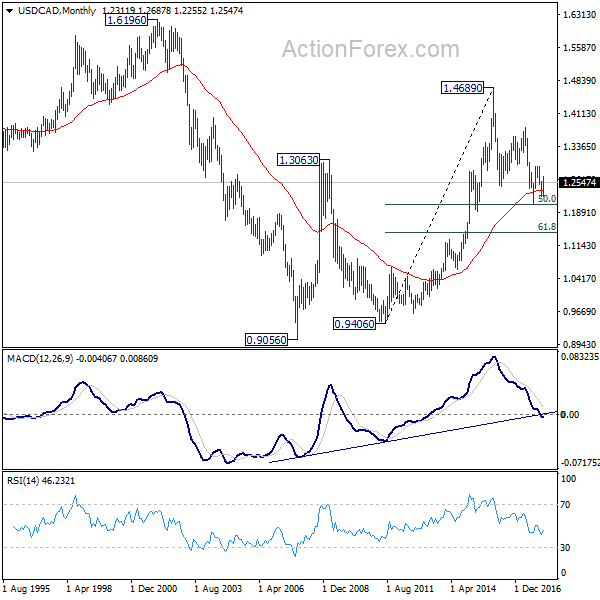
USD/CAD dipped to 1.2450 last week but quickly recovered. Initial bias is neutral this week first. On the upside, above 1.2687 will extend the rebound from 1.2246 to retest 1.2919 key near term resistance. On the downside, below 1.2450 will target 1.2246 first. Break there will extend the fall from 1.2919 and target 1.2061 keys support level.
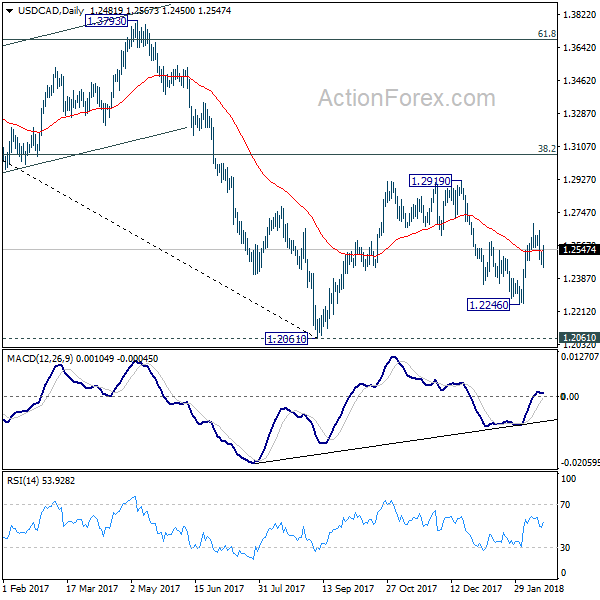
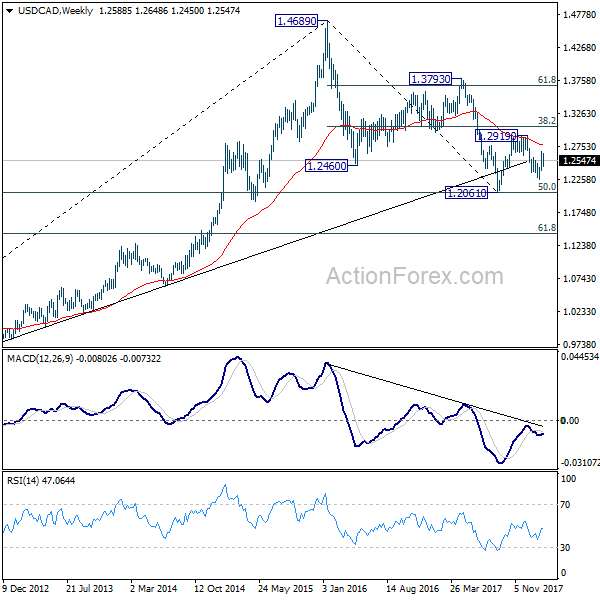
In the bigger picture, the rebound from 1.2246 is mixing up the medium term outlook. Nonetheless, USD/CAD is staying below falling 55 week EMA, hence, the bearish case is in favor. That is, fall from 1.4689 is not completed yet. Sustained break of 1.2061 key support will carry larger bearish implication and target 61.8% retracement of 0.9406 to 1.4689 at 1.1424. However, firm break of 1.2919 will revive the case of medium term reversal and turn outlook bullish.
In the longer term picture, 50% retracement of 0.9406 (2011 low) to 1.4689 (2015 high) at 1.2048 remains a key support level to watch. As long as this level holds, we'll treat fall from 1.4689 as a correction and expect another rally through this level. However, sustained break of 1.2048 will turn favors to the case that rise from 0.9056 (2007 low) is a three wave corrective move that's completed at 1.4689. And retest of 0.9056/9406 support zone could be seen in medium to long term.
GBP/JPY Weekly Outlook
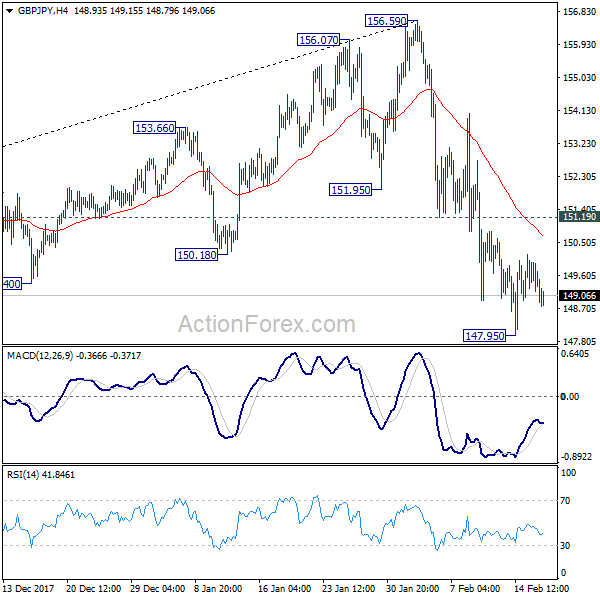
GBP/JPY's fall from 156.59 extended to 147.95 last week but formed a temporary low there and recovered. Initial bias is neutral this week first. Upside of recovery should be limited by 151.19 resistance to bring another fall. Below 147.95 will target 146.96 support next. Considering bearish divergence condition in daily MACD, firm break of 146.96 will be another sign of medium term trend reversal. On the upside, break of 151.19 will indicate short term bottoming and turn bias back to the upside for rebound.
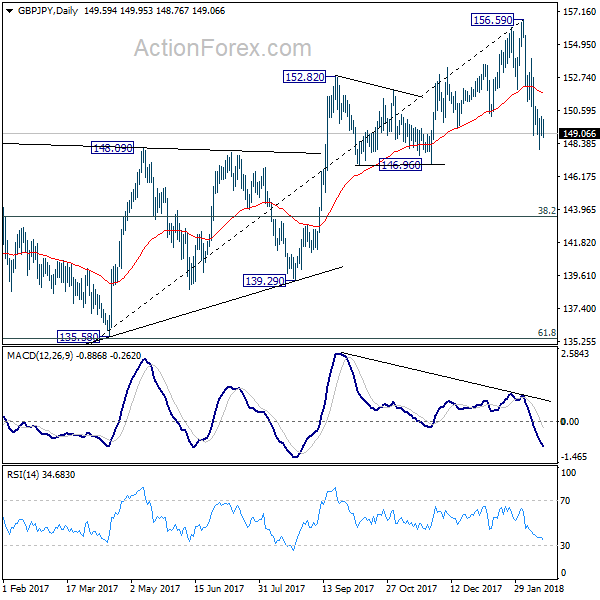
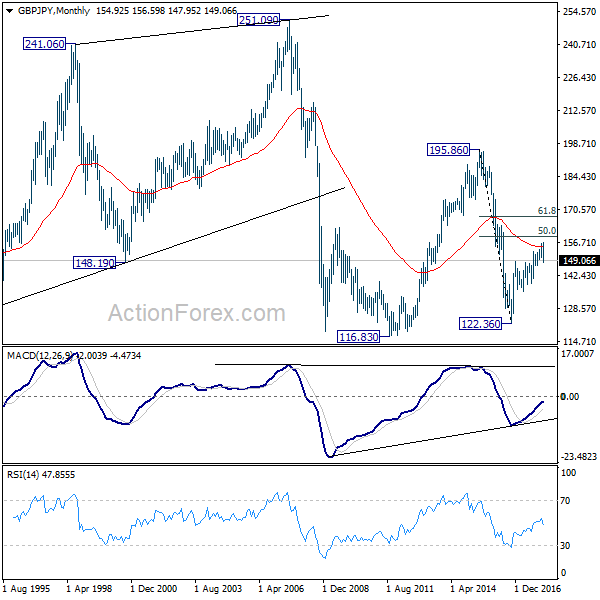
In the bigger picture, the case for medium term reversal continues to build up on loss of medium term momentum as seen in 4 hour MACD. Also, firm break of 146.96 will indicate rejection by 55 month EMA and add to that case of reversal. In that case, deeper fall would be seen to 38.2% retracement of 122.36 to 156.59 at 143.51 and then 61.8% retracement at 135.43. Meanwhile, break of 156.59 will extend the rise from 122.36 to 61.8% retracement of 195.86 to 122.36 at 167.78.
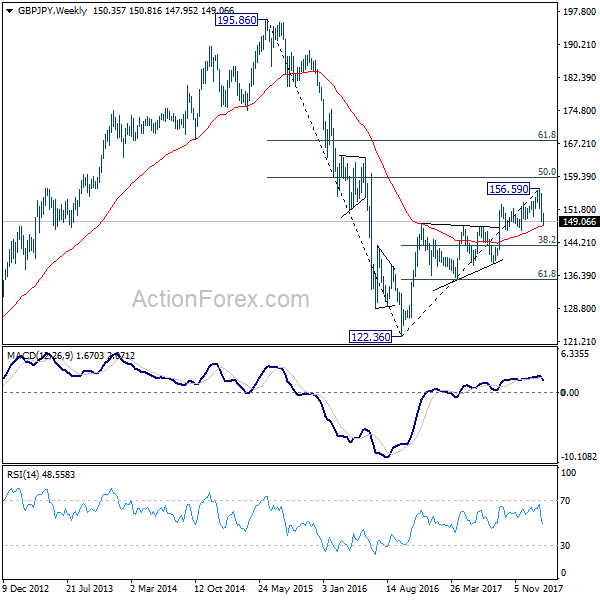
In the longer term picture, down trend from 195.86 (2015 high) has already completed at 122.36. Focus is now on 55 month EMA (now at 154.60). Firm break there will suggest that rise from 122.36 is developing into a long term move that target 195.86 again. And, price actions from 116.83 (2011 low) is indeed a sideway pattern that could last more than a decade. However, rejection from the 55 month EMA will turn focus back to 122.36 low.
EUR/JPY Weekly Outlook
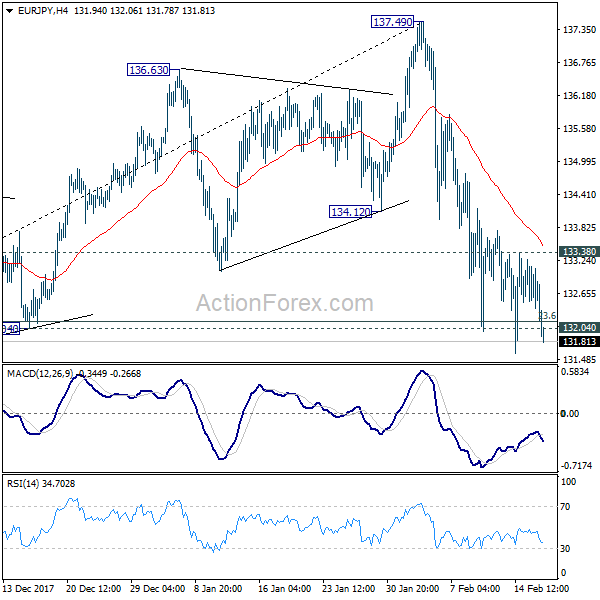
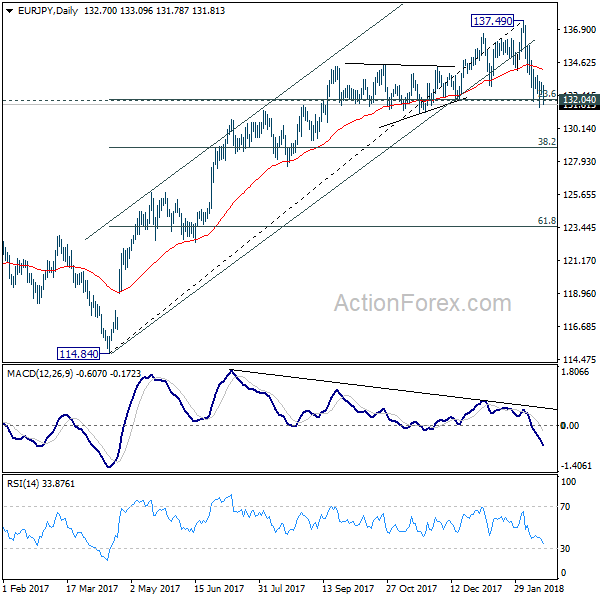
EUR/JPY's fall from 137.49 tried to extend last week but struggled to sustain below 132.04 cluster support (23.6% retracement of 114.84 to 137.49 at 132.14). Nonetheless, outlook will remain bearish this week as long as 133.38 resistance holds. As noted before sustained trading below 132.04/14 will indicate larger trend reversal on bearish divergence condition in daily MACD. In such case, deeper decline would be seen for 38.2% retracement at 128.38 first. However, rebound from 132.04 will retain near term bullishness. Break of 133.38 minor resistance will turn bias back to the upside for 137.49 again.
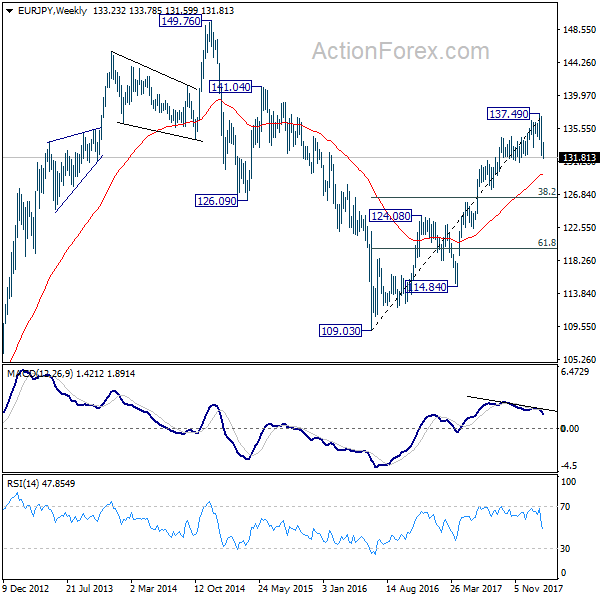
In the bigger picture, bearish divergence condition in weekly MACD indicates loss of medium term upside momentum. Sustained break of 132.04 will be the early sign of long term reversal and should bring deeper fall back to retest 124.08 key support level. Meanwhile, break of 137.49 will resume the up trend from 109.03 to 141.04/149.76 resistance zone.
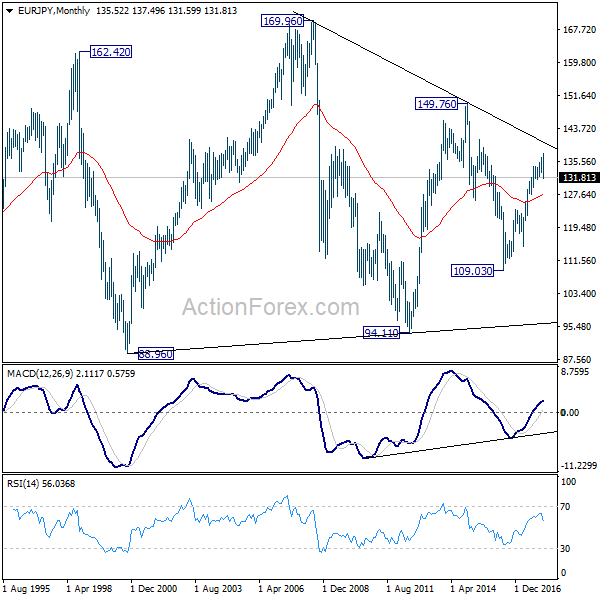
In the long term picture, at this point, EUR/JPY is staying in long term sideway pattern. established since 2000. Rise from 109.03 is seen as a leg inside the pattern. As long as 124.08 support holds, further rally is in favor in medium to long term through 149.76 high. However, break of 124.08 could extend the fall through 109.03 low instead.