Sample Category Title
EURUSD – Vulnerable Below The 1.2537 Zone
EURUSD - The pair closed higher the past week but while trades below its key resistance at 1.2537 there is risk of a correction lower. On the upside, resistance comes in at 1.2500 level with a cut through here opening the door for more upside towards the 1.2550 level. Further up, resistance lies at the 1.2600 level where a break will expose the 1.2650 level. Conversely, support lies at the 1.2400 level where a violation will aim at the 1.2350 level. A break of here will aim at the 1.2300 level. Below here will open the door for more weakness towards the 1.2250. All in all, EURUSD faces further pullback threats.
USDCHF – Halts Weakness, Targets Upside Pressure
USDCHF - With the pair halting its weakness the past week, it faces risk of a move higher in the new week. On the downside, support lies at the 0.9300 level. A turn below here will open the door for more weakness towards the 0.9250 level and then the 0.9200 level. On the upside, resistance resides at the 0.9350 level where a break will clear the way for more strength to occur towards the 0.9400 level. Further out, resistance comes in at the 0.9450 level. Above here if seen will turn attention to 0.9500. All in all, USDCHF faces further weakness medium term but with caution.
EUR/USD Weekly Outlook
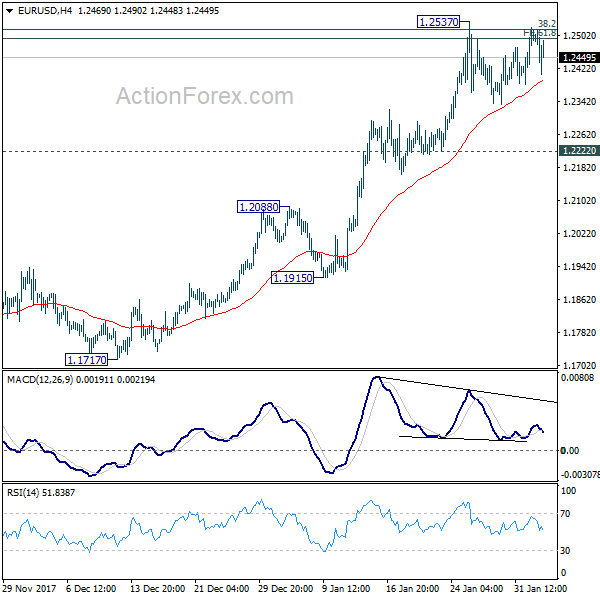
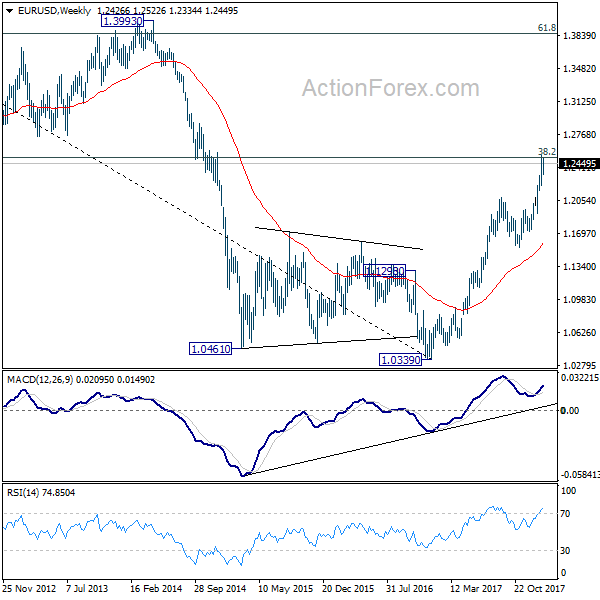
EUR/USD stayed in range below 1.2537 last week and outlook is unchanged. Initial bias remains neutral this week first. As long as 1.2222 support holds, further rise is in favor. Sustained break of 1.2494/2516 will target 100% projection of 1.0569 to 1.2091 from 1.1553 at 1.3075 next. However, break of 1.2222 will indicate rejection from 1.2494/2516, on bearish divergence condition in 4 hour MACD, and turn near term outlook bearish for 1.1915 support first.
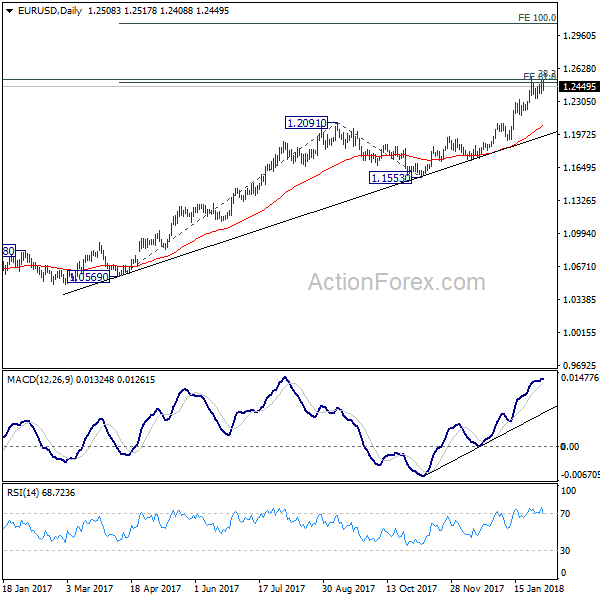
In the bigger picture, rise from 1.0339 medium term bottom is still seen as a corrective move for the moment. But key fibonacci level at 38.2% retracement of 1.6039 (2008 high) to 1.0339 (2017 low) at 1.2516 is looking vulnerable. Sustained break of 1.2516 will carry larger bullish implication and target 61.8% retracement of 1.6039 to 1.0339 at 1.3862. Nonetheless, rejection from 1.2516 will maintain long term bearish outlook and keep the case for retesting 1.0039 alive.
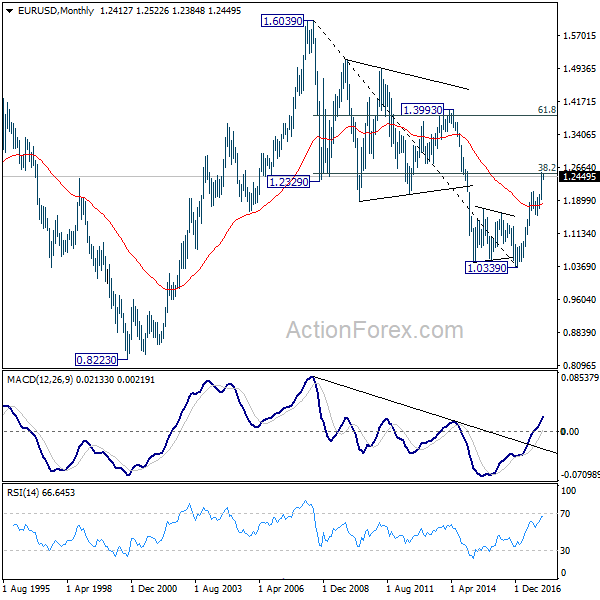
In the long term picture, 1.0339 is seen as an important bottom as the down trend from 1.6039 (2008 high) could have completed. It's still early to decide whether price action from 1.0339 is developing into a corrective or impulsive pattern. Reaction to 38.2% retracement of 1.6039 to 1.0339 at 1.2516 will give important clue to the underlying momentum.
USD/JPY Weekly Outlook
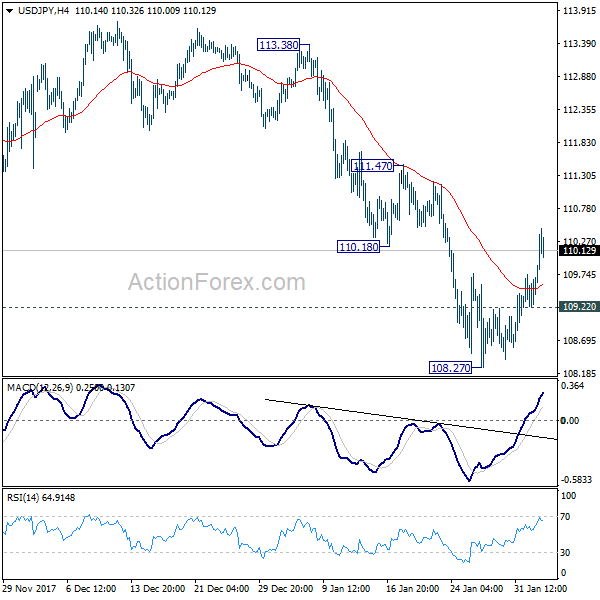
USD/JPY's strong rebound to 110.47 last week indicates short term bottoming at 108.27. Initial bias remains on the upside this week for 111.47 resistance first. Sustained break there will also have 55 day EMA (now at 111.39) firmly taken out. In such case, further rise would be seen back to 113.38/114.73 resistance zone. On the downside, however, below 109.22 minor support will turn focus back to 108.27 instead.
In the bigger picture, current development argues that the corrective pattern from 118.65 is extending. There is risk of dropping further to 61.8% retracement of 98.97 to 118.65 at 106.48. But this level should provide strong support to contain downside and bring resumption of rise from 98.97. However, sustained break of 106.48 will now likely send USD/JPY through 98.97 to resume the corrective fall from 125.85 (2015 high).
In the long term picture, the rise from 75.56 (2011 low) long term bottom to 125.85 top is viewed as an impulsive move, no change in this view. Price actions from 125.85 are seen as a corrective move which could still extend. In case of deeper fall, downside should be contained by 61.8% retracement of 75.56 to 125.85 at 94.77. Up trend from 75.56 is expected to resume at a later stage for above 135.20/147.68 resistance zone.


GBP/USD Weekly Outlook
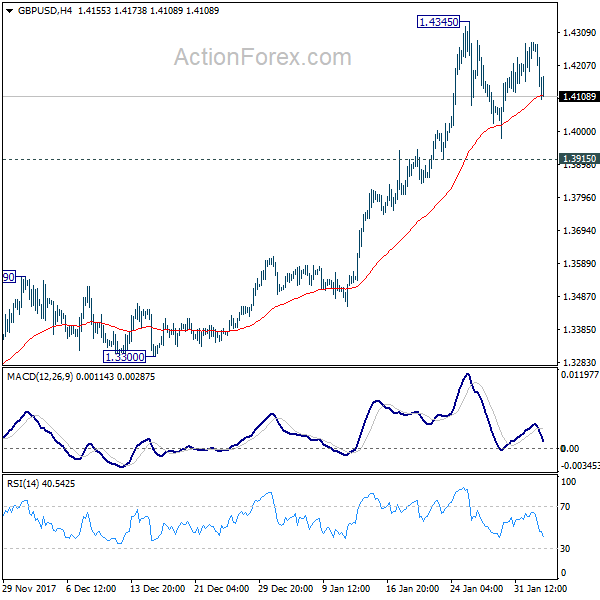
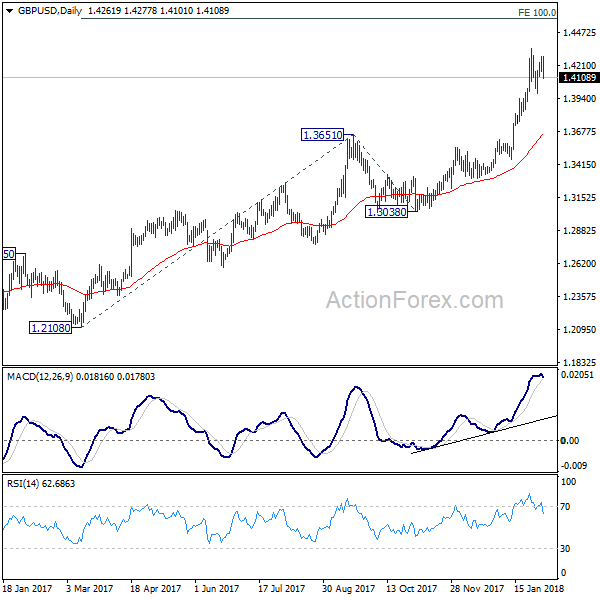
GBP/USD stayed in consolidation below 1.4345 last week and outlook is unchanged. Initial bias remains neutral this week first. In case of another fall, downside should be contained by 1.3915 support to bring rally resumption. On the upside, break of 1.4345 will resume medium term up trend to 100% projection of 1.2108 to 1.3651 from 1.3038 at 1.4581 next. However, break of 1.3915 will argue that, at least, deeper pull back in underway to 1.3651 resistance turned support.
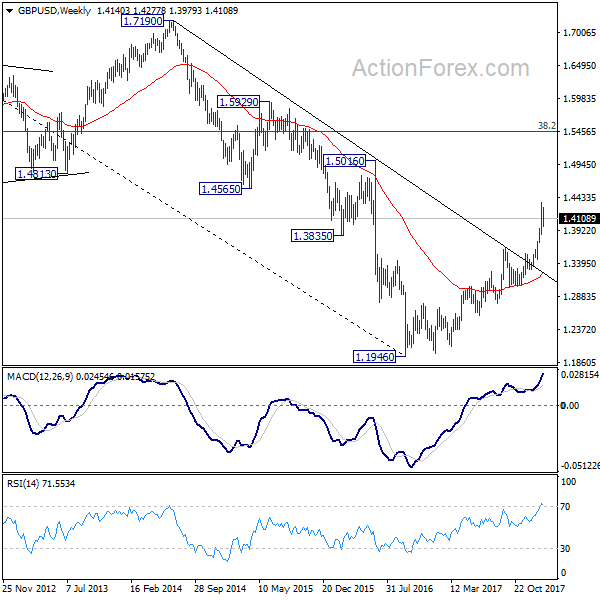
In the bigger picture, sustained break of 1.3835 key resistance level indicates that rebound from 1.1946 is at least correcting the long term down from from 2007 high at 2.1161. Further rise should now be seen back to 38.2% retracement of 2.1161 (2007 high) to 1.1946 (2016 low) at 1.5466. Medium term outlook will stay bullish as long as 1.3038 support holds, in case of pull back.
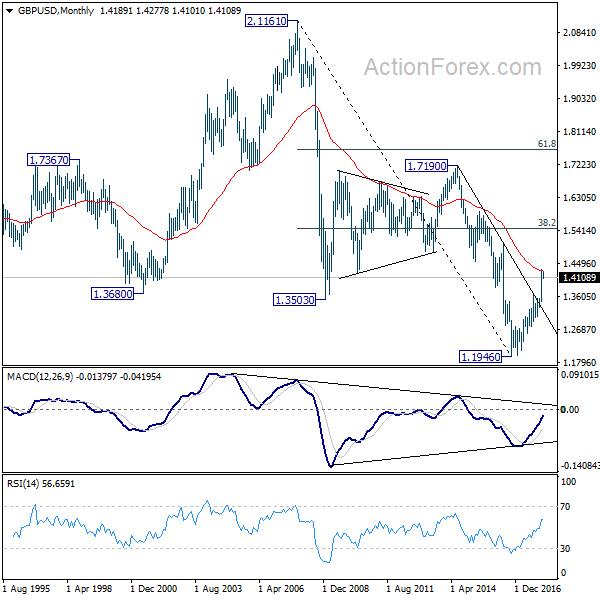
In the longer term picture, rise from 1.1946 should at least be correcting the whole long term down trend form 2.1161 and should target 38.2% retracement of 2.1161 (2007 high) to 1.1946 (2016 low) at 1.5466. It too early to tell if it's developing into a long term up trend. We'll monitor the upside momentum and reaction to 1.5466 to decide later.
USD/CHF Weekly Outlook
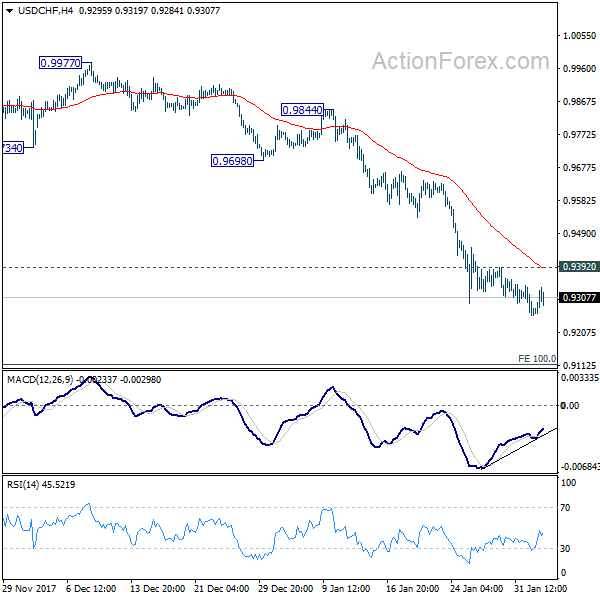
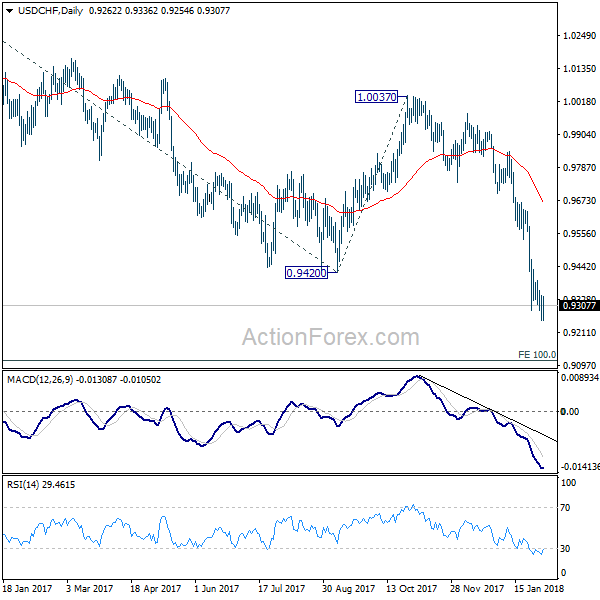
USD/CHF's decline extended to 0.9254 last week. Downside momentum is diminishing as seen in 4 hour MACD. But as long as 0.9392 resistance holds, deeper fall is expected. Current fall from 1.0037 would target next fibonacci projection level at 0.9115. On the upside, break of 0.9392 minor resistance, however, will indicate short term bottoming and bring stronger rebound.
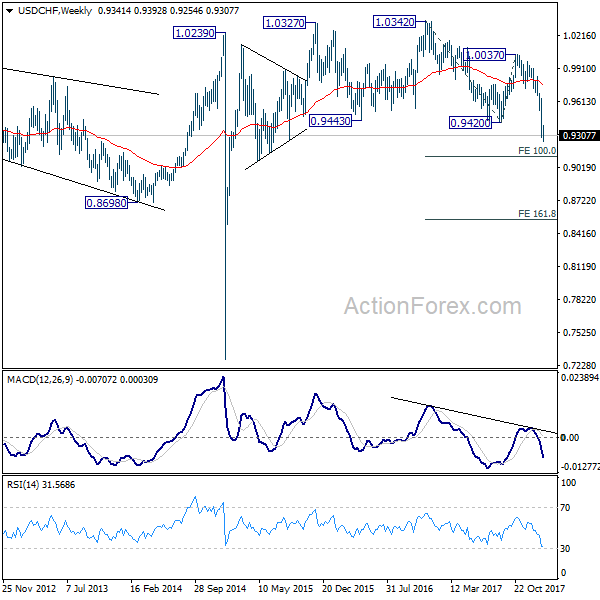
In the bigger picture, the strong break of 0.9420 support suggests that fall from 1.0342 is developing into a medium term down trend. Deeper fall should be seen to 100% projection of 1.0342 to 0.9420 from 1.0037 at 0.9115. Break will target 161.8% projection at 0.8545. In any case, break of 0.9640 resistance is needed to be the first sign of medium term bottoming. Otherwise, outlook will stay bearish even in case of strong rebound.
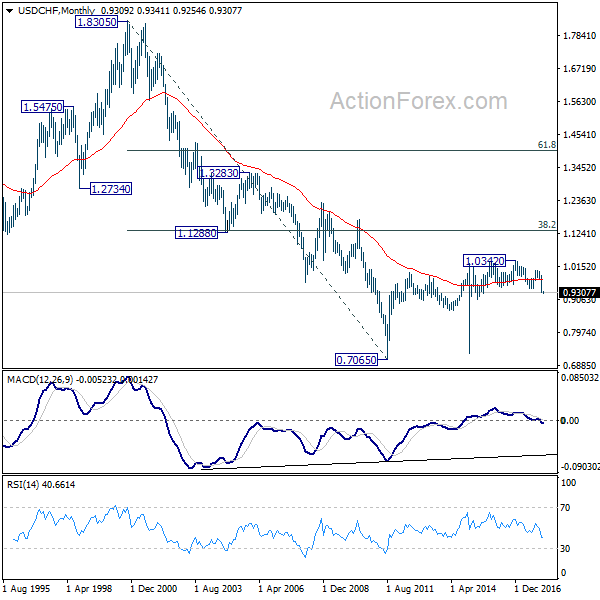
In the long term picture, the strong break of 0.9420 support and downside acceleration turns the long term outlook rather bearish. Corrective rebound from 0.7065 (2011 low) could have already completed at 1.0342. 0.8698 support will be a key level to watch. Sustained break there could bring retest of 0.7065.
AUD/USD Weekly Outlook
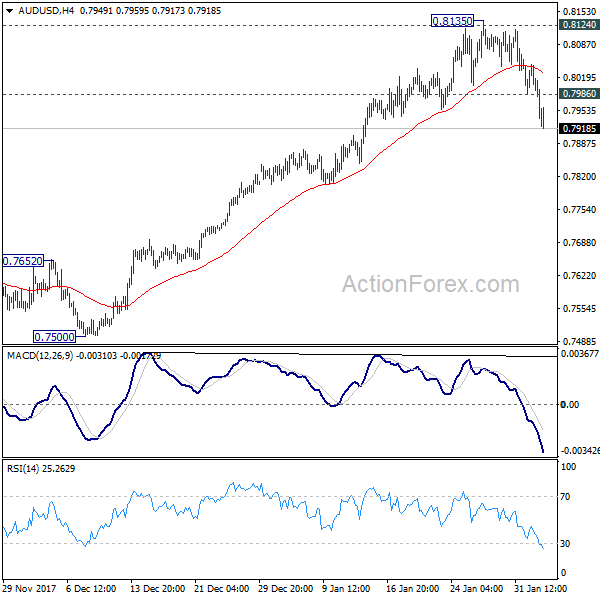
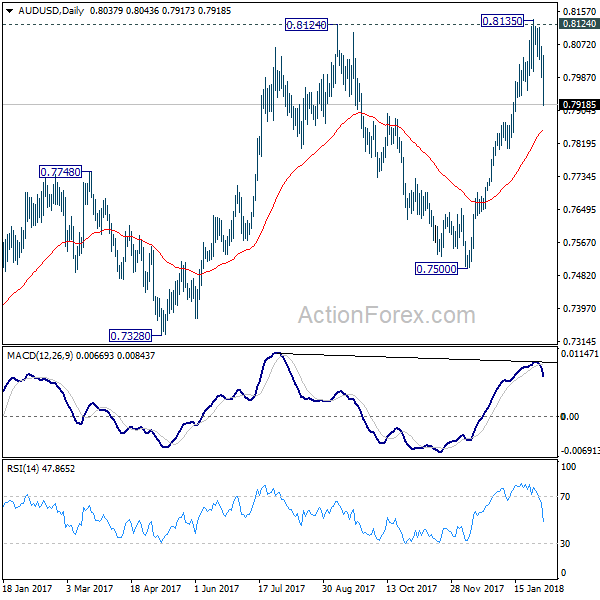
AUD/USD's sharp decline last week confirmed short term topping at 0.8135, after being rejected by 0.8124 resistance. Initial bias remains on the downside this week for 55 day EMA (now at 0.7851). Sustained break there will argue that rise from 0.7500 has already finished and will bring deeper fall to retest this support level. On the upside, above 0.7986 minor resistance will turn intraday bias neutral first. But recovery will likely be limited below 0.8135 resistance at first attempt.
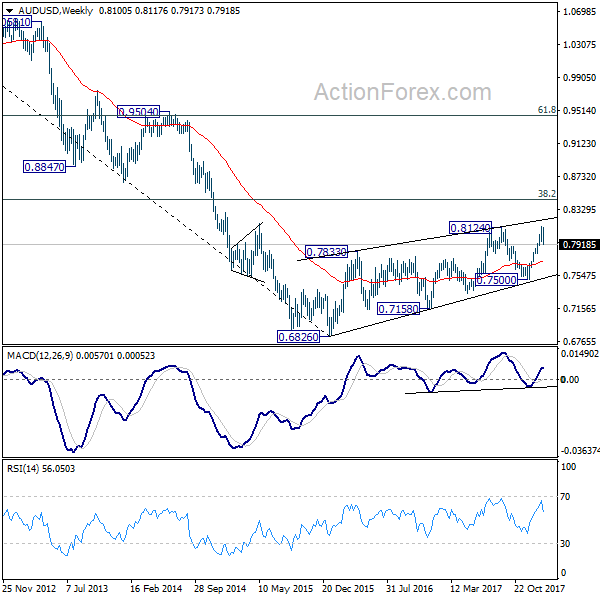
In the bigger picture, medium term rebound from 0.6826 is seen as a corrective move. It might still extend higher but we'd expect strong resistance from 38.2% retracement of 1.1079 to 0.6826 at 0.8451 to limit upside to bring long term down trend resumption. On the downside, break of 0.7500 support will now be an important signal that such corrective rebound is completed.
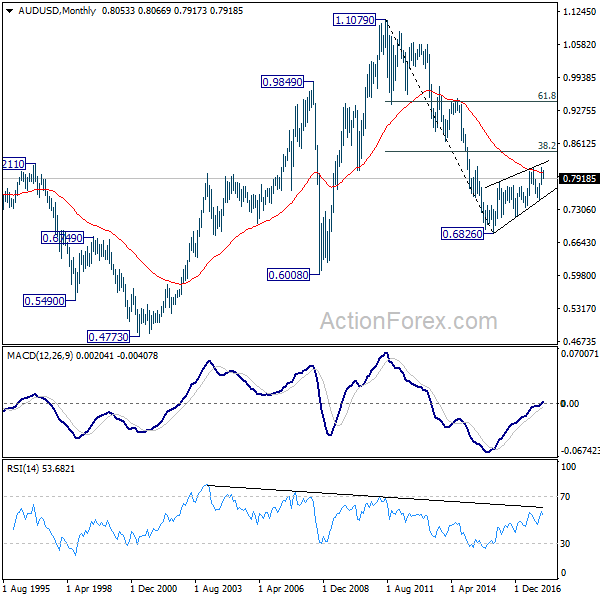
In the longer term picture, 0.6826 is seen as a long term bottom. Rise from there could either reverse the down trend from 1.1079, or just develop into a corrective pattern. At this point, we're favoring the latter. And, as long as 38.2% retracement of 1.1079 to 0.6826 at 0.8451 holds, we'd anticipate another decline through 0.6826 at a later stage. But strong support should be seen between 0.4773 (2001 low) and 0.6008 (2008 low).
USD/CAD Weekly Outlook
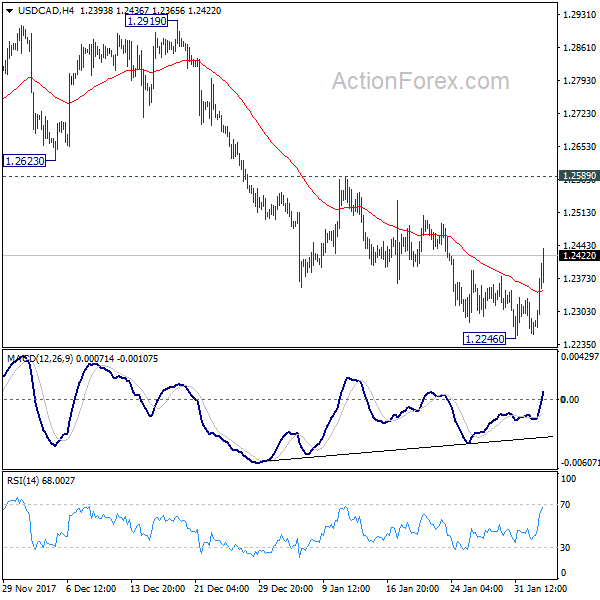
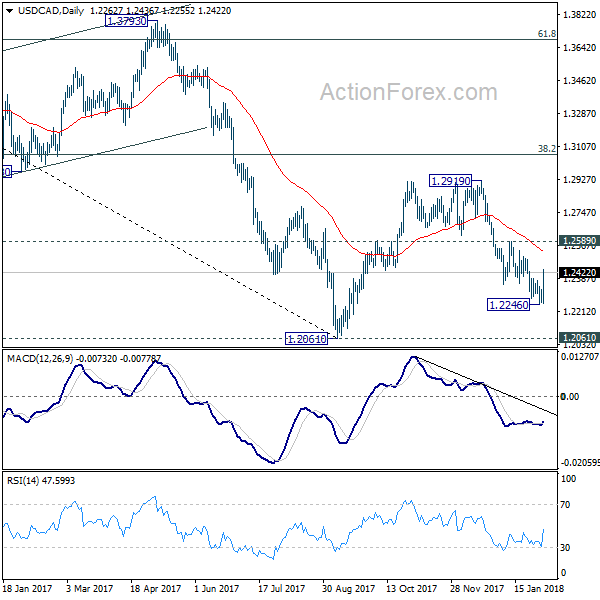
Despite dipping to 1.2246 last week, subsequent rebound suggests that a short term bottom is formed, on bullish convergence condition in 4 hour MACD. Initial bias is back on the upside this week for 1.2589 resistance first. Break there will indicate that pull back from 1.2919 has completed and and would bring retest of this resistance. On the downside, below 1.2246 will resume the fall from 1.2919 to retest 1.2061 key support.
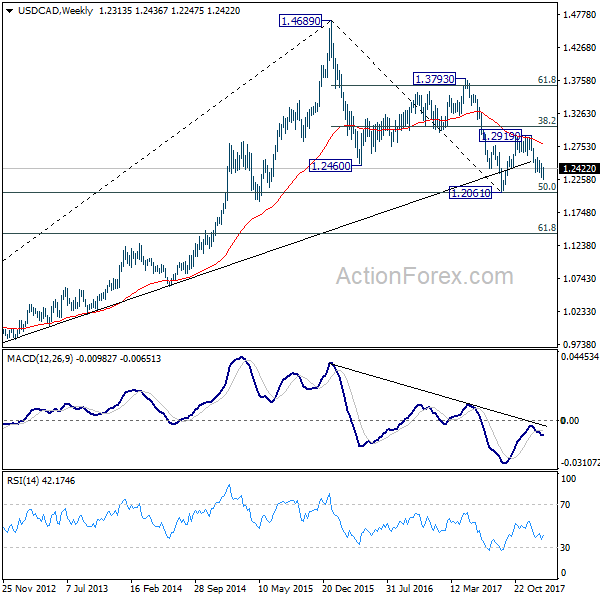
In the bigger picture, rebound from 1.2061 is likely completed completed at 1.2919, rejected by 55 week EMA and kept below 38.2% retracement of 1.4689 to 1.2061 at 1.3065. The development also suggests that long term fall from 1.4689 is not completed yet. Decisive break of 1.2061 low will target 61.8% retracement of 0.9406 to 1.4689 at 1.1424. This will now be the favored case as long as 1.2919 resistance holds.
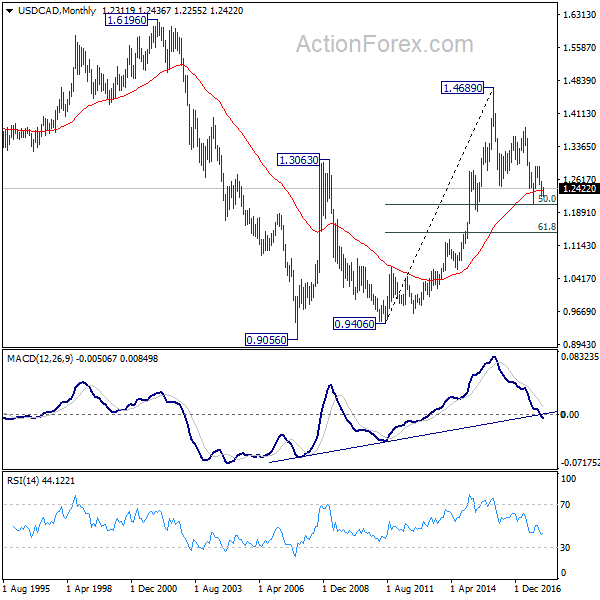
In the longer term picture, 50% retracement of 0.9406 (2011 low) to 1.4689 (2015 high) at 1.2048 remains a key support level to watch. As long as this level holds, we'll treat fall from 1.4689 as a correction and expect another rally through this level. However, sustained break of 1.2048 will turn favors to the case that rise from 0.9056 (2007 low) is a three wave corrective move that's completed at 1.4689. And retest of 0.9056/9406 support zone could be seen in medium to long term.
GBP/JPY Weekly Outlook
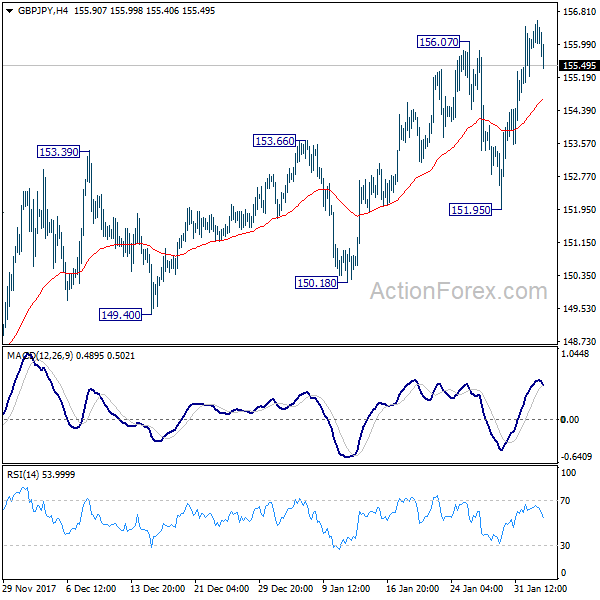
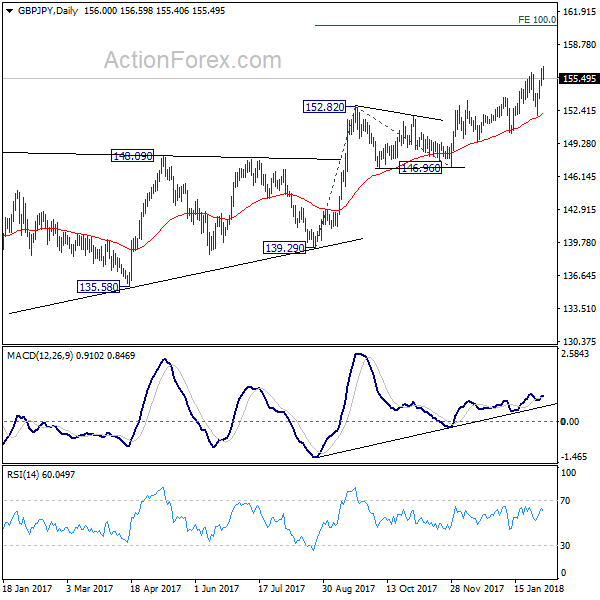
GBP/JPY was well supported by rising 55 day EMA. And recent rise resumed last week by hitting as high as 156.59. Near term outlook will remain bullish as long as 151.95 support holds. Next target will be 100% projection of 139.29 to 152.82 from 146.96 at 160.49.
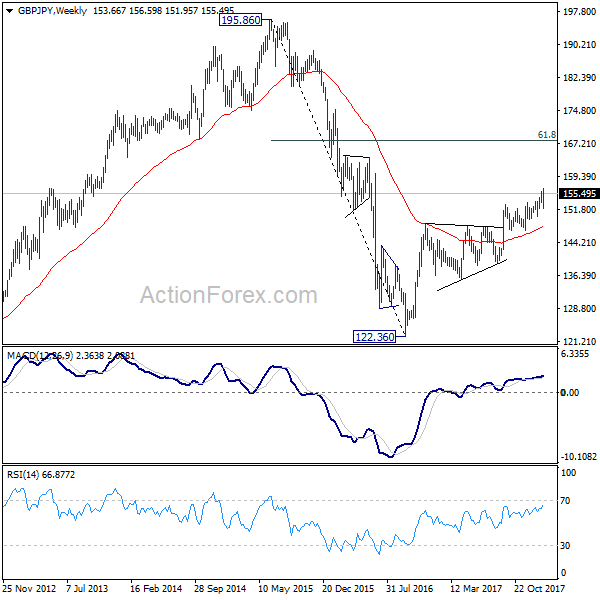
In the bigger picture, as long as 146.96 key support holds, medium term outlook remains bullish. Rise from 122.36 is in favor to extend to 61.8% retracement of 195.86 to 122.36 at 167.78. However, break of 146.96 support will indicate trend reversal. And there would be prospect of retesting 122.36 in that case.
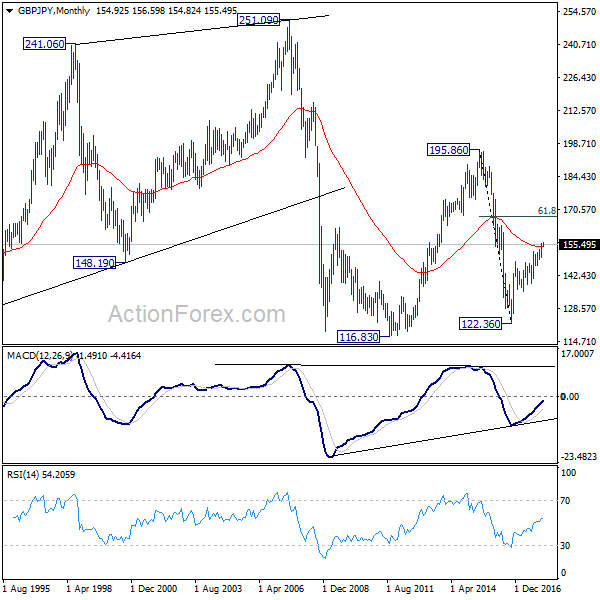
In the longer term picture, down trend from 195.86 (2015 high) has already completed at 122.36. Focus is now on 55 month EMA (now at 154.75). Firm break there will suggest that rise from 122.36 is developing into a long term move that target 195.86 again. And, price actions from 116.83 (2011 low) is indeed a sideway pattern that could last more than a decade.
EUR/JPY Weekly Outlook
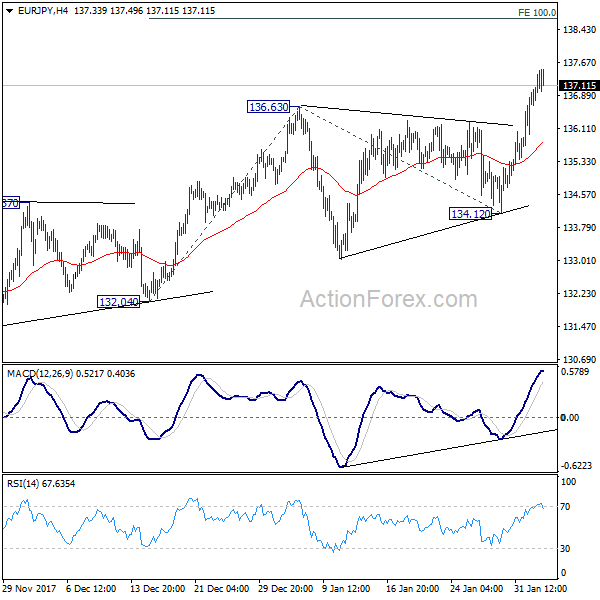
EUR/JPY surged to as high as 137.49 last week. Break of 136.63 indicates up trend resumption. Initial bias stays on the upside this week for 100% projection of 132.04 to 136.63 from 134.12 at 138.71 first. On the downside, break of 134.12 support is needed to indicate near term reversal. Otherwise, outlook will remain bullish in case of retreat.
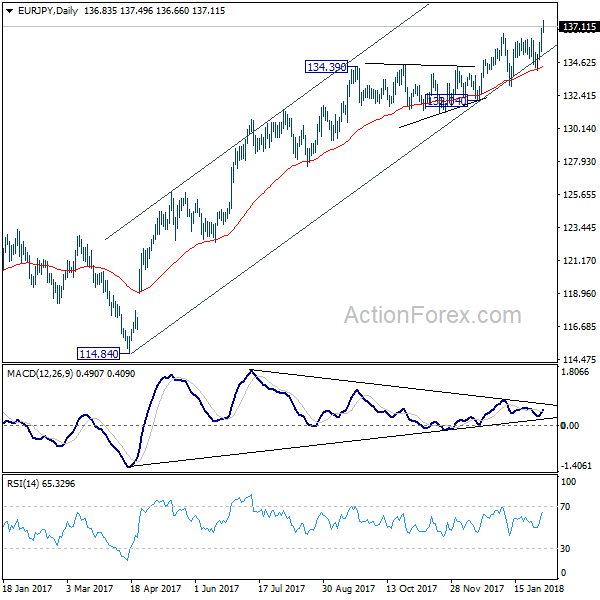
In the bigger picture, medium term rise from 109.03 (2016 low) is seen as at the same degree as the down trend from 149.76 (2014 high) to 109.03 (2016 low). It should be targeting 141.04/149.76 resistance zone. On the downside, break of 132.04 support is needed to indicate medium term reversal. Otherwise, outlook will stay bullish in case of deep pull back.
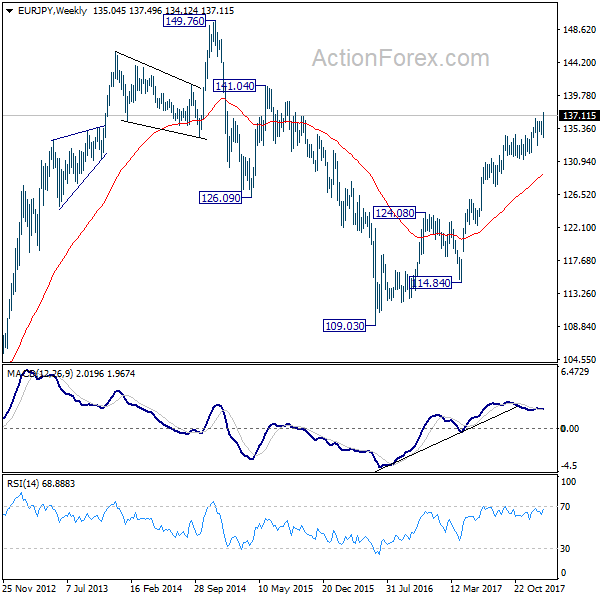
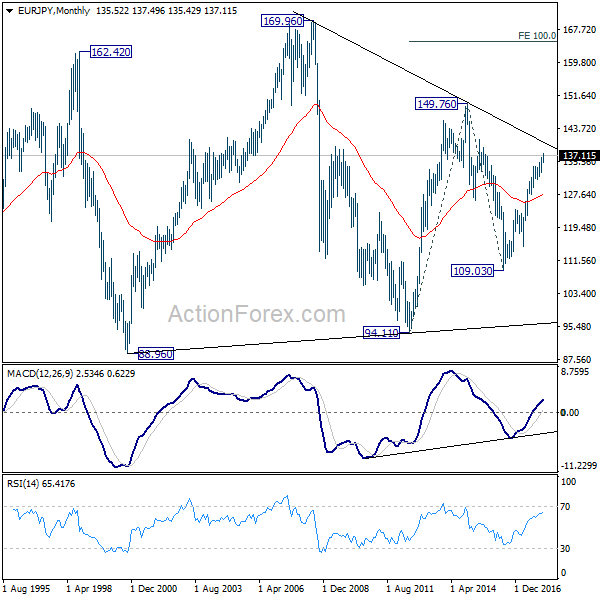
In the long term picture, at this point, there is no clear indication that rise from 109.03 is resuming that from 94.11 (2012 low). Hence, we'd be cautious on topping below 149.76 to extend range trading. Nonetheless, firm break of 149.76 will indicates strong underlying buying. In such case, EUR/JPY will target 100% projection of 94.11 to 149.76 from 109.03 at 164.68.