Sample Category Title
Bitcoin Unable To Break $10,000, Is Upward The Only Way!
Is it time for Bitcoin to reverse momentum?
After recovering during the weekend, the price of Bitcoin has reversed momentum since Monday, sliding 6.10% from $11,770 to $11,040. Following early January dell-off – and just like Bitcoin - the entire crypto-market has been trading sideways since mid-January. However, performances of alt-coins has been quite heterogeneous as certain projects are expected to release major update or/and building expectations for major announcement in the first quarter (Populous, OmiseGo NEO/GAS or Walton); while for others, price have kept grinding lower as no major update are expected in the coming months (e.g. LINK). Wanchain, that is seeking to create a new distributed financial structure, which would allow among other features to allow cross-chain smart contracts, is expected to be ready for trading soon. Since yesterday, ICO investors have the possibiblity to swap their ERC20 tokens to Wanchain Mainnet Wancoins. Therefore, this is just a matter of hours (or maybe a couple of days) before Wancoins is available for trading. It is going to rise fast!
Bitcoin has suffered from bearish bets from speculators, with leveraged funds being net short Bitcoin most since the introduction of Bitcoin futures in December last year. However, according to the last CFTC report released last Friday, the wind is turning slowly as leveraged funds are now net long Bitcoin by 624 contracts. In addition, the price of Bitcoin has been unable to break the $10,000 threshold in spite of numerous attempts. After two weeks of consolidation, we believe that the bear market is over that the momentum will reverse in the coming days.
US GDP Growth disappoints
Friday’s Preliminary 4Q 2017 US Gross Domestic Product publication is deceiving and lies below expectations at 2.60% (consensus: 3.0%; real GDP at 2.30% and +1.50% in 2016) while December core PCE Y/Y stands at 1.50% (3Q: 1.35%), signaling a relatively weak performance, lower than 3Q GDP of 3.20%. With a December Personal Income M/M increase of 0.40% (0.30% consensus) and Household Real Consumption of 3.80% (consensus: 3.70%; fastest pace since 2014 while savings fell at 2.40%, lowest since September 2005) confirms that US consumption steered expansion during the last quarter of the year, also supported by Trump’s tax reform outlook and US global market optimism in the stock market. However, the drawback of this consumption boost is the increasing import rate (November 30th 2017 Y/Y: 8.40% and October 31st 2017 Y/Y: 7.0%) that underscores annual GDP.
Weakening USD (USD/EUR -2.38%, USD/GBP: -3.48%, USD/JPY: -3.09% and USD/CHF: -4.09%) might however be a driver to the 3% GDP growth target of Trump’s administration. Due to almost full employment conditions within the US economy (US December Seasonally Adjusted Unemployment rate at 4.10%, its lowest rate since December 31st 2000), effective corporate tax reform contribution (from 35% to 21%) to GDP growth remains limited for further growth. Government total expenditures also largely contributed to actual growth within the US economy, accounting for USD 6’586.71 billion (+1.027% increase from Q3 to Q4 2017) and remains at historical highs.
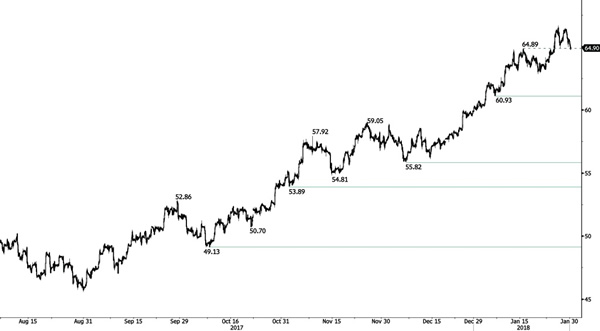
CRUDE OIL Slight Decrease
Crude oil is slightly declining, though maintained above 64. Strong support is given at 60.93 (05/01/2018 low). Expected to keep increasing as demand remains strong.
In the long-term, crude oil has recovered after its sharp decline last year. However, we consider that further weakness is very likely. For the time being the pair lies in an upside trend since June 2017. Support lies at 42.20 (16/11/2016) while resistance point is located at 77.83 (20/11/2014). Crude oil is trading largely above its 200 DMA.
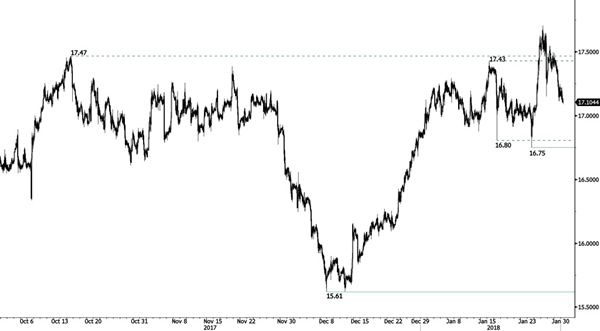
SILVER Bearish Retracement
Silver continues its decline but remains above 17.16. Hourly support is at 16.75. The short-term technical structure remains positive as long as silver remains above 17. Hourly resistance lies at 18.21 (08/09/2017 high).
In the long-term, the trend remains negative/ flattish. Further downside is very likely. The pair is trading slightly above its 200 DMA. Resistance is located at 21.58 (10/07/2014 high). Strong support can be found at 11.75 (20/04/2009).
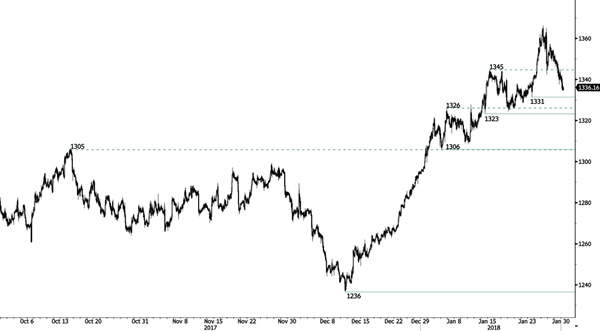
GOLD Declining
Gold is declining after strong increase initiated in 12/12/2017. Hourly support is at 1'331 (23/01/2018 low) while additional support is given at 1'323 (12/01/2018 low). Expected to show short-term upside moves.
In the long-term, the technical structure suggests that there is a growing upside momentum. A break of 1'392 (17/03/2014) is required to confirm it. A major support can be found at 1'045 (05/02/2010 low).
BITCOIN Neutral
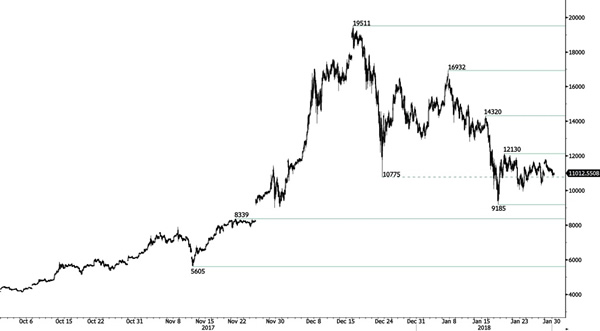
Bitcoin is trading sideways. Hourly support is at 9'185 (17/01/2018 low) while resistance is located at 12'130 (18/01/2018 high). The short-term technical structure might be suggesting potential breakout.
In the long-term, the digital currency has had an exponential growth but also presented important downturns. There is decent likelihood that the currency could stabilize between 9'000 - 12'000 in 2018. Bitcoin is trading far above its 200 DMA (5K+ gap).
EUR/CHF Further Decline
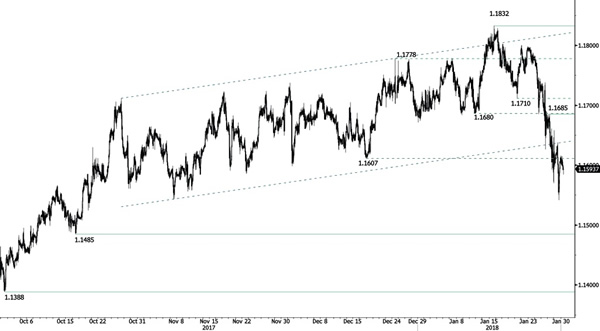
EUR/CHF's selling pressure increases. Hourly resistance given at 1.1685 (26/01/2018 high) is getting distanced. Expected to show further short-term downside moves.
In the longer term, the technical structure has reversed. Strong resistance is given at 1.20 (level before the unpeg). Yet, the ECB's slowing QE program is likely to cause buying pressures on the euro, which should weigh in favour of the EUR/CHF. Supports can be found at 1.0184 (28/01/2015 low) and 1.0082 (27/01/2015 low).
EUR/GBP Overshooting
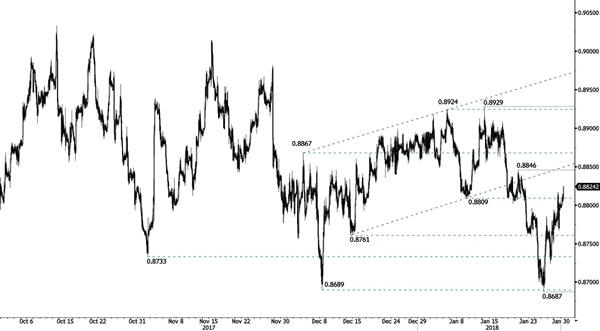
EUR/GBP bullish momentum keeps rising. The pair approaches resistance at 0.8846 (19/01/2018 high). Hourly support is given at 0.8687 (25/01/2018 low). The technical suggests further short-term strength.
In the long-term, the pair has largely recovered from lows in 2015. The technical structure suggests an upside momentum. The pair is trading below the range of its 200 DMA. Strong resistance can be found at 0.9500 (psychological level).
AUD/USD Bearish Trend
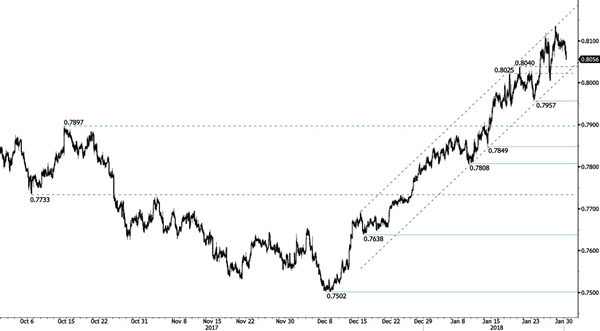
AUD/USD's upside pressure is slowed. Support stands at 0.7957 (23/01/2018 low). The road is wide open for further upside moves.
In the long-term, the trend is turning positive. Key support stands at 0.6009 (31/10/2008 low). A break of the key resistance at 0.8164 (14/05/2015 high) is needed to invalidate our long-term bearish view (drawing near).
USD/CAD Upturn
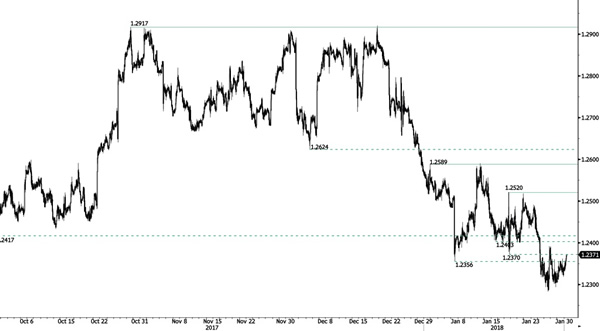
USD/CAD is weakening but gives signs of short-term slight increase. Hourly resistance is given at 1.2520 (17/01/2018 high) while further resistance given at 1.2589 (01/01/2018) is momentarily out of reach. The technical structure indicates that additional weakness is achievable.
In the longer term, the pair is trading between resistance point at 1.3805 (05/05/2017 high) and support at 1.2128 (18/06/2015 low). Strong resistance is given at 1.4690 (22/01/2016 high). The pair is likely to head lower. The pairs is trading below 200 DMA.
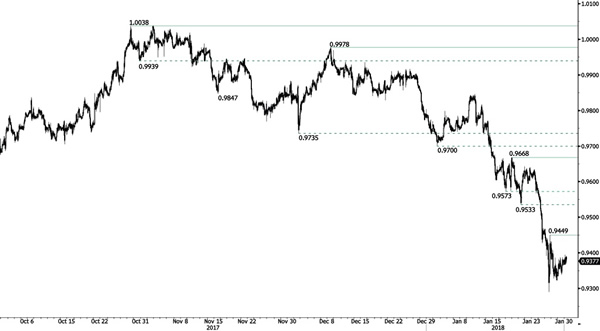
USD/CHF Decreasing
USD/CHF is trading mixed. The technical structure indicates that further weakness is likely. Hourly resistance is at 0.9449 (25/01/2018 high). Expected to show further short-term downside move.
In the long-term, the pair is still trading in range since 2011 despite some turmoil when the SNB unpegged the CHF. Key support can be found at 0.9072 (07/05/2015 low). The technical structure favours nonetheless a long term bullish bias since the unpeg in January 2015.