Sample Category Title
WTI OIL – Deeper Pullback Could Extend to Key $62.50 Fibo Support; US Oil Inventories Reports in Focus
WTI oil price stays in red for the second day and extends pullback, probing through initial support provided by rising 10SMA at $64.67.
Oil price was pressured by rising US shale oil output which weighs on OPEC-led efforts to drain oil market from excess supplies and boost oil prices.
Bearish divergence on daily indicators (RSI/MACD/slow stochastic) was negative signal with RSI and slow stochastic heading south after reversing from overbought territory and showing plenty of room downside.
Close below 10SMA today will be next bearish signal as weekly studies are also overbought and warn of correction.
Bears focus next supports at $64.08 (Fibo 23.6% of %55.81/$66.64 rally) and $63.88 (rising 20SMA), with further easing to pressure pivotal support at $62.50 (Fibo 38.2% of $55.81/$66.64). Correction should ideally reverse here to keep underlying bulls intact for fresh attempts higher as prevailing bullish sentiment keeps oil prices supported.
Near-term focus turns towards releases of US weekly crude stocks (API report is due late Tuesday) and EIA report which will be released on Wednesday.
Traders are looking for data to estimate the strength of demand for oil in the US, world's largest energy consumer, after recent data showed heathy demand which resulted in 10 straight weeks of draws in US crude inventories.
Res: 64.67; 65.54; 66.64; 66.75
Sup: 64.08; 63.88; 62.83; 62.50

CADJPY Approaches Ascending Trend Line; Bearish Correction in Progress
CADJPY remains under strong pressure after the pullback on the 89.60 resistance level on January 17. The pair plummeted towards the ascending trend line, which has been holding since September and dropped below the two-short-term simple moving averages, 20 and 40.
Looking at the daily timeframe, technical indicators are holding below their neutral levels. The MACD oscillator slipped below its trigger line in the bullish area, however, the RSI indicator is pointing to the downside in the negative territory.
If price action drops below the 23.6% Fibonacci retracement level of the last up-leg at 87.65 with the low of 74.80 and the high of 91.60, it could open the way for the next immediate support area 86.70 – 87.20. Clearing this key level would see additional losses towards the 38.2% Fibonacci mark, which stands near the 85.40 support barrier.
Upsides moves are likely to find resistance at the 89.60 obstacle. Rising above this area would help to endorse the focus to the upside towards the 4-month high of 91.60.
World Shares Tumble, Dollar Struggles to Fight Back
Global equity bulls failed to make an appearance during Tuesday's trading session as higher U.S. bond yields and caution ahead of the Federal Reserve meeting weighed heavily on sentiment.
World shares were under renewed selling pressure today with Asian shares tumbling lower during early trade, following Wall Street's steep declines overnight. In Europe, equities tumbled amid the lack of appetite for risk. With Wall Street suffering its largest drop in more than four months on Monday, U.S. stocks could remain pressured by the negative sentiment this afternoon.
Dollar remains weak and vulnerable
Rising U.S. bond yields have offered minimal support in helping the Dollar nurse its deep and painful wounds today. The Dollar's depressed price action suggests that uncertainty continues to mount ahead of President Donald Trump's state of Union address on Tuesday evening. While the speech itself may not be a market shaker, there could be fireworks and Dollar volatility if Donald Trump goes off-script.
Taking a look at the technical picture, the Dollar Index remains heavily bearish on the daily charts. A decisive breakdown and daily close below 89.00 could invite a further decline towards 88.50 and 88.00, respectively.
Sterling quivers on Brexit jitters
Sterling was pounded by investors on Tuesday morning following the release of leaked government Brexit paper which suggested that the U.K. economy could be negatively impacted by Brexit.
Although the British Pound later rebounded from its weekly low against the Dollar, this has nothing to do with a change of bias towards Sterling, but Dollar weakness. With Sterling gripped by Brexit jitters and political drama at home, the GBPUSD's upside could face some headwinds down the road. While Sterling bulls may be commended on the ability to rely on Dollar weakness to elevate prices higher, the question is for how long?
Focusing on the technical perspective, the GBPUSD fulfills the prerequisites of a bullish trend on the daily charts as there have been consistently higher highs and higher lows. While ongoing Dollar weakness could elevate prices back towards 1.4230, renewed Brexit jitters may inspire bears to attack 1.4000 and 1.3850, respectively.
Commodity spotlight - Gold
Gold bulls received inspiration in the form of Dollar weakness during Tuesday's trading session.
Focusing purely on the technical picture, the yellow metal remains bullish on the daily and weekly charts. There is a suspicion that a new higher low could be created around the $1335 level and such could provide a platform for bulls to push prices higher towards $1360. Alternatively, a breakdown below $1335 could encourage decline back to $1324.15.
DAX30 Bullish Railway Track Pattern at Support
The DAX30 has formed bearish head and shoulders pattern, but the price failed to break away. Precisely at W L4 support the price rejected and built the bullish railway track pattern making the Head and Shoulders possibly a fake. If the price breaks 13318 to the upside, we might see 13422 and 13492. However, if the price continues below the W L4 and the trend line at 13133 we could see a drop to W L5 -13002.
- H3 - Weekly Camarilla Pivot (Weekly Interim Resistance)
- W H4 - Weekly Camarilla Pivot (Strong Weekly Resistance)
- D H4 - Daily Camarilla Pivot (Very Strong Daily Resistance)
- D L3 - Daily Camarilla Pivot (Daily Support)
- D L4 - Daily H4 Camarilla (Very Strong Daily Support)
- PPR - Progressive Polynomial Channel
- POC - Point Of Confluence (The zone where we expect price to react aka entry zone)

USDCHF: Sees Price Reversal, Vulnerable
USDCHF: The With the pair seen reversing its Monday gains during early trading on Tuesday, further weakness is expected. On the downside, support lies at the 0.9300 level. A turn below here will open the door for more weakness towards the 0.9250 level and then the 0.9200 level. On the upside, resistance resides at the 0.9350 level where a break will clear the way for more strength to occur towards the 0.9400 level. Further out, resistance comes in at the 0.9450 level. Above here if seen will turn attention to 0.9500. All in all, USDCHF faces further weakness medium term

Canadian Dollar Trading Sideways, GDP Next
The Canadian dollar continues to show little movement this week. Currently, the pair is trading at 1.2424, down 0.12% on the day. On the release front, there are no Canadian events. In the US, Consumer Confidence is expected to rise to 123.2 points. As well, President Trump will deliver his State of the Union address before Congress. On Wednesday, there are a host of key indicators in the US, led by ADP Nonfarm Employment Change. The Federal Reserve will release a monetary policy statement, with the markets expecting the benchmark rate to remain unchanged at a range between 1.25%-1.50%.
The Federal Reserve will release a rate statement on Wednesday, the final one under Janet Yellen's tenure. It's a virtual certainty that the Fed will leaves rates unchanged this time around, although it's likely that the Fed will raise rates by a quarter-point at the March meeting. Yellen will make way for Jerome Powell, who takes over as chair in early February. Powell is expected to hold the course on monetary policy, which was marked by small, incremental interest rates in order to keep the US economy from overheating.
The markets have become accustomed to GDP releases above 3.0% in the US, so Advance GDP for Q4 was disappointing. The reading of 2.6% fell short of the estimate of 3.0%. The economy grew 2.3% in 2017, compared to 1.6% in 2016. Growth in Q4 was affected by stronger consumer spending, which led to a surge in imports. At the same time, the increase in consumer spending also boosted inflation, as the personal consumption expenditures index, which the Fed prefers to use, rose 1.9% in the fourth quarter, up from 1.3% in Q3. Meanwhile, the US manufacturing sector is booming, as durable goods orders in December hit 2.9%, crushing the estimate of 0.6%. This was the highest gain in six months, and helped make 2017 a banner year. Durable good orders increased 5.8% in 2017, the sharpest expansion since 2011.
CAC Slips as European Stock Markets Under Pressure
The CAC index has lost ground in the Tuesday session. Currently, the index is at 5493.80 down 0.50% on the day. On the release front, French Flash GDP edged up to 0.6%, beating the estimate of 0.5%. Eurozone Preliminary Flash GDP for the fourth quarter remained unchanged at 0.6%, matching the forecast. Later in the day, the eurozone releases Preliminary CPI for Q4, with the markets braced for a decline of 0.5%. As well, President Trump will deliver his State of the Union address before Congress. On Wednesday, the eurozone releases CPI Flash Estimate. In the US, the Federal Reserve will release a monetary policy statement, with the markets expecting the benchmark rate to remain unchanged at a range between 1.25%-1.50%.
Eurozone numbers for fourth quarter 2016 remain solid, led by strong German data. Eurozone Preliminary Flash GDP posted a respectable gain of 0.6%, unchanged from the Q3 release. French Flash GDP also gained 0.6% in Q4. An improved trade balance boosted the GDP release, aided by stronger exports and lower imports. On an annual basis, French GDP expanded 1.9%, substantially better than the 1.6% reading in 2016.
The euro posted strong gains last week, after US Treasury Secretary Robert Mnuchin said that the US had no problem with a weak dollar. ECB policymakers were not pleased with Mnuchin's statement, and Mario Draghi, without naming Mnuchin, said that such comments amounted to "targeting the exchange rate". Mnuchin has since backtracked, saying that his words were taken out of context and that the US has a long-term interest in a strong dollar. President Trump added that Mnuchin was misinterpreted, but these attempts at damage control haven't had much effect, as EUR/USD has traded sideways since the Mnuchin comments.
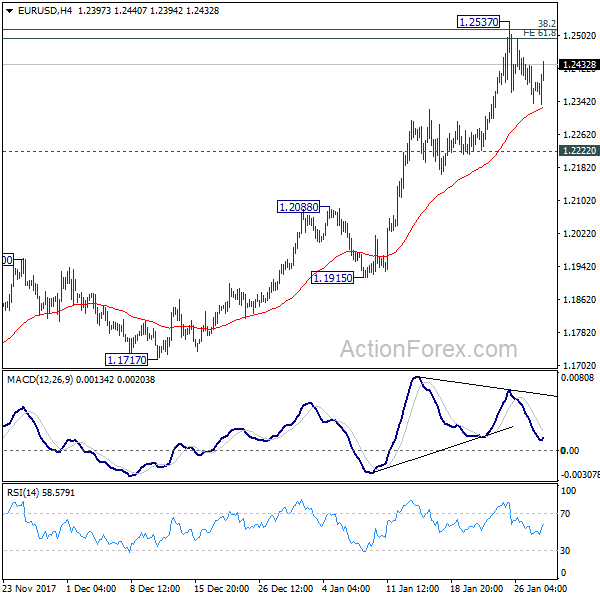
EUR/USD Mid-Day Outlook
Daily Pivots: (S1) 1.2335; (P) 1.2383 (R1) 1.2431; More....
EUR/USD's consolidation from 1.2537 is still in progress and intraday bias remains neutral. As long as 1.2222 support holds, near term outlook remains bullish. On the upside, sustained break of 1.2494/2516 resistance zone will extend recent rally to 100% projection of 1.0569 to 1.2091 from 1.1553 at 1.3075 next. However, break of 1.2222 will indicate rejection from 1.2494/2516, on bearish divergence condition in 4 hour MACD, and turn near term outlook bearish for 1.1915 support first.
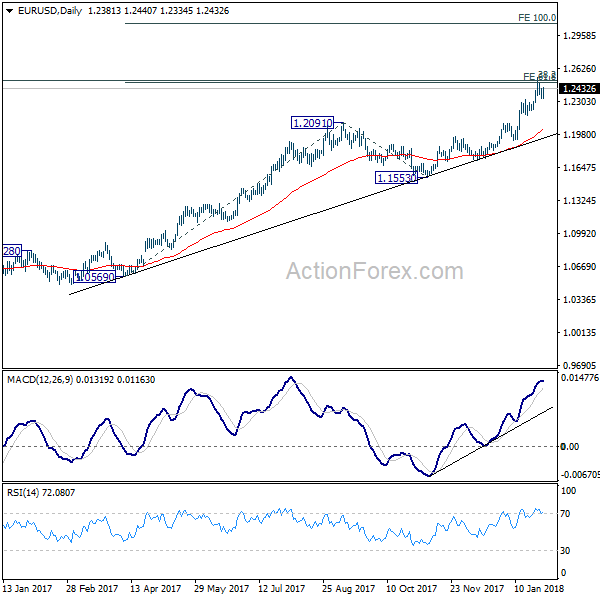
In the bigger picture, rise from 1.0339 medium term bottom is still seen as a corrective move for the moment. But key fibonacci level at 38.2% retracement of 1.6039 (2008 high) to 1.0339 (2017 low) at 1.2516 is looking vulnerable. Sustained break of 1.2516 will carry larger bullish implication and target 61.8% retracement of 1.6039 to 1.0339 at 1.3862. Nonetheless, rejection from 1.2516 will maintain long term bearish outlook and keep the case for retesting 1.0039 alive.
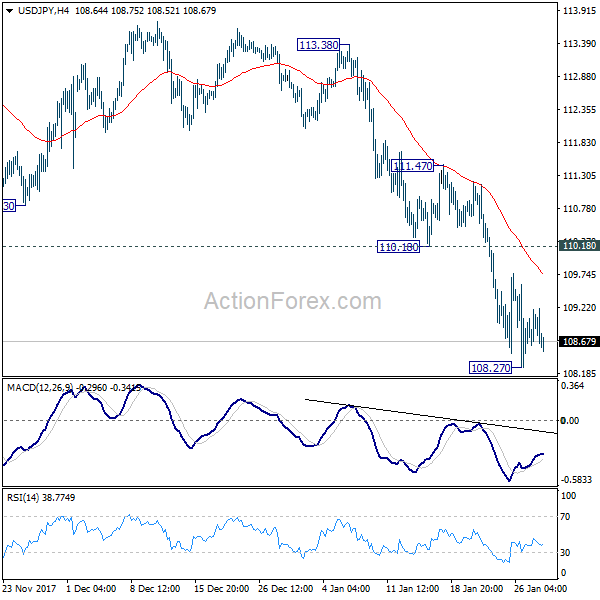
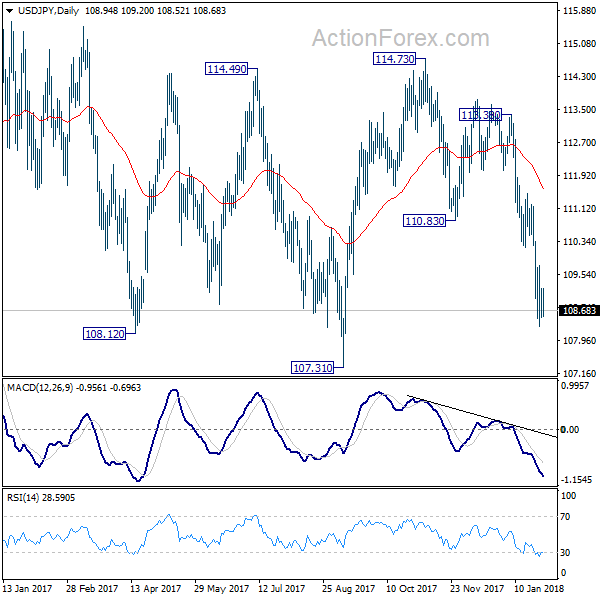
USD/JPY Mid-Day Outlook
Daily Pivots: (S1) 108.57; (P) 108.88; (R1) 109.27; More...
Intraday bias in USD/JPY remains neutral for consolidation above 108.27 temporary low. As long as 110.18 resistance holds, deeper decline is expected. On the downside, break of 108.27 will extend recent fall through 107.31 support to next fibonacci support at 106.48. Nonetheless, break of 110.18 will be the first sign of near term reversal and will turn bias back to the upside for 111.47 resistance.
In the bigger picture, current development argues that the corrective pattern from 118.65 is extending. There is risk of dropping further to 61.8% retracement of 98.97 to 118.65 at 106.48. But this level should provide strong support to contain downside and bring resumption of rise from 98.97. However, sustained break of 106.48 will now likely send USD/JPY through 98.97 to resume the corrective fall from 125.85 (2015 high).
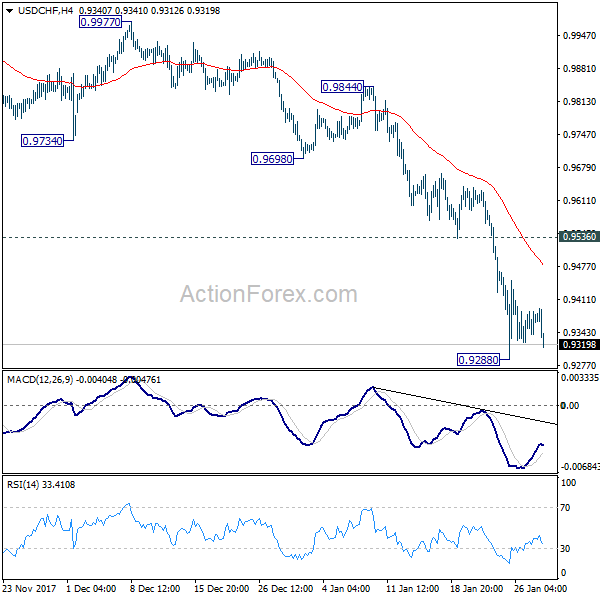
USD/CHF Mid-Day Outlook
Daily Pivots: (S1) 0.9335; (P) 0.9361; (R1) 0.9401; More...
Intraday bias in USD/CHF remains neutral as consolidation from 0.9288 is extending. Near term outlook will remain bearish as long as 0.9536 support turned resistance holds. Break of 0.9288 will resume the larger down trend and target next key fibonacci level at 0.9115.
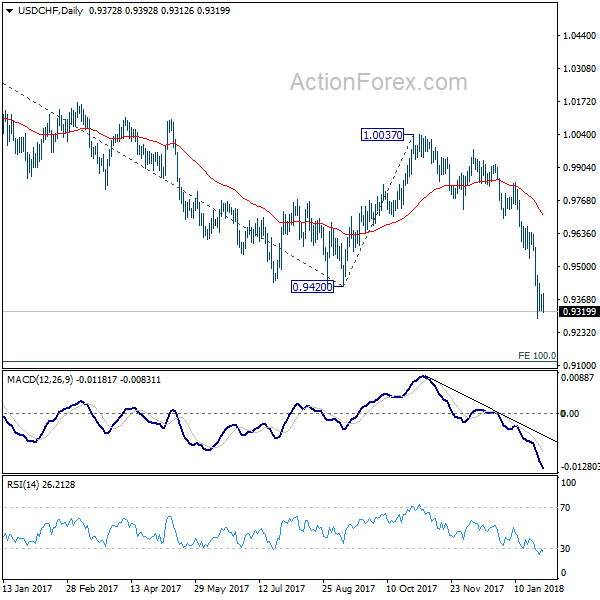
In the bigger picture, the strong break of 0.9420 support suggests that fall from 1.0342 is developing into a medium term down trend. Deeper fall should be seen to 100% projection of 1.0342 to 0.9420 from 1.0037 at 0.9115. Break will target 161.8% projection at 08545. In any case, break of 0.9640 resistance is needed to be the first sign of medium term bottoming. Otherwise, outlook will stay bearish even in case of strong rebound.