Sample Category Title
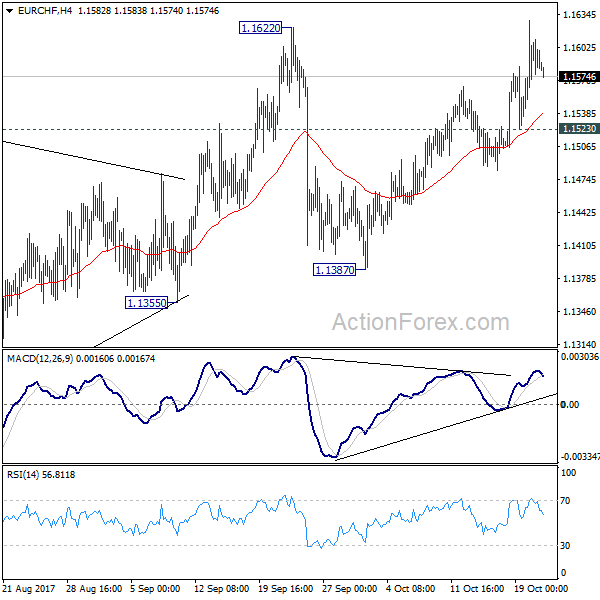
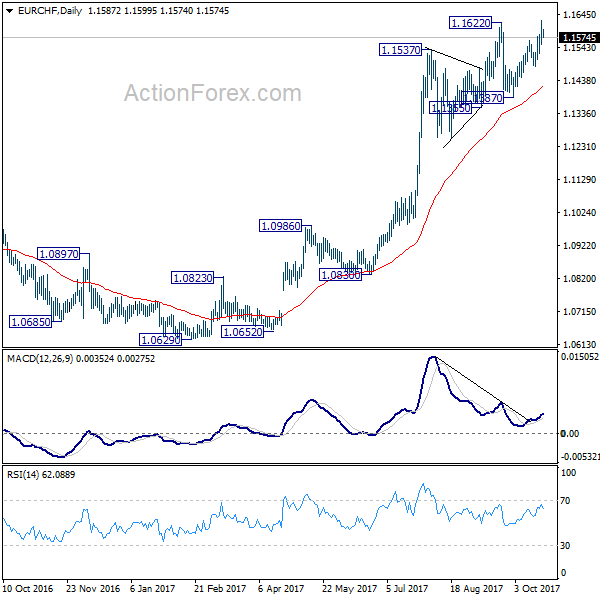
EUR/CHF Daily Outlook
Daily Pivots: (S1) 1.1552; (P) 1.1590; (R1) 1.1627; More....
Further rise is still expected in EUR/CHF as long as 1.1523 minor support holds. Medium term rally is possibly resuming. Sustained trading above 1.1622 resistance pave the way to 1.2 key level. On the downside, below 1.1523 will dampen this bullish case and turn bias to the downside for 1.1387 instead. In that case, consolidation from 1.1622 will extend for a while.
In the bigger picture, long term rise from SNB spike low back in 2015 is still in progress. EUR/CHF should now be heading back to prior SNB imposed floor at 1.2000. For now, this will be the favored case as long as 1.1198 resistance turned support holds.
The ECB, Riksbank And Norges Bank’s Meetings On Thursday
Market movers today
In a week relatively quiet on data releases, the main focus in financial markets will be on the ECB, Riksbank and Norges Bank's meetings on Thursday. We expect the ECB to announce a QE extension of nine months at a pace of EUR30bn, while we do not expect any changes to the bank's forward guidance. In terms of the Riksbank meeting, we expect an unchanged inflation and rate path as well as no news on the QE programme, while we expect Norges Bank to try to say as little new as possible as is the tradition at these interim meetings and given the scarcity of significant new information – although financial market participants will have a slightly dovish expectation of the meeting given the notably weak inflation print. Focus this week will also be on the ending of the Chinese Polit ical congress.
In terms of economic releases today, there is very little in the calendar but watch out for Japan PMI manufacturing number for October on Tuesday morning.
In Denmark, there is little on the agenda in the coming week but it will be interesting to see what happens to consumer confidence on Monday. The indicator has generally been upward bound this year but has softened over the past two months, after hitting a two -year high in July.
Selected market news
The election in Japan gave a solid victory for Prime Minister Shinzo Abe as he retained his twothirds majority. Given the election victory, he is expected to cont inue the soft fiscal and monetary policy. The Asian equity market s rallied and the yen weakened on the back of the victory.
The situation in Catalonia continues to escalate as Spanish Prime minister Mariano Rajoy is set to trigger article 155 of the Spanish constitution this week. Rajoy will then proceed to take over the government of Catalonia. The party leaders of the Catalan parliament will meet today and the regional president Carles Puigdemont and his allies are suggesting that they could declare independence this week.
The DBRS review on Portugal on Friday has been postponed until 3 November. Recently, the DBRS published a positive comment on the Portuguese economy and the fiscal results obtained so far. There is still plenty to do for the Portuguese government but given the comment a change in the out look from stable to positive is most likely. This will keep momentum for the spread compression to core EU and peers such as Spain and Italy.
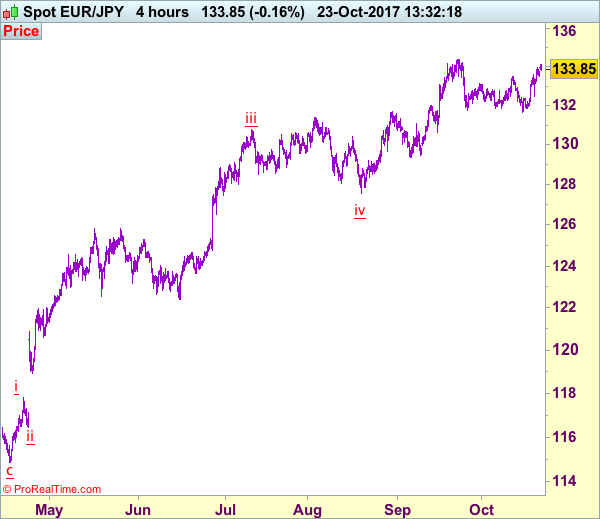
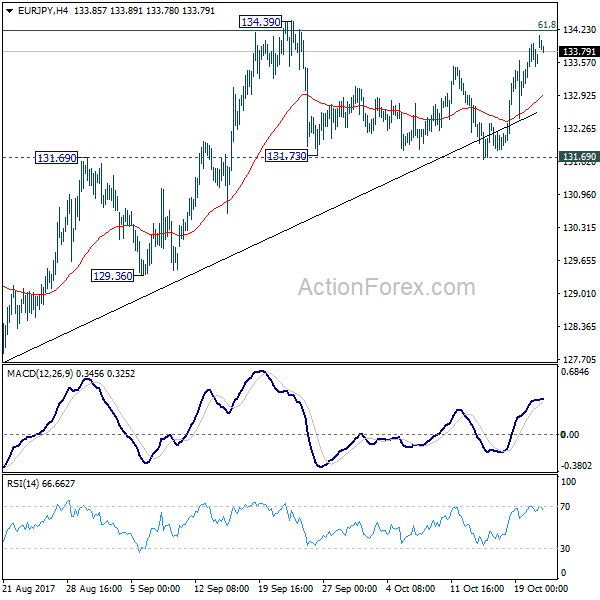
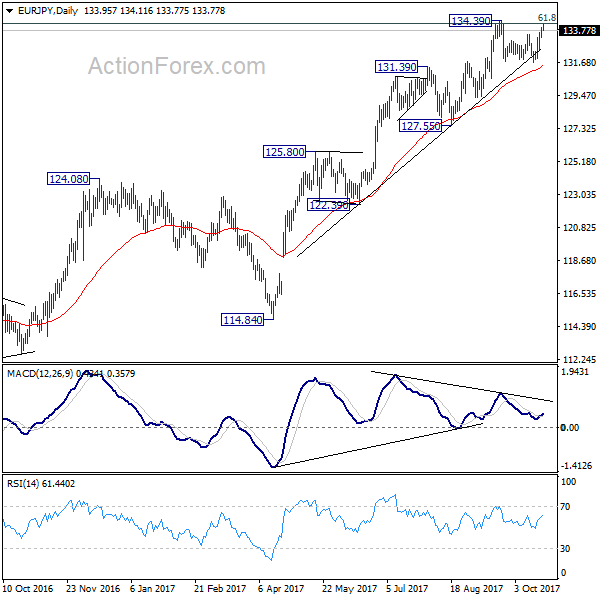
EUR/JPY Daily Outlook
Daily Pivots: (S1) 132.69; (P) 133.15; (R1) 133.84; More...
At this point, EUR/JPY is staying in range of 131.69/134.39 and intraday bias remains neutral first. on th eupside, decisive break of 134.39 high will confirm up trend resumption. In such case, EUR/JPY should target 141.04 long term resistance. However, firm break of 131.69 will be an early sign of medium term reversal and will target 127.55 key support level.
In the bigger picture, medium term rise from 109.03 (2016 low) is seen as at the same degree as the down trend from 149.76 (2014 high) to 109.03 (2016 low). 61.8% retracement of 149.76 to 109.03 at 134.20 is already met. Sustained break there will pave the way to key long term resistance zone at 141.04/149.76. However, break of 127.55 support will argue that the medium term trend has reversed and will turn outlook bearish for deeper fall.
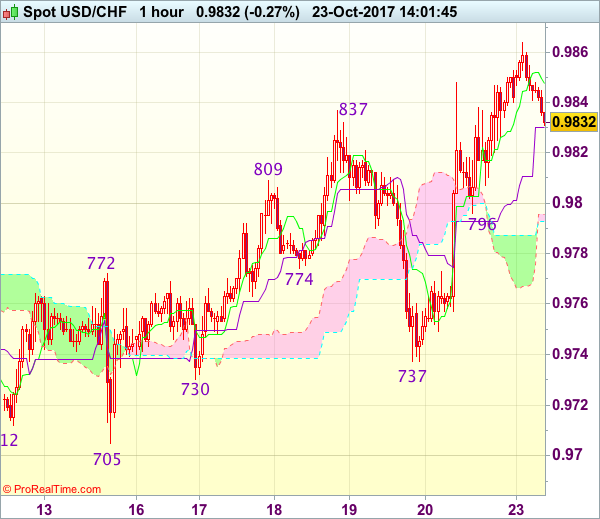
Trade Idea : USD/CHF – Buy at 0.9795
USD/CHF - 0.9834
Most recent candlesticks pattern : N/A
Trend : Up
Tenkan-Sen level : 0.9852
Kijun-Sen level : 0.9830
Ichimoku cloud top : 0.9796
Ichimoku cloud bottom : 0.9793
Original strategy :
Buy at 0.9775, Target: 0.9875, Stop: 0.9740
Position : -
Target : -
Stop : -
New strategy :
Buy at 0.9795, Target: 0.9895, Stop: 0.9760
Position : -
Target : -
Stop : -
As the greenback rallied after finding renewed buying interest at 0.9737 late last week, adding credence to our view that recent upmove has resumed and bullishness remains for the rise from 0.9421 low to extend headway to 0.9870 and possibly towards 0.9900, however, near term overbought condition should limit upside and price should falter below 0.9940-50, bring retreat later.
In view of this, we are looking to buy dollar again on pullback as support at 0.9796 should limit downside and bring another rise. Below 0.9765-70 would defer and suggest top is possibly formed, risk test of indicated support at 0.9730-37, however, break there is needed to provide confirmation, then further fall to previous support at 0.9705 would follow.
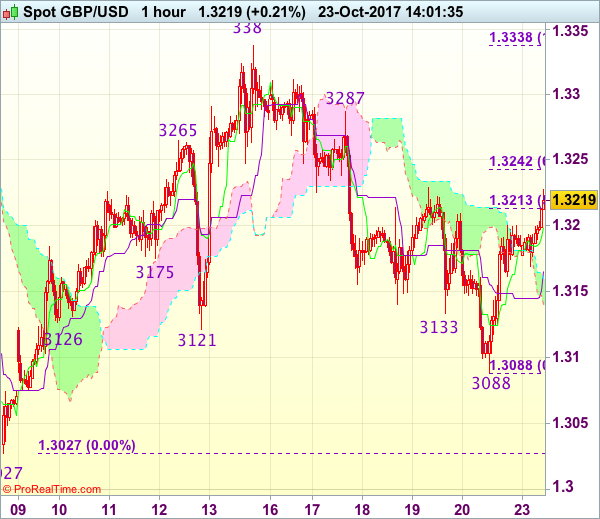
Trade Idea : GBP/USD – Sell at 1.3285
GBP/USD - 1.3219
Most recent candlesticks pattern : N/A
Trend : Near term down
Tenkan-Sen level : 1.3187
Kijun-Sen level : 1.3149
Ichimoku cloud top : 1.3164
Ichimoku cloud bottom : 1.3147
Original strategy :
Sell at 1.3260, Target: 1.3120, Stop: 1.3295
Position : -
Target : -
Stop : -
New strategy :
Sell at 1.3285, Target: 1.3155, Stop: 1.3320
Position : -
Target : -
Stop : -
As cable found good support at 1.3088 late last week and has staged a strong rebound, suggesting consolidation with initial upside bias would be seen for recovery to 1.3240-45 (61.8% Fibonacci retracement of 1.3338-1.3088), however, price should falter below indicated resistance at 1.3287 and bring retreat later, below 1.3130-35 would bring test of said support at 1.3088 but break there is needed to extend the fall from 1.3338 to 1.3050, then towards recent low at 1.3027.
In view of this, wee are looking to sell cable on further subsequent recovery as resistance at 1.3287 should limit upside and bring another decline later. Only above 1.3312 resistance would abort and extend further gain to said recent high at 1.3338 which is likely to hold from here.
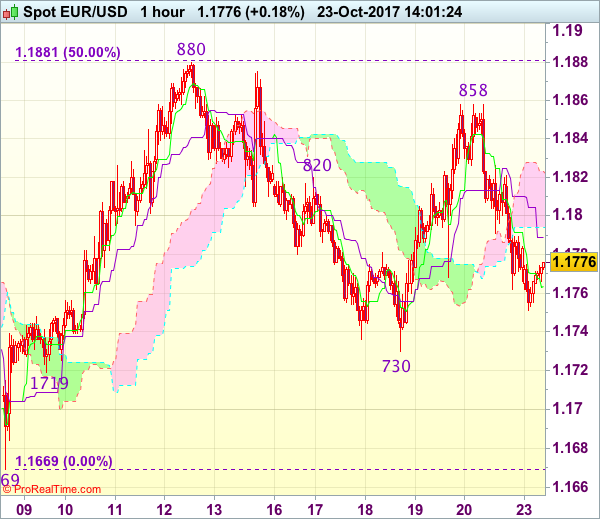
Trade Idea : EUR/USD – Stand aside
EUR/USD - 1.1775
Most recent candlesticks pattern : N/A
Trend : Sideways
Tenkan-Sen level : 1.1763
Kijun-Sen level : 1.1789
Ichimoku cloud top : 1.1823
Ichimoku cloud bottom : 1.1794
New strategy :
Stand aside
Position : -
Target : -
Stop : -
Despite last week’s strong rebound to 1.1858, lack of follow through buying and the subsequent sharp retreat suggest further choppy trading within recent established range would be seen and weakness to 1.1730 support cannot be ruled out, however, break there is needed to retain bearishness and signal another leg of decline from 1.1880 is underway for weakness to 1.1700 and possibly towards said support at 1.1669.
In view of this, would not chase this fall here and would be prudent to stand aside for now. Above 1.1800 would bring recovery to 1.1820-25, however, said resistance at 1.1858 should limit upside and price should falter well below said resistance at 1.1880. Only a break above there would signal another leg of erratic upmove from 1.1669 low is underway for gain to 1.1900-10, then towards 1.1940-50 later. As near term outlook is mixed, would be prudent to stand aside for now.
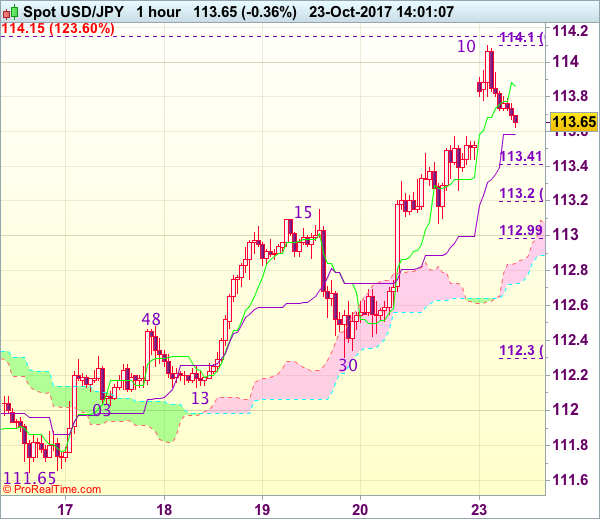
Trade Idea : USD/JPY – Buy at 113.20
USD/JPY - 113.74
Most recent candlesticks pattern : N/A
Trend : Near term up
Tenkan-Sen level : 113.89
Kijun-Sen level : 112.59
Ichimoku cloud top : 112.84
Ichimoku cloud bottom : 112.72
Original strategy :
Buy at 112.80, Target: 113.80, Stop: 112.45
Position : -
Target : -
Stop : -
New strategy :
Buy at 113.20, Target: 114.20, Stop: 112.85
Position : -
Target : -
Stop : -
Although the greenback opened higher and rose to 114.10, current retreat suggests consolidation below this level would be seen and pullback to 113.40-45 (38.2% Fibonacci retracement of 112.30-114.10) cannot be ruled out, however, reckon 113.15-20 (previous resistance and 50% Fibonacci retracement) would hold and bring another rise later, above said resistance at 114.10 would extend recent rise from 111.65 to 114.40-50 but reckon 114.75-80 would hold from here due to oversold condition.
In view of this, we are looking to buy dollar again on pullback as 113.15-20 should limit downside and bring another rise. Below the lower Kumo (now at 112.72) would defer and suggest top is possibly formed instead, risk test of indicated support at 112.30 which is likely to hold from here.
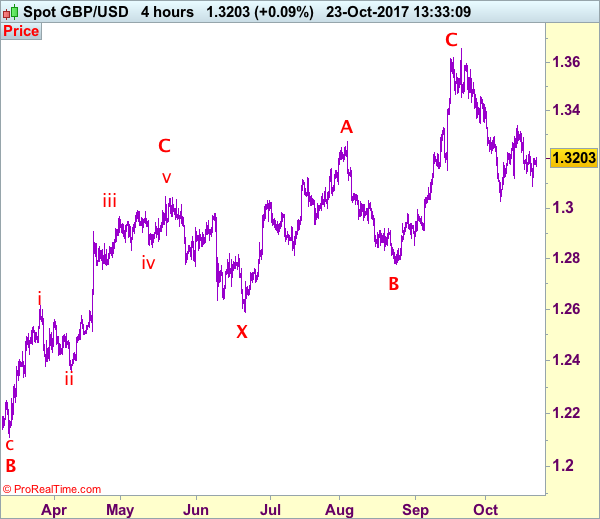
Trade Idea: GBP/USD – Stand aside
GBP/USD – 1.3202
New strategy :
Stand aside
Position: -
Target: -
Stop:-
Despite last week’s anticipated fall to 1.3088, lack of follow through selling and the subsequent rebound suggest further consolidation would be seen and test of resistance at 1.3229 cannot be ruled out, however, break there is needed to suggest the fall from 1.3338 has ended at 1.3088, then a stronger rebound to 1.3287 resistance cannot be ruled out, having said that, price should falter well below resistance at 1.3338 and bring further choppy trading later.
On the downside, whilst pullback to 1.3160-70 cannot be ruled out, reckon 1.3115-20 would hold and bring further sideways trading. Only a break below said support at 1.3088 would revive bearishness for resumption of recent decline towards recent low at 1.3027. Our preferred count is that (pls see the attached chart) the wave IV is unfolding as a complex double three (ABC-X-ABC) correction with 2nd wave B ended at 1.2774, hence 2nd wave C could have ended at 1.3658.
Our preferred count on the daily chart is that cable's rebound from 1.3500 (wave (A) trough) is unfolding as a wave (B) with A ended at 1.7043, followed by triangle wave B and wave C as well as wave (B) has ended at 1.7192, the subsequent selloff is the larger degree wave (C) which is still unfolding with minor wave (III) of larger degree wave 3 ended at 1.1986, hence wave (IV) correction is in progress which could either be a triangle wave (IV) of a complex formation but upside should be limited to 1.3500 and price should falter well below 1.4000, bring another decline in wave (V) of 3 for weakness to 1.1500, then 1.1200.
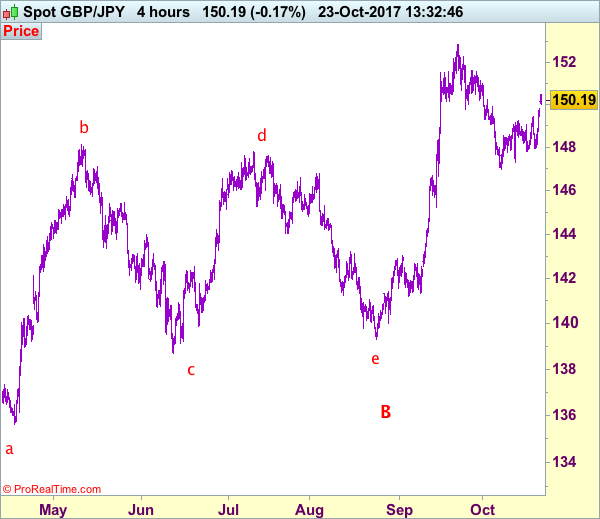
Trade Idea: GBP/JPY – Buy at 149.50
GBP/JPY - 150.10
New strategy :
Buy at 149.50, Target: 151.50, Stop: 148.90
Position: -
Target: -
Stop:-
Sterling found decent demand at 147.95 late last week and has rallied above resistance at 149.40, adding credence to our view that the erratic rise from 146.95 is still in progress, hence bullishness remains for this move to bring retracement of the fall from 152.85 to 150.50-55 and possibly 151.00 but still reckon upside would be limited to towards resistance at 151.60 which is likely to hold from here, bring retreat later.
In view of this, we are looking to buy sterling on pullback as 149.45-50 should limit downside and bring another rise. Below 148.90-00 would defer and risk weakness to 148.55-60, break there would signal top is formed instead, then weakness to indicated support at 147.80 would follow. Once this level is penetrated, this would signal the rebound from 146.95 has ended, bring weakness to another previous support at 147.30, below would confirm the fall from 152.85 has resumed for retest of 146.95. Looking ahead, below there would extend the fall from 152.85 top for retracement of recent upmove to 146.60-65 and then 146.00 but previous support at 145.25 should remain intact.
Our preferred count is that larger degree wave V with circle is unfolding from 251.12 with wave (I) 219.34, (II): 241.38 and wave (III) is subdivided into 1: 192.60, 2: 215.89 (23 Jul 2008) and wave 3 ended at 118.87 earlier in 2009. The correction from there to 162.60 is wave 4 which itself is a double three and is labeled as first a-b-c ended at 151.53, followed by wave x at 139.03, 2nd a ended at 162.60, 2nd b at 146.75 and 2nd c leg of wave 4 ended at 163.00. Therefore, the decline from 163.00 to 116.85 is now treated as wave 5 which also marked the end of larger degree wave (III), hence wave (IV) major correction has commenced for retracement of the wave (III) from 241.38 and upside target at 183.95-00 (50% Fibonacci retracement of the wave (II) from 241.38) had been met, a drop below 160.00 would suggest wave (IV) has ended at 195.85, bring decline in wave (V) for initial weakness to 130 (already met) and 120.
Trade Idea: EUR/JPY – Buy at 133.20
EUR/JPY - 133.81
Original strategy:
Buy at 133.30, Target: 135.30, Stop: 132.70
Position: -
Target: -
Stop: -
New strategy :
Buy at 133.20, Target: 135.20, Stop: 132.60
Position: -
Target: -
Stop:-
As the single currency opened higher and has maintained a firm undertone, suggesting the rise from 131.66 (last week’s low) is still in progress, hence bullishness remains for this move to bring a retest of recent high at 134.41, however, bream there is needed to confirm early upmove has resumed and extend headway to 135.00-10 and later towards 135.50-60 which is likely to hold from here due to overbought condition.
In view of this, would not chase this rise here and would be prudent to buy euro on pullback as 133.20-30 should limit downside. Only below said support at 132.47 would abort and prolong choppy trading, risk weakness to 132.00, having said that, strong support at 131.66 should remain intact, bring another rebound later.
Our latest preferred count is that wave (ii) is ABC-X-ABC which ended at 123.33 and wave (iii) is unfolding with wave iii ended at 100.77, followed by wave iv at 111.57 and wave v as well as the wave (iii) has ended at 97.04, followed by wave (iv) at 111.43 and wave (v) has ended at 94.12 which is also the end of the larger degree v, this also implied the major wave (C) has also ended there, hence major correction has commenced from there with (A) leg unfolding in its lower degree wave c which has possibly ended at 145.69. Under this count, A-B-C wave (B) has commenced with A leg ended at 136.23, wave B at 143.79 and wave C has possibly ended at 149.79.
Our larger degree count is that the decline from 139.26 is wave (C) and is sub-divided into a diagonal triangle i-ii-iii-iv-v with wave i - 105.44, wave ii- 123.33, wave iii - 97.03, wave iv - 111.43, followed by the final wave v as well as the end of wave (C) at 94.12, this also mark the bottom of larger degree wave B. Under this count, major rise in wave C has commenced as an impulsive wave with minor wave III ended at 145.69, wave V is still in progress for further gain to 150.00. Having said that, this so-called wave V could well be the first leg of larger degree 5-waver wave C and this wave C should bring at least a retest of wave A top at 169.97 (July 2008).