Sample Category Title
Daily Technical Analysis: EURUSD, GBPUSD, USDJPY, USDCHF
EURUSD
The EURUSD was indecisive last week. The major bullish trend remains valid but we have a potential “head and shoulders” bearish reversal formation as you can see on my daily chart below. The bias is bearish in nearest term testing 1.1670 support area which is the “neckline” of the “head and shoulders” formation. A clear break below that area would confirm the bearish reversal scenario with nearest target seen at 1.1450. Immediate resistance is seen around 1.1800. A clear break above that area could lead price to neutral zone in nearest term testing 1.1850 but key resistance remains at 1.1900 which need to be clearly broken to the upside to potentially nullify the “head and shoulders” bearish scenario and continue the major bullish trend testing 1.2000 – 1.2090.
GBPUSD
The GBPUSD failed to continue its bullish momentum last week bottomed at 1.3087 but closed a little bit higher at 1.3189. The bias is neutral in nearest term probably with a little bullish bias testing 1.3225 – 1.3285 area but key resistance remains at 1.3330 which need to be clearly broken to the upside to reactivate my bullish mode. Immediate support is seen around 1.3150. A clear break below that area could trigger further bearish pressure retesting 1.3087 but key support is seen at 1.3000 – 1.2950 region. Overall I remain bullish.
USDJPY
The USDJPY had a bullish momentum last week, broke above 113.20 key resistance and gapped higher earlier today in Asian session opened at 113.86. The bias is bullish in nearest term testing 114.50 area. Immediate support is seen around 113.50/20 region. A clear break back below that area could lead price to neutral zone in nearest term as direction would become unclear. On the upside, a clear break and daily close above 114.50 would expose 115.20/50 region. Overall I remain neutral.
USDCHF
The USDCHF had a bullish momentum last week topped at 0.9852 and hit 0.9858 earlier today in Asian session. The bias is bullish in nearest term testing 0.9950. Immediate support is seen around 0.9836/07. A clear break below that area could lead price to neutral zone in nearest term as direction would become unclear. On the upside, a clear break and daily close above 0.9950 would expose 1.0100 region. I am bullish on this pair.
EURUSD Outlook Lower On Corrective Pullbacks
EURUSD - With the pair seen closing lower the past week, more weakness is envisaged. Resistance comes in at 1.1850 levels with a cut through here opening the door for more upside towards the 1.1900 level. Further up, resistance lies at the 1.1950 level where a break will expose the 1.2000 level. Conversely, support lies at the 1.1750 level where a violation will aim at the 1.1700 level. A break of here will aim at the 1.1650 level. Below here will open the door for more weakness towards the 1.1600. Its weekly RSI is bearish and pointing lower suggesting further weakness. All in all, EURUSD continues to face downside threats.
GOLD – Sets Up To Weaken Further
GOLD - The commodity reversed its previous week losses to close lower on Friday. On the downside, support comes in at the 1,270.00 level where a break will turn attention to the 1,260.00 level. Further down, a cut through here will open the door for a move lower towards the 1,250.00 level. Below here if seen could trigger further downside pressure targeting the 1,240.00 level. Conversely, resistance resides at the 1,290.00 level where a break will aim at the 1,300.00 level. A turn above there will expose the 1,310.00 level. Further out, resistance stands at the 1,320.00 level. All in all, GOLD looks to weaken further lower.
And How Was Your Weekend ??
And how was your weekend??
The markets opened right on expectations, and so far in early APAC trade the headline risk from this weekends Catalonian perplexity is not posing a significant threat to risk or the Euro which is only trading marginally lower with investors single-mindedly focused on the critical ECB meeting Oct 26
USDJPY has bounced higher on Abe's resounding election victory. Traders remain bulled up on USDJPY as Abe policies should remain accommodative and point to a weaker Yen over time. And while the JPY is expected to weaken medium-term, uncertainty over the Fed chair nomination could weigh on crowded near-term positions. None the less, Abe's landslide victory should pave the way for an extension of Japan's stock market rally, which could underpin USDJPY sentiment
So far risk sentiment remains buoyant after a strong US equity futures open on an extension of last weeks US tax reform euphoria.But its early days and with a deluge of headline risk expected this week, I surmise upside follow-through will remain tentative, but indeed, USDJPY bulls are smiling this morning.
The House Republican's return from recess this week so we should expect the usual bipartisan banter to hit the wires as the House will take up debate on the budget resolution. The discourse should provide the street with a decent heat map to gauge overall US political sentiment. Currently, the market is buying into Trump's comments that the GOP has enough seats to pass the administrations economic aspirations.
Let's not overlook the Feds Chair game of thrones.Currently, the markets are giving the nod to either Powell or Taylor; however, a Yellen appointment should present some significant headwinds for the USD but good for US equities on the assumption of a very very gradual pace of policy normalisation. Not to mention continuity is always a good thing for equity markets.
The Euro
Very much cemented in current ranges but eyes will be on US treasuries as the EURO will take its cues from USD momentum early in the week. However, dealers will keep a close eye on the current EURUSD dip to gauge market lean going into the critical ECB meeting.
After the summer run up on the EURUSD, the ECB veered dovish with timely leaks designed to temper the markets bullish view. Given the ECB sensitivity to Euro strength, it may be wise to ascribe to the ECB source leaks that that monthly purchases will be extended for nine months at a pace of 25-40bn per month which should imply currency neutrality.
The Japanese Yen
Indeed, an excellent opener for the USDJPY bulls on Abe's resounding victory.But from here the next significant extension will likely be triggered by House resolution headlines so all eyes will be on the headline heat map. The Nikkie futures look happy in early trade, so this alone could push the USDJPY above the phycological 114.00 for a test of the key 114.30-50 region.
The Australian Dollar
With no deviation from Friday's view, the Australian Dollar is one of the G-10 currencies with most to lose from a stronger dollar and a more hawkish Fed. The US dollar appears to be on solid footings into the weekend., but next weeks focus will be the US bond curve. Any aggressive move higher in US yields, especially if President Trump gives Taylor the nod, will put the Aussie at exceptional risk.
So far it appears the Typhoon Lan, which hit Tokyo this morning, is not dampening investor spirits.
EUR/USD Weekly Outlook
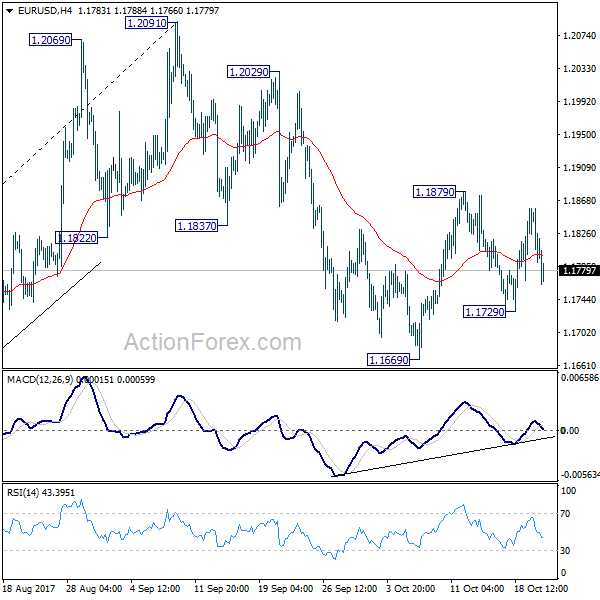
EUR/USD stayed in range of 1.1669/1879 last week and initial bias is neutral this week first. On the upside, break of 1.1879 will affirm the case that pull back from 1.2091 has already completed at 1.1669. In such case, intraday bias will be turned back to the upside for retesting 1.2091 high. On the downside, break of 1.1669 will resume the fall from 1.2091 to 38.2% retracement of 1.0569 to 1.2091 at 1.1510. We'd expect strong support from there to complete the correction.
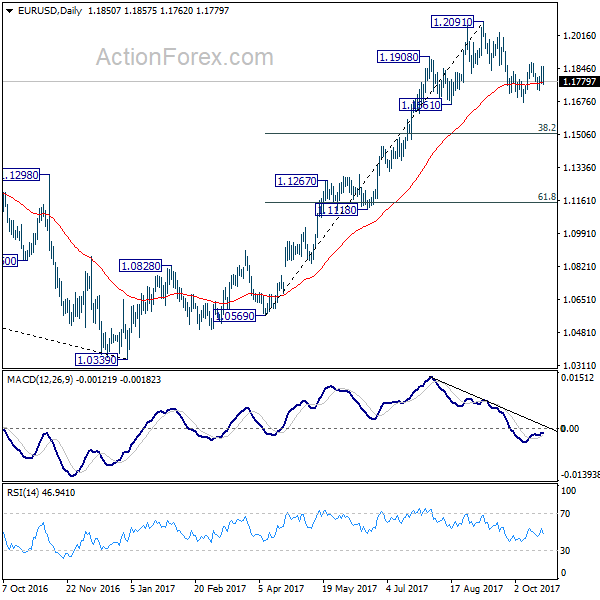
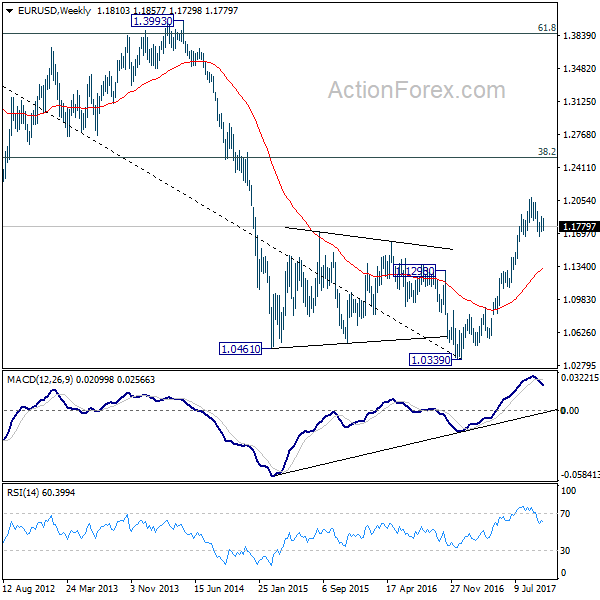
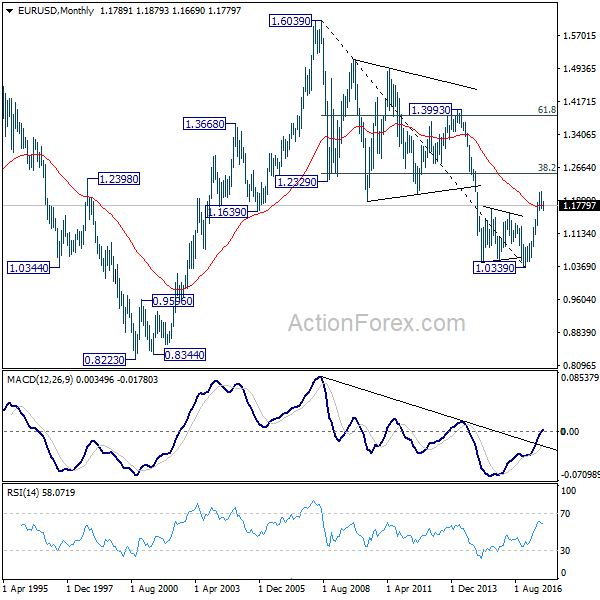
In the bigger picture, rise from medium term bottom at 1.0339 is not finished yet. It's expected to continue after pull back from 1.2091 completes. And, next target will be 38.2% retracement of 1.6039 (2008 high) to 1.0339 (2017 low) at 1.2516. However, it should be noted that there is no confirmation of trend reversal yet. That is, such rebound from 1.0399 could be a correction. And the long term fall from 1.6039 (2008 high) could resume. Hence, we'd be cautious on strong resistance from 1.2516 to limit upside.
In the long term picture, 1.0339 is now seen as an important bottom as the down trend from 1.6039 (2008 high) could have completed. It's still early to decide whether price action form 1.0339 is developing into a corrective or impulsive move. But in either case, further rally would be seen to 38.2% retracement of 1.6039 to 1.0339 at 1.2516
USD/JPY Weekly Outlook
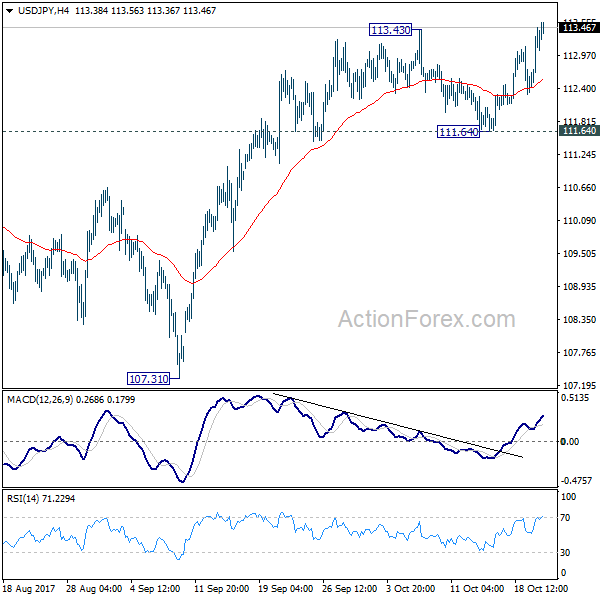
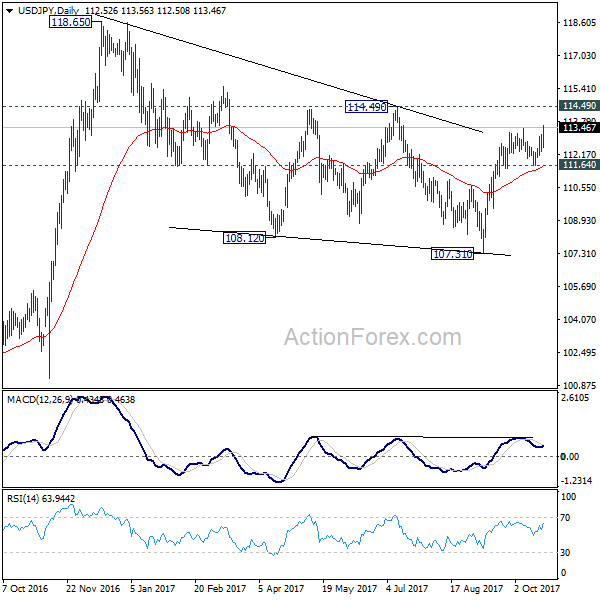
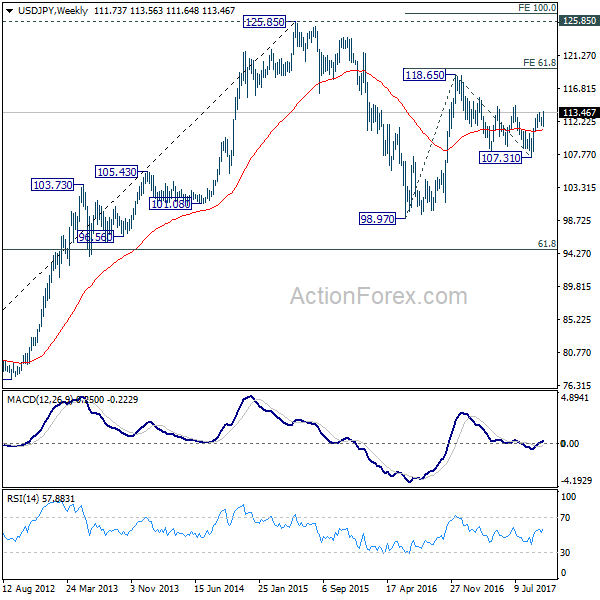
USD/JPY's break of 113.43 resistance last week indicates that rebound from 107.31 has resumed. This also revives the case that correction from 118.65 has completed at 107.31. Initial bias remains on the upside this week for 114.49 resistance first. Decisive break there will affirm this case and target 118.65 resistance and above. For now, this will be the preferred case as long as 111.64 support holds.
In the bigger picture, medium term rise from 98.97 (2016 low) is not completed yet. It should resume after corrective fall from 118.65 completed. Break of 114.49 resistance will likely resume the rise to 61.8% projection of 98.97 to 118.65 from 107.31 at 119.47 first. Firm break there will pave the way to 100% projection at 126.99. This will be the key level to decide whether long term up trend is resuming.
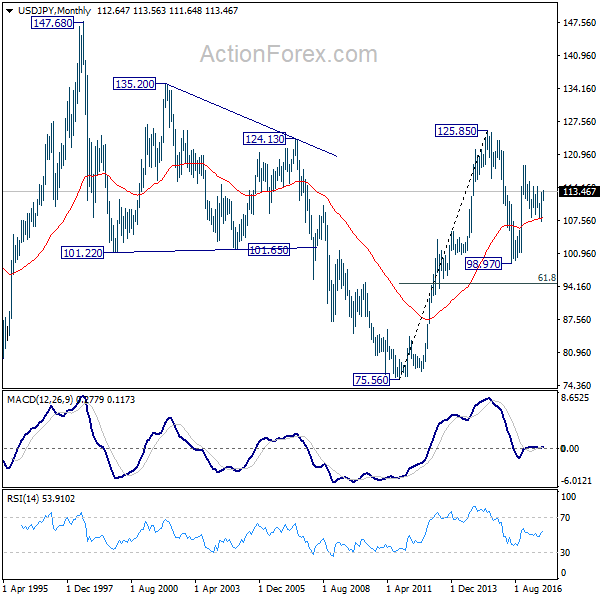
In the long term picture, the rise from 75.56 (2011 low) long term bottom to 125.85 top is viewed as an impulsive move, no change in this view. Price actions from 125.85 are seen as a corrective move which could still extend. In case of deeper fall, downside should be contained by 61.8% retracement of 75.56 to 125.85 at 94.77. Up trend from 75.56 is expected to resume at a later stage for above 135.20/147.68 resistance zone.
GBP/USD Weekly Outlook
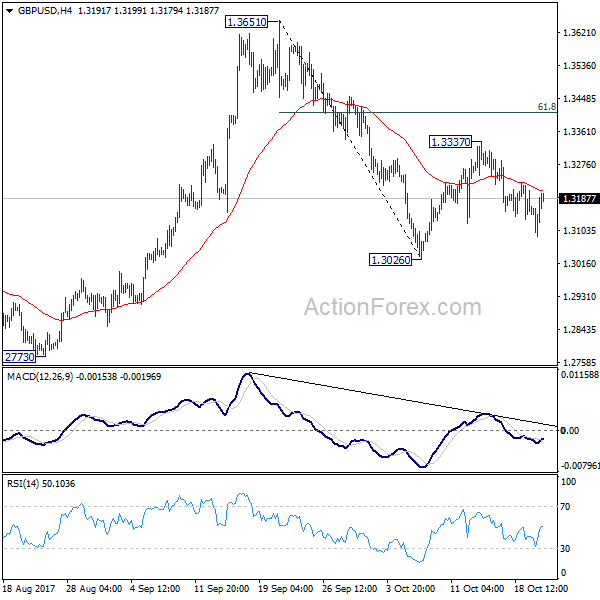
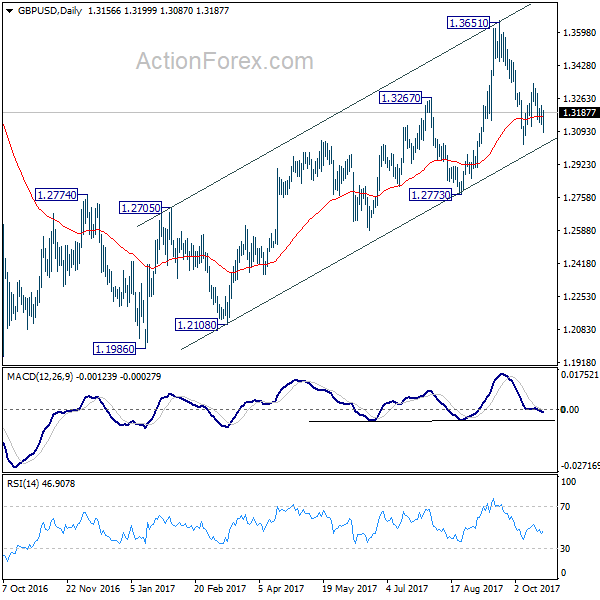
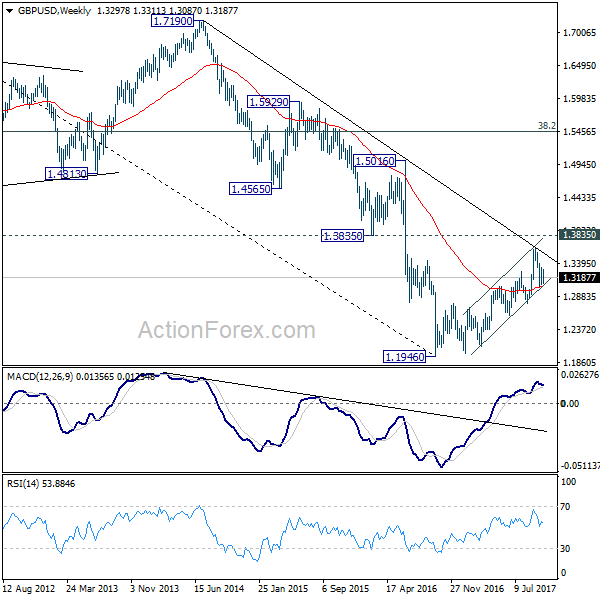
GBP/USD's decline last week suggests that rebound from 1.3026 has completed at 1.3337 already. And near term outlook is a bit mixed. Initial bias remains neutral this week first. On the downside, break of 1.3026 will resume the decline from 1.3651 and target 1.2773 key support level. This will also revive the case of medium term reversal. Meanwhile, on the upside, break of 1.3337 will resume the rebound from 1.3026 to 61.8% retracement of 1.3651 to 1.3026 at 1.3412 and above.
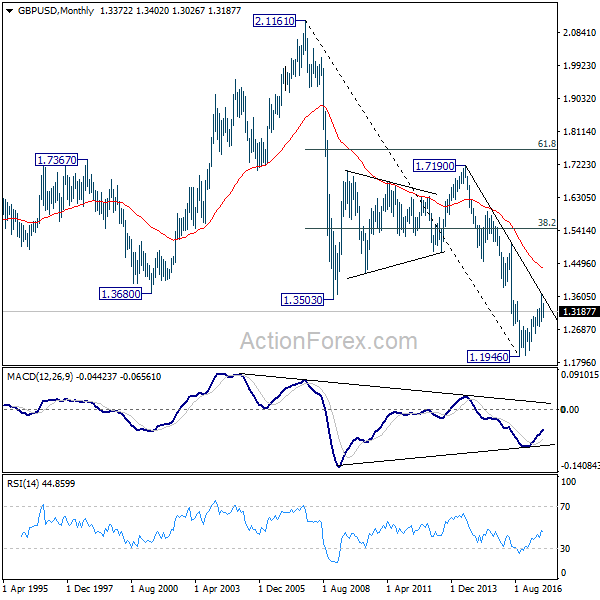
In the bigger picture, while the medium term rebound from 1.1946 was strong, GBP/USD hit strong resistance from the long term falling trend line. Outlook is turned a bit mixed and we'll stay neutral first. On the downside, decisive break of 1.2773 key support will argue that rebound from 1.1946 has completed. The corrective structure of rise from 1.1946 to 1.3651 will in turn suggest that long term down trend is now completed. Break of 1.1946 low should then be seen. On the upside, break of 1.3835 support turned resistance will revive the case of trend reversal and target 38.2% retracement of 2.1161 (2007 high) to 1.1946 (2016 low) at 1.5466 .
In the longer term picture, long the outlook is turned a bit mixed as GBP/USD failed to break through falling tend line resistance. We'll stay neutral first and assess the outlook again and price actions unfold.
USD/CHF Weekly Outlook
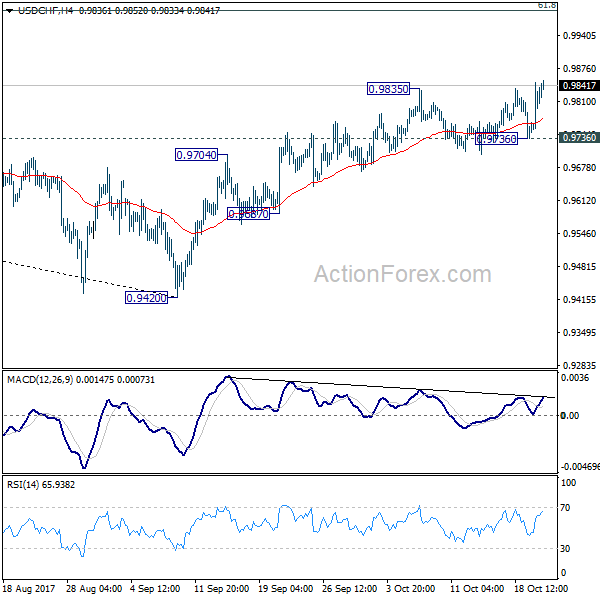
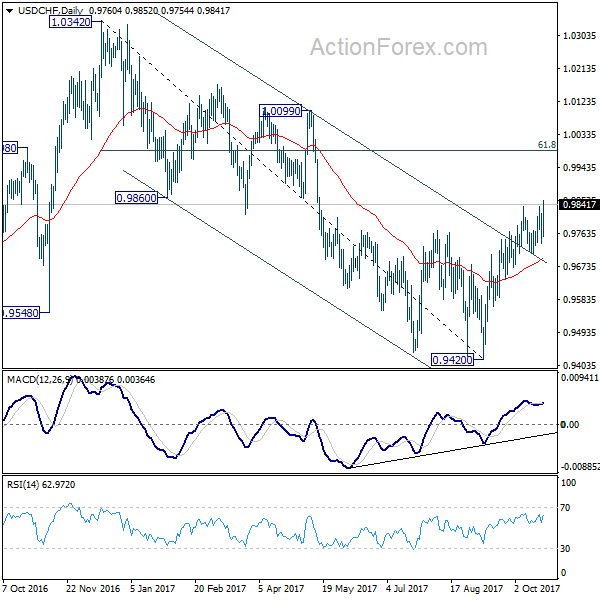
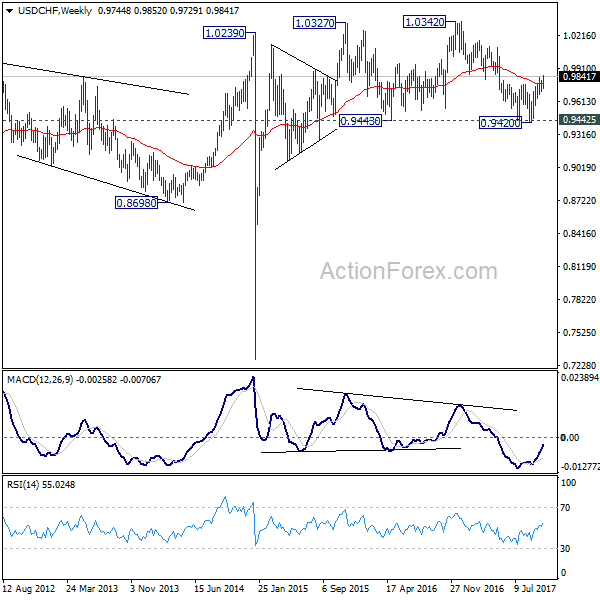
USD/CHF's break of 0.9835 resistance last week indicates that rebound from 0.9420 is resuming. More importantly, this affirmed the case that medium term fall from 1.0342 has finished at 0.9420. Initial bias stays on the upside this week for 61.8% retracement of 1.0342 to 0.9420 at 0.9990. Sustained break there will pave the way to retest 1.0342 high. However, break of 0.9736 support will mixed up the near term outlook and turn bias back to the downside for 0.9587 support instead.
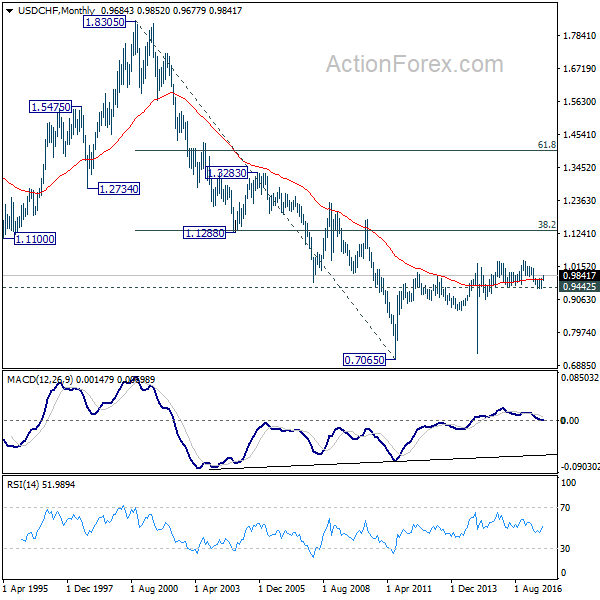
In the bigger picture, current development suggests that USD/CHF has defended 0.9443 (2016 low) key support level again. Rise from 0.9420 could develop into a medium term move and target a test on 1.0342 high. This represents the upper end of a long term range that started back in 2015. On the downside, break of 0.9587 support is now needed to indicate completion of the rise from 0.9420. Otherwise, further rally will remain in favor in medium term.
AUD/USD Weekly Outlook
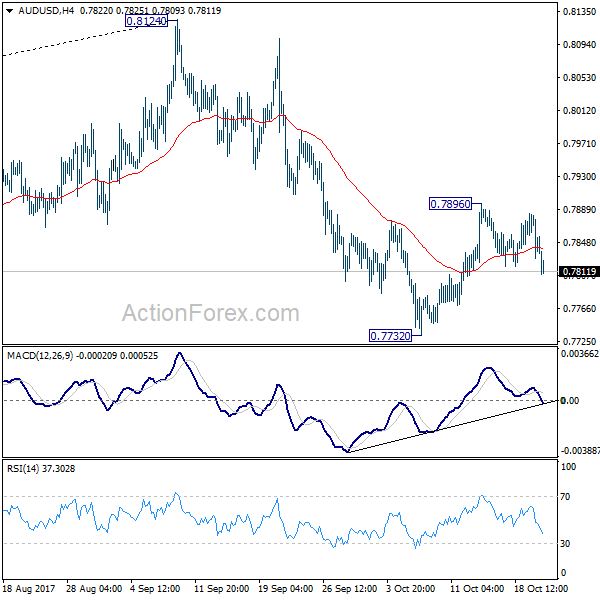
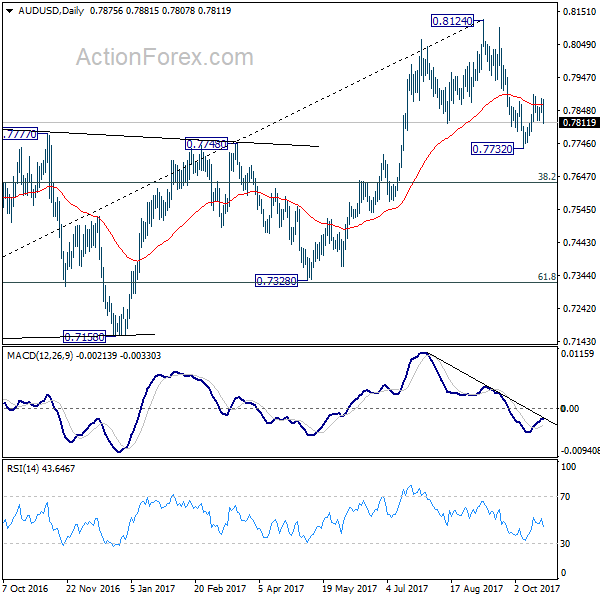
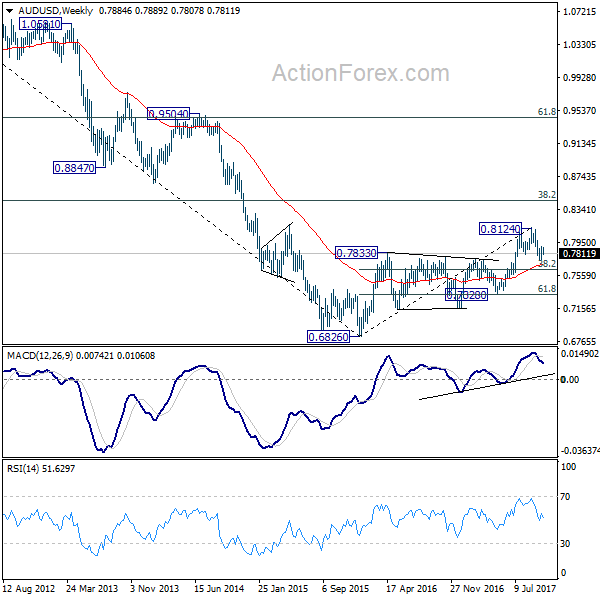
AUD/USD's rebound from 0.7732 was limited at 0.7896 and turned sideway. Initial bias remains neutral this week first. On the downside, break of 0.7732 will resume the decline from 0.8124 and target medium term fibonacci level at 0.7628 first. This will also affirm the case of medium term reversal. On the upside, however, break of 0.7896 will extend the rebound to 61.8% retracement of 0.8124 to 0.7732 at 0.7974 and possibly above.
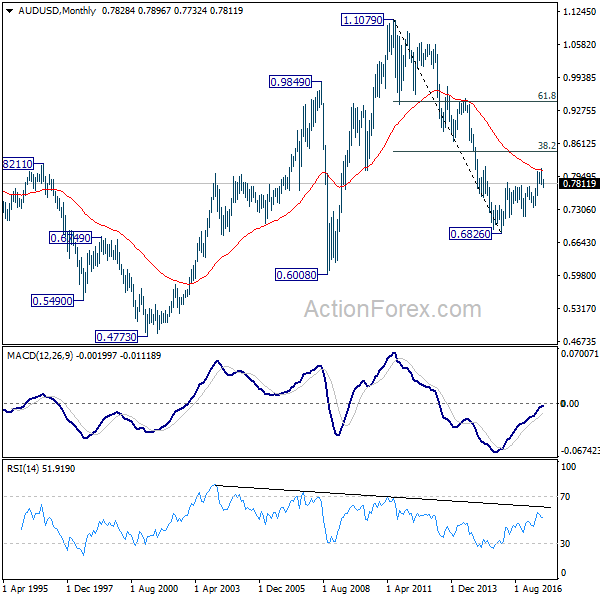
In the bigger picture, rise from 0.6826 medium term bottom is seen as corrective pattern. Current development suggests that it might be completed with three waves up to 0.8124 already. Break of 38.2% retracement of 0.6826 to 0.8124 at 0.7628 will firm this bearish case. And, decisive break of 0.7328 key cluster support (61.8% retracement at 0.7322) will confirm and bring retest of 0.6826 low. In case rise from 0.6826 resumes and extends, strong resistance should be seen at 38.2% retracement of 1.1079 to 0.6826 at 0.8451 to limit upside.
In the longer term picture, 0.6826 is seen as a long term bottom. Rise from there could either reverse the down trend from 1.1079, or just develop into a corrective pattern. At this point, we're favoring the latter. And, as long as 38.2% retracement of 1.1079 to 0.6826 at 0.8451 holds, we'd anticipate another decline through 0.6826 at a later stage.
USD/CAD Weekly Outlook
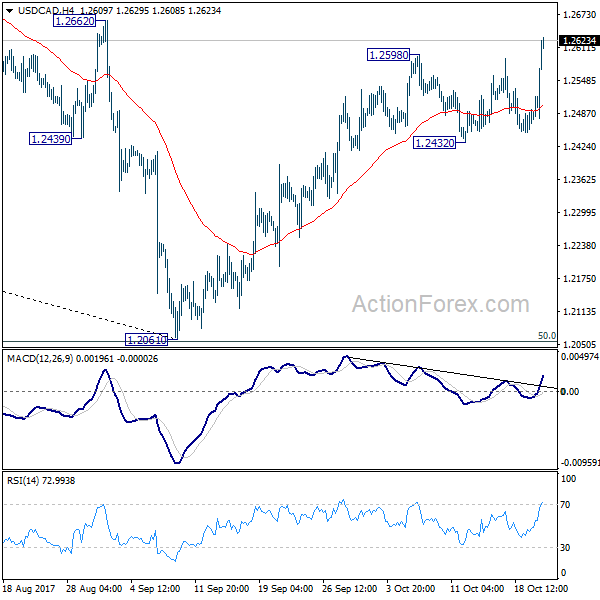
USD/CAD's break of 1.2598 last week indicates that rebound from 1.2061 has resumed. Initial bias is back on the upside this week for 1.2777 resistance first. Decisive break there will confirm medium term reversal and target 38.2% retracement of 1.4689 to 1.2061 at 1.3065 next. On the downside, break of 1.2432 support is needed to indicate completion of the rebound. Otherwise, outlook will remain mildly bullish in case of retreat.
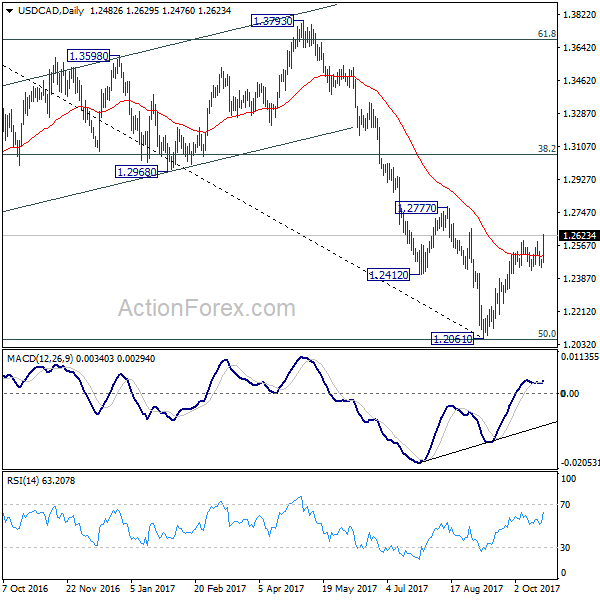
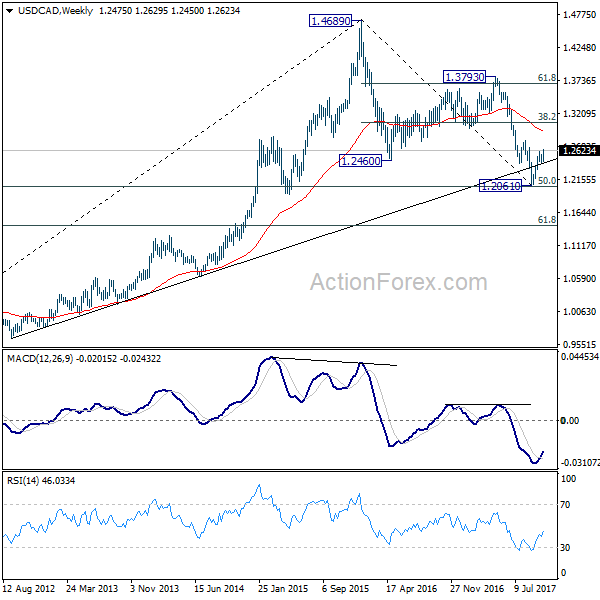
In the bigger picture, USD/CAD should have defended 50% retracement of 0.9406 (2011 low) to 1.4869 (2016 high) at 1.2048. And with 1.2048 intact, we'd favor the case that fall from 1.4689 is a correction. Break of 1.2777 will further affirm this bullish case. That is, larger up trend from 0.9406 is not completed. And in that case, USD/CAD should target 1.3793 key resistance next. However, on the other hand, firm break of 1.2048 will indicate that fall from 1.4689 is at least a medium term down trend and should target 61.8% retracement at 1.1424 and below.
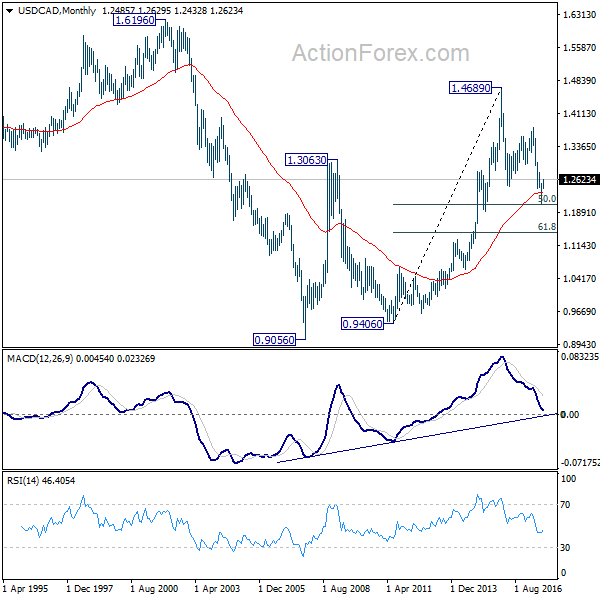
In the longer term picture, the long term outlook is turned a bit mixed. As noted above, 50% retracement of 0.9406 to 1.4869 at 1.2048 is a key level to determine whether up trend from 0.9056 (2007) has already completed.