Sample Category Title
Dow Extends above 23000 Milestone
Dow Jones hit new record high above 23000 on Wednesday. The index continues to trend higher in uncharted territory, supported by strong US economic data, upbeat earnings reports from top companies and hopes President Trump will be able to pass his tax program.
Dow moved from 22000 to 23000 milestones in exactly one month, taking half the time for advance from 21000 to 22000.
Strong uptrend from mid-Aug correction low at 21580 shows no signs of running out of steam, despite overextended daily / weekly studies.
The price is running on the third wave of five-wave sequence from 21713, which broke above its 123.6% Fibonacci extension at 23002, eyes next target at 23121 (FE 138.2%) and could travel to 23283 (FE 161.8%).
Rising 10 SMA which tracks the recent bull-leg since early Sep offers solid support at 22825.
Res: 23050; 23121; 23283; 23383
Sup: 22961; 22886; 22825; 22778
Copper Swings Sequences Calling the Rally
Hello fellow traders. In this technical blog we're going to take a quick look at the past Elliott Wave charts of Copper published in members area. In further text we're going to count the swings, explain the short term Elliott Wave view.
As our members know, Copper has had incomplete bullish sequences in larger time frames targeting 3.363 area. Consequently, we advised members to avoid selling and keep buying the dips in 3,7,11 swings. On 9th October Copper has made new short term high that made sequences bullish in the short term cycle as well. With new high we assumed that 9th swing is in progress. That means short term cycle from the 09/22 low is also having incomplete sequences . As of right now, 11th swings up are required to complete proposed cycle. We're labeling proposed cycle as a Triple Three structure. Second ((x)) connector is counted completed at 3.011 low and we're about to complete short term x red pull back. As far as the mentioned level holds, we expect further rally.
Shortly after Copper found buyers , and make further separation from the 3.011 low, eventually breaking above 09/04 peak..
Two Tall Tales
The Fed and NAFTA negotiations have stolen headlines for the past two days. We listen to what the market is saying. The US dollar was the top performer while the pound lagged. The China Party Congress starts Wednesday. UK earnings rose 2.2% but well below inflation, while employment increased by less than expected. The pound extended its losses as prospects of a Brexit resolution between the UK and EU over the divorce bill remain dim.
Speculating on the next Federal Reserve Chairman is a fun exercise but a dangerous trade. US dollar bulls got a boost on Monday about John Taylor but much of that faded later because the President gushing about a candidate is no reason to bet on rate hikes.
Four years ago, markets were playing the same schizophrenic game between Yellen and Larry Summers. At the time, it was assumed Yellen was the dove and he was the hawk. In hindsight, they might have been the opposite.
The lesson is that all the candidates are smart people and the Fed is a massive operation with thousands of employees who contribute to policy. It's doubtful the White House or any of the candidates have a genuine desire to partake in experiments when stability is the surefire way to economic progress.
The only surefire trade is to buy stocks if Yellen is reappointed.
Then there is NAFTA, which was billed as an involuntary Brexit for Canada and Mexico. Talks were extended past the year-end deadline Tuesday. That was taken as a positive sign that no one is yet-ready to walk away from the table, a sign that progress is possible.
The Mexican peso rebounded after weeks of declines but the scope of the move was still modest. The Canadian dollar hardly reacted.
If talks break down, then the trade will probably be to fade the kneejerk. The first reason for that is because there is uncertainty on whether the White House can unilaterally end NAFTA without Congressional approval - something that's unlikely. Second is that falling back on WTO rules wouldn't be a disaster for Mexico and Canada would fall back on the old FTA. In that case, the trade may be to sell all three against a broader basket.
Looking ahead, the China Party Congress has the potential to steal the agenda away from Fedtalk, Brexit-talk, Carney-talk and anything else. Expect a headline-heavy finish to the week.
GBP/JPY Low Volatility Zone Breakout Spikes the Price
The GBP/JPY formed the LVZ pattern - Low Volatility Zone exactly at the POC 147.85-148.05 and it is proceeding higher towards D H4 148.75. Strong h1 candle or 4h candle close above 148.75 suggest further bullish pressure towards 149.20-30. Looking at a daily chart in chart we can see a possibility of further strength towards 149.85 as the daily strong hammer is suggesting. Retest of 148.20-35 could also be possible and if the pair bounces again from D H3-EMA89 (148.20-35) that should be a sign of another bullish pressure towards above mentioned levels. Only below 147.80 we might see a drop towards 147.32 and bulls should lose the steam.
- H3 - Weekly Camarilla Pivot (Weekly Interim Resistance)
- W H4 - Weekly Camarilla Pivot (Strong Weekly Resistance)
- D H4 - Daily Camarilla Pivot (Very Strong Daily Resistance)
- D L3 - Daily Camarilla Pivot (Daily Support)
- D L4 - Daily H4 Camarilla (Very Strong Daily Support)
- PPR - Progressive Polynomial Channel
- POC - Point Of Confluence (The zone where we expect price to react aka entry zone)
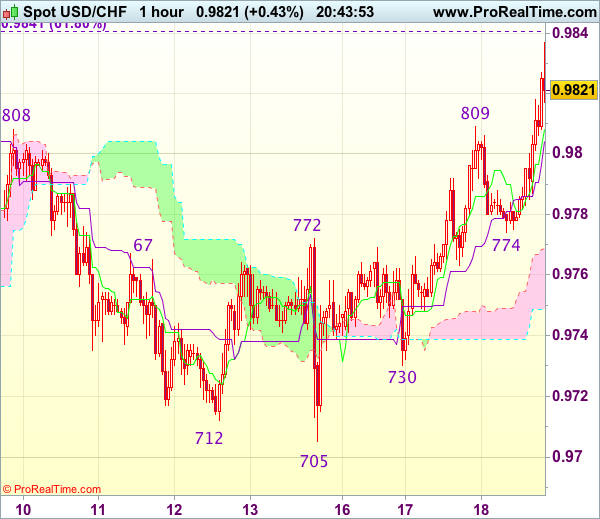
Trade Idea Update: USD/CHF – Buy at 0.9790
USD/CHF - 0.9821
Original strategy :
Buy at 0.9770, Target: 0.9870, Stop: 0.9735
Position : -
Target : -
Stop : -
New strategy :
Buy at 0.9790, Target: 0.9890, Stop: 0.9755
Position : -
Target : -
Stop : -
Dollar’s rally after finding renewed buying interest at 0.9730 signals low has been formed at 0.9705 late last week and mild upside bias remains for test of strong resistance at 0.9837, however, break there is needed to retain bullishness and confirm recent rise from 0.9421 low has resumed for headway to 0.9870 and possibly towards 0.9900.
In view of this, would not chase this rise here and would be prudent to buy dollar on pullback as 0.9785-90 should limit downside. Only a break below support at 0.9730 would abort and signal the rebound from 0.9705 has ended, bring retest of this level.
USDJPY Remains On The Offensive, Strengthens
USDJPY: The pair looks to correct further higher as it followed through higher on the back of its Tuesday gains on Wednesday. On the downside, support comes in at the 112.50 level where a break if seen will aim at the 112.00 level. A cut through here will turn focus to the 111.50 level and possibly lower towards the 111.00 level. On the upside, resistance resides at the 113.00 level. Further out, we envisage a possible move towards the 113.50 level. Further out, resistance resides at the 114.00 level with a turn above here aiming at the 114.50 level. Its daily RSI is bullish and pointing higher suggesting further strength. On the whole, USDJPY faces further bullish offensive.
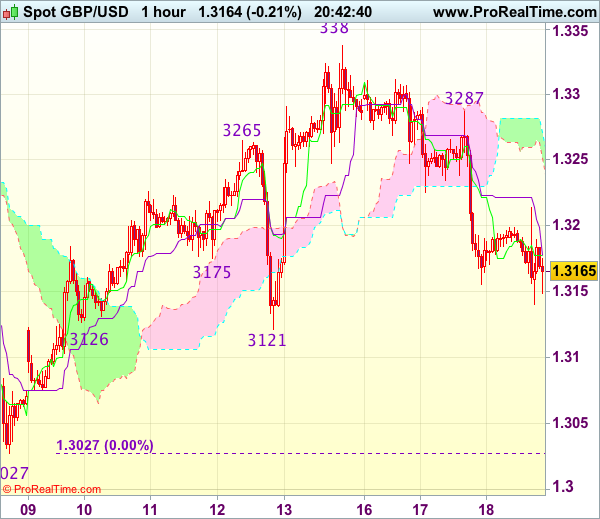
Trade Idea Update: GBP/USD – Sell at 1.3255
GBP/USD - 1.3169
Original strategy :
Sell at 1.3225, Target: 1.3125, Stop: 1.3260
Position : -
Target : -
Stop : -
New strategy :
Sell at 1.3255, Target: 1.3135, Stop: 1.3290
Position : -
Target : -
Stop : -
Yesterday’s selloff after meeting renewed selling interest at 1.3287 adds credence to our view that top has been formed at 1.3338 late last week and consolidation with downside bias remains for this move to extend further weakness to 1.3140, then towards support at 1.3121, however, break of latter level is needed to retain bearishness and bring further subsequent decline to 1.3090-00.
In view of this, wee are looking to sell cable on recovery as previous support at 1.3225 should turn into resistance and limit upside, bring another decline later. Above 1.3250-60 would risk another test of said resistance at 1.3287 but only break there would signal low is formed instead, bring rebound to 1.3300 and possibly test of resistance at 1.3312.
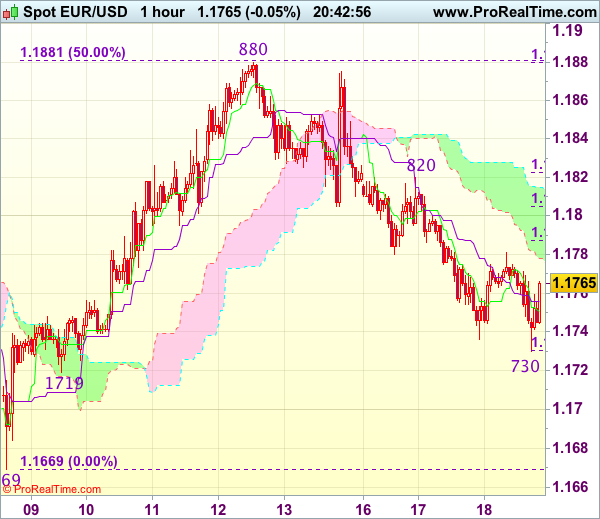
Trade Idea Update: EUR/USD – Buy at 1.1800
EUR/USD - 1.1765
Original strategy :
Sell at 1.1800, Target: 1.1700, Stop: 1.1835
Position : -
Target : -
Stop : -
New strategy :
Buy at 1.1745, Target: 1.1820, Stop: 1.1725
Position : -
Target : -
Stop : -
Although the single currency fell briefly to 1.1730, lack of follow through selling and current rebound suggest an intra-day low is possibly formed and consolidation with mild upside bias is seen for gain to 1.1790-00, however, reckon upside would be limited to 1.1820-25 and as top has been made at 1.1880, price should falter below 1.1850-55 and bring another decline later this week.
In view of this, we are looking to turn long on dips and one should exit on such rebound. Below said support at 1.1730 would signal the fall from 1.1880 top is still in progress and may extend weakness to support at 1.1719, however, break there is needed to retain bearishness and signal the rebound from 1.1669 has ended, then further decline to 1.1700 would follow.
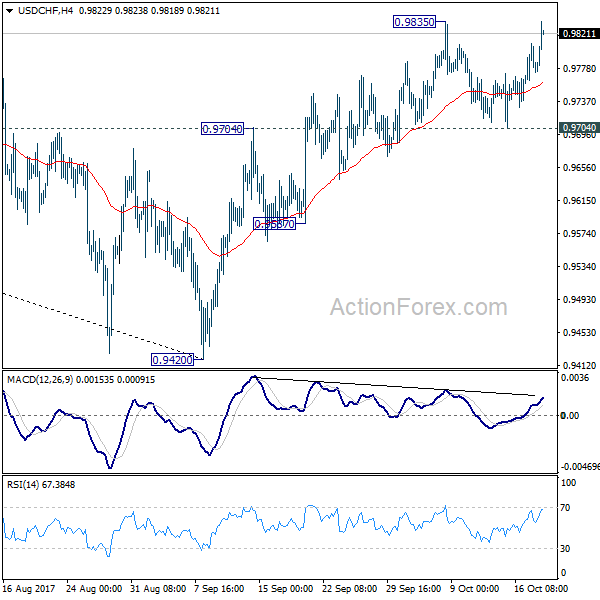
USD/CHF Mid-Day Outlook
Daily Pivots: (S1) 0.9747; (P) 0.9778; (R1) 0.9814; More....
USD/CHF rises strongly today and focus is now back on 0.9835 resistance. Decisive break there will confirm resumption of rebound from 0.9420. In that case, USD/CHF should target 61.8% retracement of 1.0342 to 0.9420 at 0.9990 next. On the downside, break of 0.9704 support will argue that rebound from 0.9420 has completed. This will also mixed up the near term outlook and turn bias back to the downside for 0.9587 support.
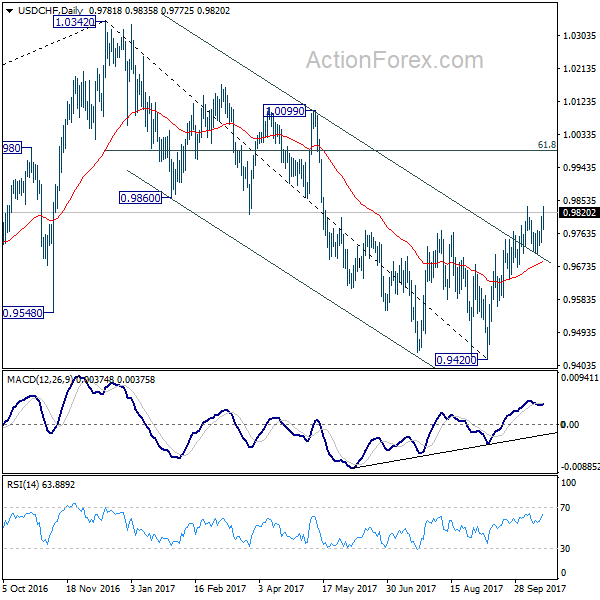
In the bigger picture, current development suggests that USD/CHF has defended 0.9443 (2016 low) key support level again. Rise from 0.9420 could develop into a medium term move and target a test on 1.0342 high. This represents the upper end of a long term range that started back in 2015. On the downside, break of 0.9587 support is now needed to indicate completion of the rise from 0.9420. Otherwise, further rally will remain in favor in medium term.
USD/JPY Mid-Day Outlook
Daily Pivots: (S1) 111.99; (P) 112.23; (R1) 112.43; More...
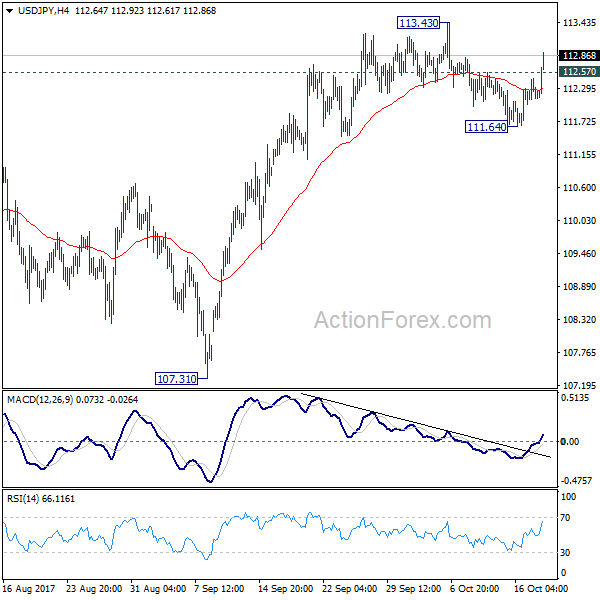
USD/JPY's strong rebound and break of 112.57 minor resistance suggests that pull back from 113.43 has completed at 111.64 already. And, rise from 107.31 is possibly resuming. More importantly, the development revives the case that correction from 118.65 has completed at 107.31. Intraday bias is now back on the upside for 113.43 first. Further break of 114.49 will confirm and pave the way to retest 118.65. However, break of 111.64 will mixed up the outlook again.
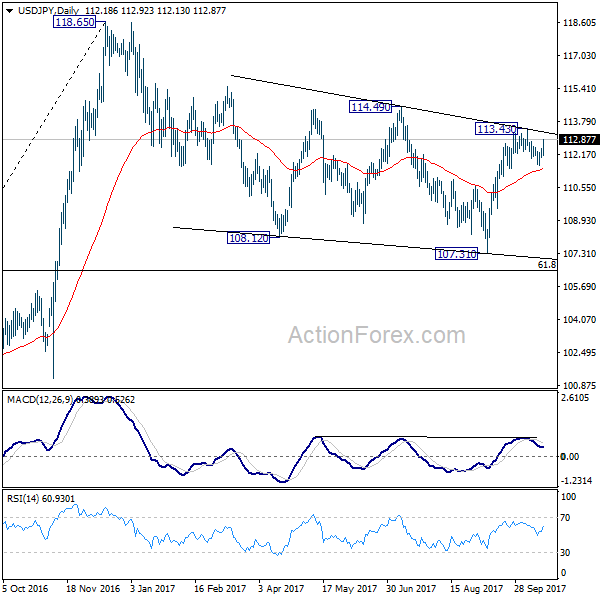
In the bigger picture, rise from 98.97 (2016 low) is seen as the second leg of the corrective pattern from 125.85 (2015 high). It's unclear whether this second leg has completed at 118.65 or not. But medium term outlook will be mildly bearish as long as 114.49 resistance holds. And, there is prospect of breaking 98.97 ahead. Meanwhile, break of 114.49 will bring retest of 125.85 high. But even in that case, we don't expect a break there on first attempt.