Sample Category Title
Foreign Exchange Market Commentary: EUR/USD, USD/JPY, GBP/USD, GOLD, WTI CRUDE, DJIA, FTSE100, DAX
EUR/USD
The EUR/USD pair fell for a third consecutive week, ending it a 1.1814 and after trading as low as 1.1716. The common currency took a dive at the beginning of the week as a result of Angela Merkel's sour victory in the German election, which brought back concerns about rising anti-global populism within the EU. An upward corrective movement that begun on Thursday was fueled on Friday by soft US data, as the Fed's favorite inflation measure, the core PCE index for August missed market's expectations. Consumer inflation rose by 0.1% in the month, matching July's reading, but below forecast of 0.2%, while when compared to a year earlier, it came in at 1.4%, below the expected 1.5%. Also, the University of Michigan’s Index of Consumer Sentiment fell 1.7 points in September to 95.1, on concerns about the economic consequences of the latest hurricanes that hit the US. Limiting EUR's advance was worst-than-expected inflation in the area, as preliminary September estimate fell to 1.1% YoY from previous 1.3%.
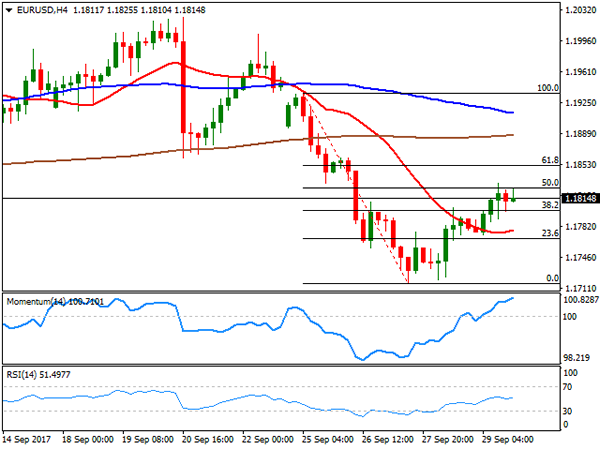
The pair's decline seems still corrective in the long-term, as it´s down around 300 pips after rising roughly 1500 pretty much straight since bottoming around 1.0600 last April, and despite the latest recovery, it could extend during the upcoming days, as the pair was unable to recover beyond August bottom in the 1.1820/30 price zone. In the daily chart, technical indicators have bounced from near oversold levels, but remain within bearish territory, indicating that selling interest is limited, although the price is well below a bearish 20 SMA, around 1.1920. The pair managed to correct half of its weekly losses, with the 50% retracement of the decline at 1.1825, converging with the mentioned lows. In the 4 hours chart, the pair presents an upward potential yet to be confirmed, as the price recovered above a now flat 20 SMA, the RSI indicator holds directionless around its mid-line, and the Momentum indicator aims north near overbought levels.
Support levels: 1.1765 1.1720 1.1690
Resistance levels: 1.1830 1.1870 1.1920
USD/JPY
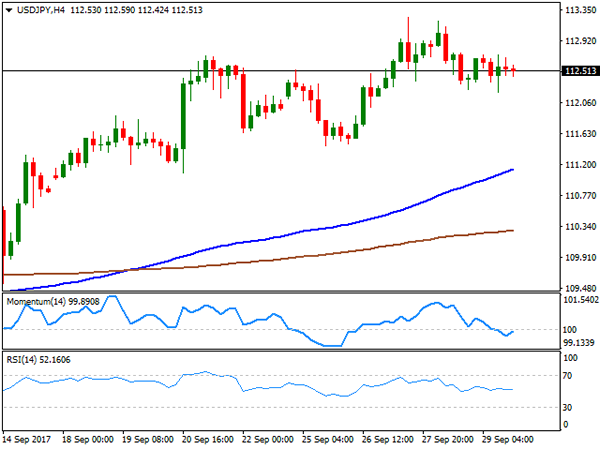
The USD/JPY pair closed the week barely higher at 112.51, undermined on Friday by poor US consumer inflation figures, which limited dollar's ability to extend its gains against the safe-haven yen. Gains in stocks and higher US Treasury yields, however, kept the Japanese currency under pressure. US treasury yields settled near fresh 11-week highs, with the 10-year note benchmark closing on Friday at 2.33%, while the S&P and the Nasdaq closed at record highs. The macroeconomic week will start with Japan releasing the Tankan manufacturing index survey for Q3, expected to show a modest improvement in activity during this last three months. Technically, the daily chart for the pair shows that it holds on to gains beyond its 100 and 200 DMAs, while technical indicators corrected overbought conditions, to turn flat well above their mid-lines, indicating that, despite the absence of upward momentum, bulls maintain the lead. Shorter term, and according to the 4 hours chart, the lack of directional strength all through the week left technical indicators within neutral territory, but the risk remains towards the upside, as the price held well above a bullish 100 SMA, now around 111.10.
Support levels: 112.20 111.85 111.50
Resistance levels: 112.90 113.25 113.60
GBP/USD
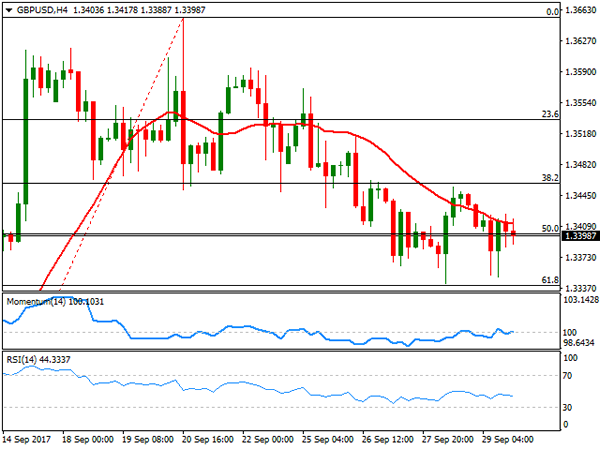
The British Pound remained under pressure this past week, ending it against the greenback at 1.3398, as news coming from the UK on Friday were overall negative. BOE´s Governor Carney said that interest rate hikes in the future will be limited and gradual if they happen, pretty much freezing expectations of a change in the economic policy for this year. Also, UK's final Q2 GDP remained unchanged at 0.3% for the three months to June, but the year-on-year figure was downwardly revised to 1.5% from an initial estimate of 1.7%. In the meantime, Brexit negotiations are going nowhere: during the weekend EU Junker claimed that there will be no sufficient progress by the end of October "unless miracles would happen." The political uncertainty alongside with an on-hold BOE should limit Pound attempts to regain the upside. From a technical point of view the daily chart shows that the weekly decline stalled at the 61.8% retracement of the latest upward move, at 1.3340, now converging with the 50% retracement of the same rally and a bullish 20 SMA. Technical indicators in the same chart hold above their mid-lines, with the Momentum trying to recover ground, but the RSI maintaining its bearish slope, this last leaning the scale towards the downside. In the 4 hours chart, however, the pair presents a neutral-to-bearish stance, as the pair remained limited below a bearish 20 SMA for most of the week, but technical indicators head nowhere around their mid-lines. A bearish acceleration through the 1.3340 support, should lead to a downward extension towards 1.3250 the next relevant static support.
Support levels: 1.3340 1.3300 1.3250
Resistance levels: 1.3410 1.3460 1.3510
GOLD
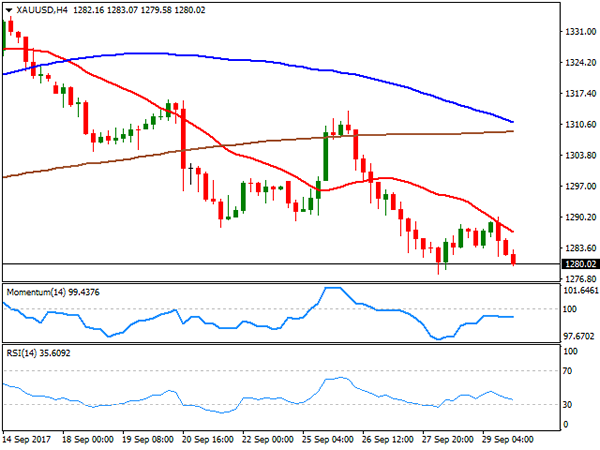
Spot gold ended September at $1,280.02 a troy ounce, as hopes that the Fed will remain in the tightening path, despite sluggish inflation, maintained market's mood up, with stocks rising to record highs to the detriment of the safe-haven metal. Gold was down roughly 3% in September after hitting at the beginning of the month its highest for this 2017, at 1,357.49, although declines were limited amid geopolitical tensions surging here and there. The negative bias remains firm in place, given that in the daily chart, the price remains well below a bearish 20 DMA, whilst technical indicators remain well into bearish territory, aiming to turn south after a period of consolidation. In the same chart, the 100 DMA stands at 1,274.56, and while directionless, the indicator is a key psychological support, with a break below it probably fueling the negative sentiment towards the metal. Shorter term, and according to the 4 hours chart, the risk is also towards the downside, with the 20 SMA accelerating south above the current level, and the RSI also showing a strong downward slope, currently at 35.
Support levels: 1,274.55 1,267.20 1,256.70
Resistance levels: 1,283.10 1.294.25 1,303.95
WTI CRUDE OIL
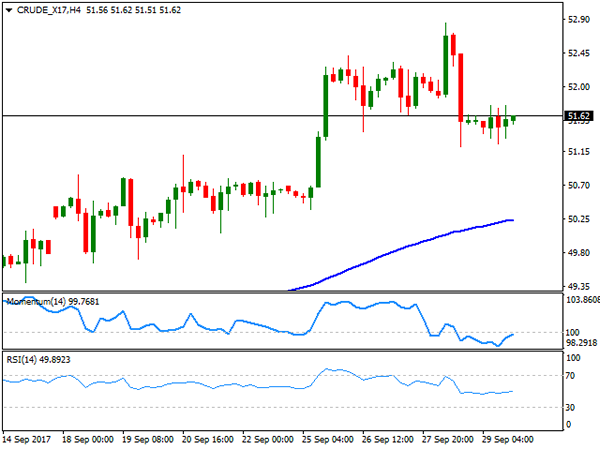
West Texas Intermediate crude oil futures closed little changed on Friday at $51.62 a barrel, as an increase in the number of US rigs drilling for oil was offset by concerns over decreasing supplies from the Kurdish region of Iraq. According to Baker Hughes, the number of active rigs drilling for oil increased by 6 this past week to 750, after falling four of the previous five weeks. The commodity holds anyway near the multi-month high reached this past week at $52.84, amid strong compliance from OPEC and non-OPEC producers with the output cut deal signed last November. US crude lost upward momentum during these last couple of days, but the daily chart indicates that the bullish trend persists, as in the daily chart, technical indicators have barely corrected from overbought readings, but the RSI indicator turned horizontal around 66, whilst the price remains far above its 100 and 200 DMAs. Shorter term, and according to the 4 hours chart, the commodity presents a neutral-to-bullish stance, with technical indicators now heading nowhere around their mid-lines, whilst the price remains far above its 100 and 200 SMAs, with the shortest accelerating above the largest.
Support levels: 51.20 50.50 50.00
Resistance levels: 51.90 52.35 52.70
DJIA
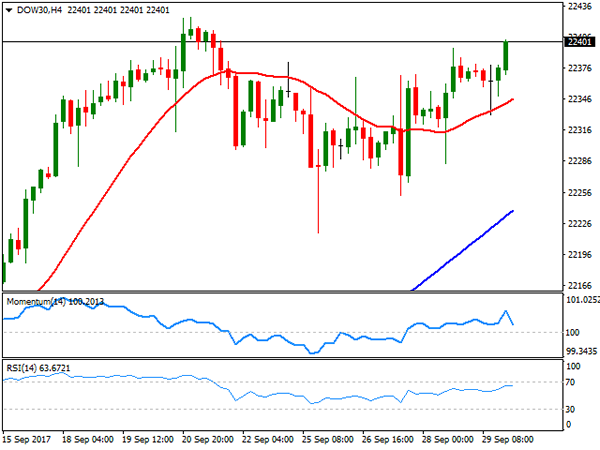
US indexes surged on Friday with the Nasdaq Composite, and the S&P ending at record highs and the Dow Jones Industrial Average not far below its own. This last, added 23 points, to close at 22,405.09 fueled by a hawkish Fed and President Donald Trump’s tax cut proposal . Adding to the positive tone of equities were news that Trump interviewed Fed´s Jerome Powell and Kevin Warsh, as possible candidates to replace Janet Yellen as head of the central bank, both seen as hawkish and more inclined to raise rates. Most members were up within the Dow, with Cisco Systems leading advancers with a 0.84% gain. Nike on the other hand, was the worst performer, down 1.48%, followed by Wal-Mart that lost 1.03%. The daily chart for the DJIA indicates that the bullish tone remains firm in place, with the index near its record high and above all of its moving averages, while technical indicators resumed their advances within positive territory. In the 4 hours chart, the index presents a neutral-to-bullish stance, with the index finding buying interest on approaches to a modestly bullish 20 SMA, but with technical indicators holding directionless above their mid-lines.
Support levels: 22,353 22,318 22,258
Resistance levels: 22,425 22,460 22,500
FTSE100
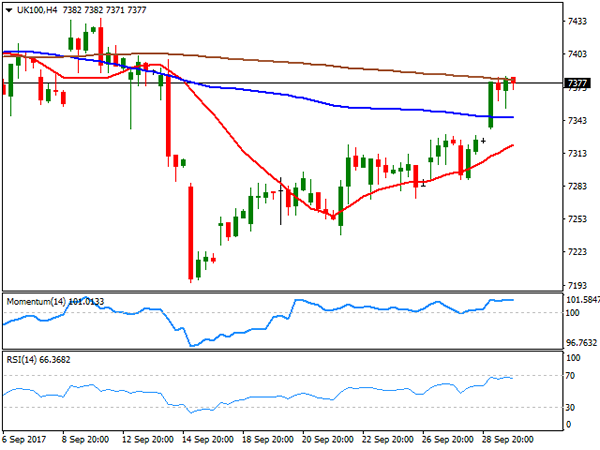
The FTSE 100 gained 50 points on Friday to close at 7,372.76, down for September but off its monthly low. A weaker Pound helped the index recover ground in the last two weeks, while at the end of this past week, worst-than-expected GDP data exacerbated Sterling's decline. Miners were among the best performers, as despite gold's decline, most base metals ended the month on a higher note. The best performer was ITV that added 3.56%, followed by Anglo American and Antofagasta that added over 2.0% each. Hargreaves Lansdown led decliners, down 1.14%. The daily chart for the Footsie shows that, while the bearish pressure has eased, the index is still far from entering bullish territory, as it closed below its 100 DMA, while the Momentum indicator remains within negative territory. The index also settled above a still bearish 20 SMA, whilst the RSI aims higher around 54, limiting chances of a steeper decline for the upcoming days. In the 4 hours chart, the index was unable to advance beyond a marginally bearish 200 SMA, but established above a bullish 20 SMA, also above the 100 SMA, while technical indicators consolidate well above their mid-lines supporting additional gains ahead on a break above 7,383, Friday's high and the immediate resistance.
Support levels : 7,354 7,312 7,282
Resistance levels: 7,383 7,422 7,461
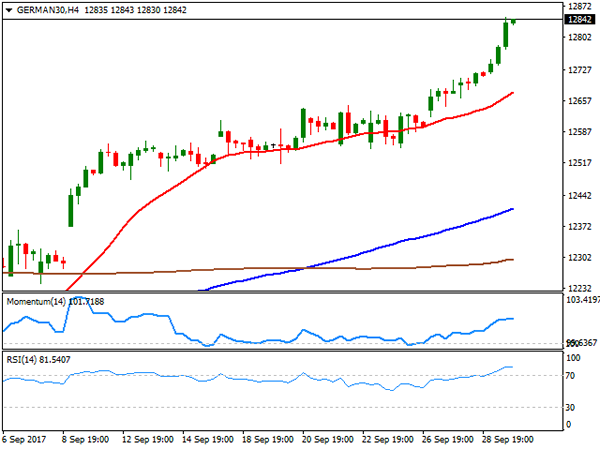
DAX
European equities surged on the last trading day of the month, with the German DAX closing at 12,828.86, up 125 points or 0.98%, its highest in three months. A solid macroeconomic recovery in the region, coupled with a cheaper EUR and optimistic markets over US economic and monetary policy future, helped indexes advance sharply this past week. Bayer was the best performer on Friday, up 2.35%, followed by E.ON which added 2.35%, whilst just five members closed down, led by Merck that shed 3.43%. The German benchmark retains its bullish tone heading into the new week according to the daily chart, with the 20 DMA advancing above the 100 DMA, and the RSI indicator heading north within overbought readings, currently at 73. In the shorter term, and according to the 4 hours chart, the risk is also towards the upside, as the index is far above all of its moving averages, whilst technical indicators have barely pared their advances within overbought territory.
Support levels: 12,796 12,752 12,710
Resistance levels: 12,847 12,881 12,933
Forex Technical Analysis: EUR/USD, USD/JPY, GBP/USD
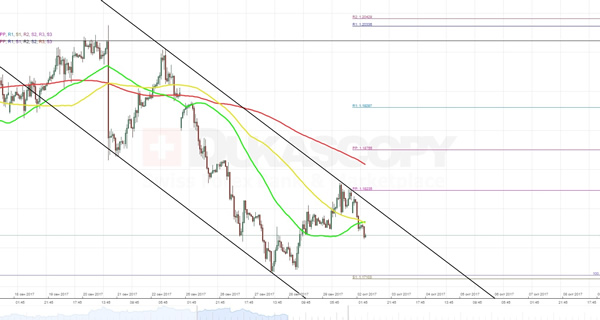
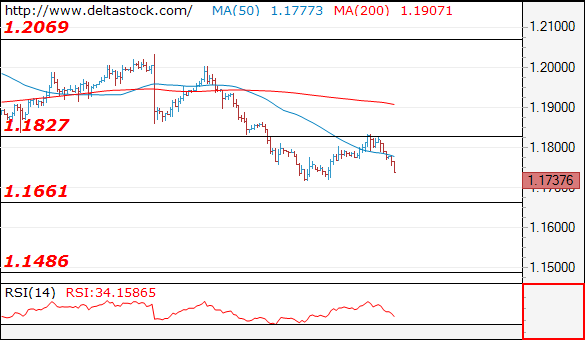
EUR/USD
Current level - 1.1737
The resistance at 1.1830 has capped the upside and my outlook is bearish, for a break through 1.1715 low, towards 1.1660 and 1.1480.
| Resistance | Support | ||
| intraday | intraweek | intraday | intraweek |
| 1.1830 | 1.2070 | 1.1660 | 1.1660 |
| 1.2000 | 1.2240 | 1.1540 | 1.1480 |
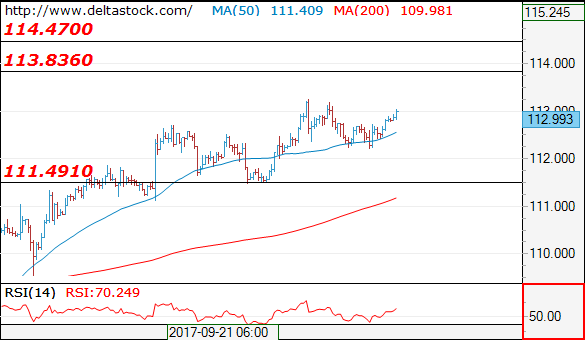
USD/JPY
Current level - 112.99
The bias is positive, for a rise towards 113.80, en route to 114.50 peak. Initial support lies at 112.15 and crucial on the downside is 111.50.
| Resistance | Support | ||
| intraday | intraweek | intraday | intraweek |
| 113.30 | 113.80 | 112.15 | 111.50 |
| 113.80 | 114.50 | 111.50 | 107.30 |
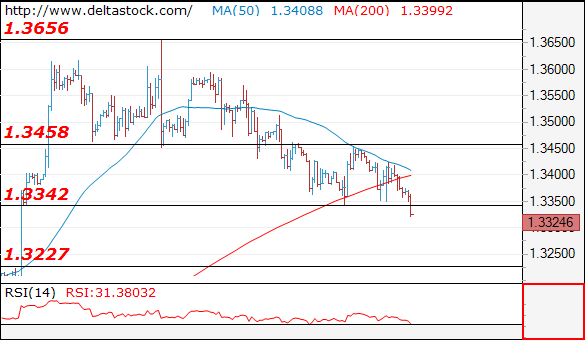
GBP/USD
Current level - 1.3324
The recent test at 1.3460 failed and the outlook is bearish, for a slide towards 1.3220 zone. Initial intraday resistance lies at 1.3350.
| Resistance | Support | ||
| intraday | intraweek | intraday | intraweek |
| 1.3350 | 1.3650 | 1.3300 | 1.3340 |
| 1.3460 | 1.3830 | 1.3220 | 1.3150 |
Technical Outlook: AUDUSD – Bears Probe Again Through Daily Cloud Base, RBA Rate Decision On Tuesday In Focus
The Aussie probes again through strong supports at 0.7800 zone (daily cloud base / 15 Aug former low) as Monday's action stands firmly in red and extends weakness from last Friday.
Close below daily cloud will be strong bearish signal for extension of bear-leg from 0.8102 (also the third wave of five-wave cycle from 0.8124 peak) towards its FE 176.4% at 0.7777 and 100SMA at 0.7766, with extension towards 0.7733 (FE 200%) seen on break of the latter.
Oversold daily studies warn of correction which may result in hesitation ant 0.7800 pivot.
Session high at 0.7847 marks initial resistance, followed by last Thursday's high at 0.7860.
Top of daily cloud marks key near-term barrier at 0.7811.
Focus is on tomorrow's RBA interest rate decision, with the central bank expected to keep rates unchanged at 1.5%.
Res: 0.7820, 0.7847, 0.7888, 0.7911
Sup: 0.7795, 0.7777, 0.7766, 0.7733
Gold Holds Bearish Bias In Short And Medium Term, Downside Risk Remains High
Gold Holds Bearish Bias In Short And Medium Term, Downside Risk Remains High
Gold holds a bearish bias both in short and medium-term time frames. The market is continuing its downward trajectory from the September 8 high of 1357.47 with little indication of stopping. Trend indicators and momentum oscillators are suggesting that risk remains to the downside.
Studies on the 4-hour chart show a bearish crossover of the 20 and 50-period moving averages that took place on September 13. The negative alignment and sharp slope down of both moving averages point to deeper declines. The next target to the downside is at 1262.25 ahead of the August 8 low of 1251.49. From this point, downside momentum would strengthen and open the way towards the July 7 low of 1204.79.
The RSI indicator on the 4-hour chart is approaching oversold levels at 30 which could suggest that downward pressure may ease for now. Should gold prices bounce higher and rise above 1280, then 1300 would come into view. Any further rise from this pivotal level would shift focus to the upside towards 1315 and then from here, 1342 is expected to be an important barrier. Only a move above the 1354.47 peak would help increase upside momentum to bring about a resumption of the uptrend that started from 1204.79.
The short-term trend is expected to remain bearish as long as the market is capped by the 20-period MA and unless gold prices can reclaim the 1300 handle soon.
USD Rally Amid EU Uncertainty And Potential Hawkish Shift At The Fed
USD and treasury yields better bid amid speculation about hawkish shift at the head of the Fed
The US dollar bounced back on Monday, extending gains against almost all of its peers. The uncertainty generated by the Catalan situation has also forced traders to pull out of the single currency. Over the last few months, the euro had won the favour of investors at the expense of the greenback, amid rising uncertainty in the US political outlook as well as lacklustre economic data. Now that Republicans seemed that have found a common about the much awaited tax reform, investors are more optimistic about the inflation and growth outlook in the world’s largest economy.
Last Friday, the release of disappointing PCE readings had only little effect on the investors’ optimism as both US treasury yields and the greenback quickly bounced back. The US 10-year sovereign rate rose to the highest level since July 11th, hitting 2.364%, while the dollar index returned to 93.60 after falling to 92.95 last week. One must be said that the speculations surrounding a potential shift at the head of the Federal Reserve, with the possible removal of Janet Yellen for a more hawkish candidate such as Kevin Warsh, has fuelled the yield rally.
We maintain our bullish on the US dollar as we believe the market hasn’t fully priced the upcoming rate hike together with the balance sheet reduction program, yet. However, we would stay cautious regarding further EUR weakness against the USD as another push, which can the take the form of a worsening of the Catalan situation, is needed.
Spanish vote triggers slight euro weakness
The Catalan referendum has brought a very important question in centre stage. Do people have in Europe the self-determination right? It seems that the answer is a big no. Spanish Prime minister declared that there was not vote (i.e. legal) vote in Catalonia. Anyway the police violence have been used and it definitely drove “No” voters to stay at home. As a result this has created this surprising result: 90% of Catalonians are in favour of the independence vote.
This is then weakening the Spanish central power and European nations are being weekend by regionalists. Amid the vote, the single currency has slightly declined but remained above 1.17 USD. We believe the impact of this vote won’t weaken the European Union. We rather consider that a weaker Spain would benefit to the European Union. European Union does not need nations.
According to us, the Catalonian vote won’t trigger a political crisis in Europe, even in the short-term. However this vote reveals the economic underlying difficulties of Spain. Catalonia is the richest region in Spain and is not accepting to “pay for everyone”.
EUR/USD 1.1725-1.1690 Is The Important Zone
The EUR/USD has been retreating from Friday's highs due to yesterday's events in Catalonia. Spanish IBEX opened lower while other European equities were mixed. The EUR/USD is trying to reach 1.1725-1.1690 zone where it could decide about the next direction. A bounce from the zone could target 1.1740 followed by 1.1828. Only a 4h or daily close above 1.1828 might return the pair into the positive progressive channel. If the pair drops below 1.1690, it could be trapped in the bearish AP (Andrew's Pitchfork) and we might see the return of the bearish trend towards 1.1592.
W H3 - Weekly Camarilla Pivot (Weekly Interim Resistance)
W H4 - Weekly Camarilla Pivot (Strong Weekly Resistance)
D H4 - Daily Camarilla Pivot (Very Strong Daily Resistance)
D L3 – Daily Camarilla Pivot (Daily Support)
D L4 – Daily H4 Camarilla (Very Strong Daily Support)
POC - Point Of Confluence (The zone where we expect price to react aka entry zone)
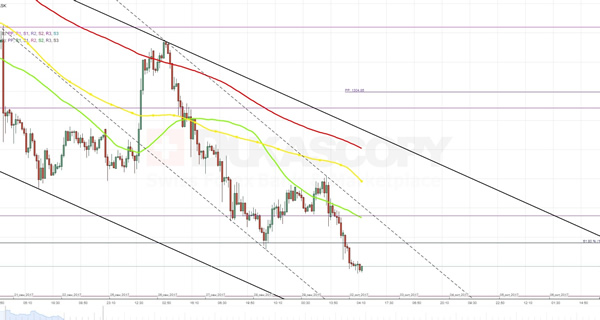
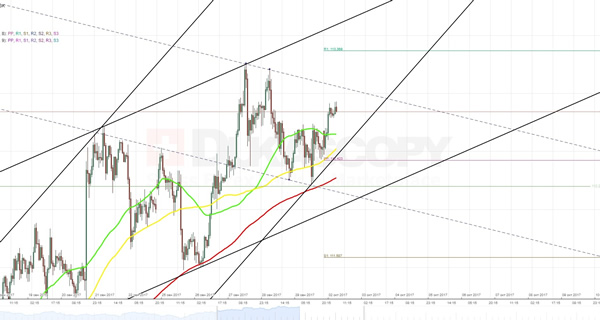
XAUUSD Analysis: Breaks 61.8% Fibonacci Retracement Level
Due to release of another set of the US inflation and consumer spending data, which did not change the overall prospect about the upcoming interest rate hike, the buck managed to drag the bullion through the 61.8% Fibo level at 1,278.96, thus confirming an existence of a new descending channel. Although this breakthrough happened a little bit earlier than expected, but it still perfectly fit into the general picture, in which the rate was expected to gradually move to the bottom, trying to reach the lower edge of a dominant ascending channel. Nevertheless, during this trading session the pair is likely to make a temporary rebound near the 1,273.14 level, which represents location of the 100-day SMA. If such scenario materializes, the junior channel might transform into a falling wedge.
USDJPY Analysis: Surges Towards Updated Weekly R1 At 113.36
Despite a certain volatility that was caused by a release of information on the US consumer spending, the pair continued to gradually climb to the top, as expected. In the first half of Monday, the rate is likely to cross the upper trend-line of a junior descending channel and continue to head towards the updated weekly R1 at 113.36. Such scenario is supported by the 55-, 100- and 200-hour SMAs as well as the weekly PP, which are all located below the current market price.
The only event that has a chance to push the currency pair in the opposite direction is a release of US ISM Manufacturing PMI at 14:00 GMT. Otherwise, the pair is projected to head to the north, fluctuating in a senior ascending channel.
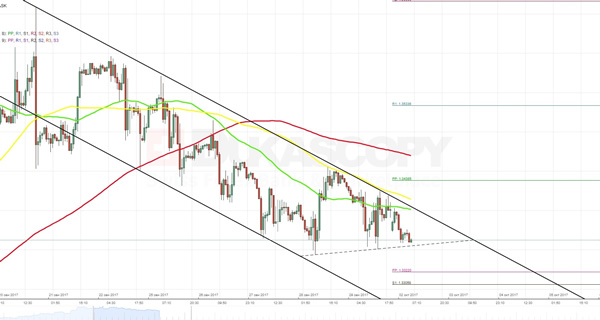
GBPUSD Analysis: Fails To Break Above 55- And 100-Hour SMAs
In accordance with expectations, a combination of the 55- and 100-hour SMAs as well as the former monthly R2 did not let the pair to make any notable advances on Friday. In fact, they continued to push it to the bottom, simultaneously forcing to form a minor symmetrical triangle. Due to release of a whole bunch of various fundamental data during this week, it is difficult to project how the pair is going to move. The only thing that can be said for sure is that the northern path is secured by numerous technical indicators, such as the 200-hour SMA and the 50% Fibonacci retracement level at 1.3503. In addition to that, the pair has recently made a rebound from the upper boundary of a long-term descending channel. Hence, the gradual slip to the bottom remains a more plausible scenario.
EURUSD Analysis: Slips On Catalan Referendum
In line with expectations, the currency exchange rate managed to break to the top, crossing the 100-hour SMA plus another resistance level near 1.1810. During the two-day surge the pair even formed a little ascending channel. But due to referendum on independence in Catalonia the Euro lost 0.3% against the Dollar and fell out of the channel. The fact that now the pair is located below a combination of the 55- and 100-hour SMAs, suggests that might continue to the move to the bottom. The downfall might be additionally spurred by the official comments from the EU, Catalan and Spanish governments through the day. However, this event is unlikely to change the general scenario, according to which the rate is expected to continue to climb to the top after bouncing off from the 100% Fibo at 1.1715.