Sample Category Title
EURJPY Resumes Broader Uptrend, Remains On The Offensive
EURJPY: The pair remains offensive following its trend resumption the past week. On the downside, support comes in at the 133.00 level where a break if seen will aim at the 132.50 level. A cut through here will turn focus to the 132.00 level and possibly lower towards the 131.50 level. On the upside, resistance resides at the 132.00 level. Further out, we envisage a possible move towards the 133.50 level. Further out, resistance resides at the 134.00 level with a turn above here aiming at the 134.50 level. On the whole, EURJPY faces further bull pressure in the days ahead.
Trade Idea: EUR/GBP – Sell at 0.8900
EUR/GBP - 0.8820
Original strategy :
Sell at 0.8900, Target: 0.8780, Stop: 0.8940
Position : -
Target : -
Stop : -
New strategy :
Sell at 0.8900, Target: 0.8780, Stop: 0.8940
Position : -
Target : -
Stop : -
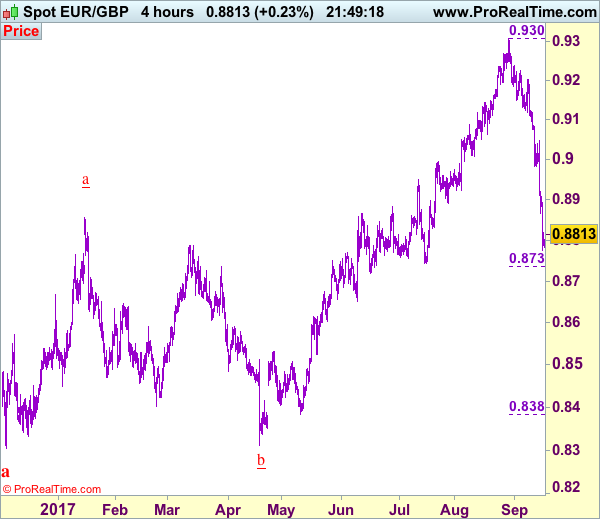
The single currency recovered after falling to 0.8774 on Friday, suggesting minor consolidation above this level would be seen and corrective bounce to 0.8850-60 is likely, however, reckon upside would be limited to resistance at 0.8907 and bring another decline later, below said support at 0.8774 would signal the reversal from 0.9307 top is still in progress and bearishness remains for this fall to extend weakness towards 0.8737-43 (61.8% Fibonacci retracement of 0.8384-0.9307 and previous support) but near term oversold condition should limit downside to 0.8719 support and reckon another previous chart support at 0.8652 would hold, bring rebound later.
In view of this, would not chase this fall here and we are looking to sell euro on recovery as resistance at 0.8907 would limit upside and bring another decline later. Above 0.8940-50 would defer and risk a stronger rebound to 0.8975-80 but price should falter below 0.9000 and bring another selloff next week.
Our preferred count is that, after forming a major top at 0.9805 (wave V), (A)-(B)-(C) correction is unfolding with (A) leg ended at 0.8400 (A: 0.8637, B: 0.9491 and 5-waver C ended at 0.8400. Wave (B) has ended at 0.9413 and impulsive wave (C) has either ended at 0.8067 or may extend one more fall to 0.8000 before prospect of another rally. Current breach of indicated resistance at 0.9043 confirms our view that the (C) leg has ended and bring stronger rebound towards 0.9150/54, then towards 0.9240/50.
Trade Idea: USD/CAD – Hold short entered at 1.2240
USD/CAD - 1.2195
Trend: Down
Original strategy :
Sold at 1.2240, Target: 1.2080, Stop: 1.2240
Position: - Short at 1.2240
Target: - 1.2080
Stop: - 1.2240
New strategy :
Hold short entered at 1.2240, Target: 1.2080, Stop: 1.2240
Position: - Short at 1.2240
Target: - 1.2080
Stop:- 1.2240
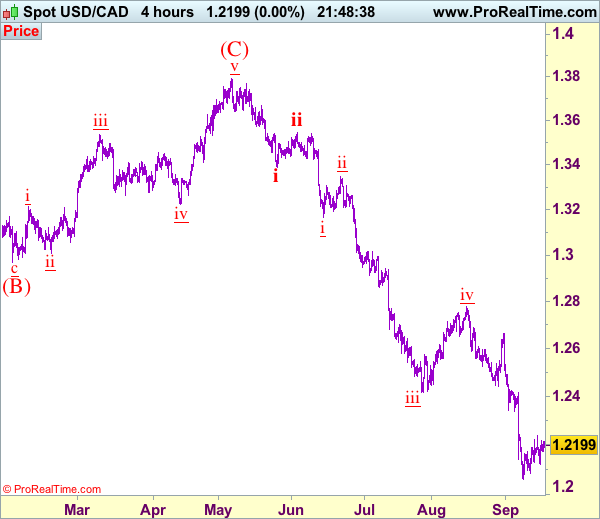
Although the pair rebounded after finding support at 1.2121 on Friday, retaining our view that further consolidation would take place, however, as long as indicated resistance at 1.2240 holds, bearishness remains for recent decline to resume after consolidation, below said support at 1.2121 would signal the rebound from 1.2061 has ended, bring retest of this level later, below there would confirm recent decline has resumed and extend weakness towards psychological support at 1.2000 but loss of downward momentum should prevent sharp fall below 1.1950-60, bring rebound later. We are keeping our count that wave v as well as wave (C) ended at 1.3794 and impulsive wave (i ii, i ii) is now unfolding with minor wave iii ended at 1.2414, followed by wave iv correction ended at 1.2778, wave v has reached our indicated downside target at 1.2100 and may extend to 1.2000.
In view of this, we are holding on to our short position entered at 1.2240. Above 1.2240-50 would risk rebound to 1.2300 but only break there would defer and signal a temporary low has been formed, bring a stronger rebound to 1.2335-40, however, upside should be limited to resistance at 1.2429 and price should falter well below 1.2490-00.
To recap, wave B from 1.3066 is unfolding as an a-b-c and is sub-divided as a: 1.2192, b: 1.2716 and wave c is a 5-waver with i: 1.1983, ii: 1.2506, extended wave iii with minor iii at 1.0206, wave iv ended at 1.0781 and wave v as well as wave iii has ended at 0.9931, hence the subsequent choppy trading is the wave iv which is unfolding as (a)-(b)-(c) with (a) leg of iv ended at 1.0854, followed by (b) leg at 1.0108 and (c) leg as well as the wave iv ended at 1.0674. The wave v is sub-divided by minor wave (i): 0.9980, (ii): 1.0374, (iii): 0.9446, (iv): 0.9913 and (v) as well as v has possibly ended at 0.9407, therefore, consolidation with upside bias is seen for major correction, indicated target at 1.3700 and 1.4000 had been met and further gain to 1.4700 would be seen later.
Are the Markets Right to Ignore the German Election?
She has seen a key world economy through a global financial crash, presided over the biggest refugee crisis in living memory, out-served no fewer than three US Presidents, and driven German unemployment rates to a record low. With a general election just three weeks away, is Angela Merkel poised to add another four years to her term in office? FXTM's VP of Market Research and Corporate Development, Jameel Ahmad, explores what the German election could mean for the eurozone.
The Euro closed trading last week (1 September) high against both the dollar and sterling, pushing the $1.20 mark for the first time in two and a half years. Given that the financial markets have spent the last 12 months riding the waves of political uncertainty and shock election results, you could be forgiven for thinking this news heralds the start of a calmer period. But the EU still has one major hurdle left to jump.
The German Election, scheduled for 24 September, has the potential to squeeze the recent EUR gains. For the moment, the markets seem unconcerned, and happy to assume that Angela Merkel will remain firmly at the tiller of the eurozone's leading nation. The polls certainly support this theory, and Merkel's Christian Democratic Union (CDU) and its counterpart, the Christian Social Union (CSU), are expected to maintain power; a ZDF poll published on Friday shows the two leading with 39% support. An all-out majority in the Bundestag is unlikely – the CDU and CSU currently rule in coalition with the Social Democratic party (SPD); it remains to be seen which of the smaller parties will have enough clout to be a part of the coalition.
To assume that Merkel will win and the status quo maintained, is narrow-sighted at best. The examples from the EU referendum and US election in 2016 show that investors should not underestimate the risks of underpricing heading into a vote. Merkel may have a significant number of economic and social achievements under her belt, but these have a tendency to be overlooked by voters.
The reported 15-20 point margin, may be enough to allay market fears for now, but Merkel is thought to face stiff opposition from the SPD's new leader (and former President of the European Parliament) Martin Schulz. His appointment in January boosted the popularity of the party, making it a true contender for the first time in this election cycle.
A loss for Merkel, or a Theresa May-style - limping victory, would have a significant impact on financial market fluctuations, and quite possibly on European economic health. The improved sentiment around Europe this year makes it the destination of choice for investments, with major European equities and the Euro enjoying a revival.
French President Emmanuel Macron may find himself in the unexpected position of becoming the premier force in the European Union. With an integrationist agenda that rivals that of both Merkel and Schulz, Macron could be expected to expedite plans for common tax policies and a eurozone spending ministry. He would also ensure that the divorce settlement for the UK is tough, and any conflict at the Brexit negotiation table will only add to the uncertainty that has already contributed to GBP losses.
Political commentators agree that the German public have very little appetite for reform, and the global expectation is that come 25 September, Angela Merkel will once more be safely ensconced in the Chancellery. It's an outcome the financial markets seem to be buying into.
Whether that's wishful thinking or well-founded confidence remains to be seen; but given the results of other major elections and the historic EU referendum, it would hardly surprise me if in three weeks' time, I found myself writing about the shock German vote and increased market volatility.
USDJPY Tests Resistance Confluence
The USDJPY has opened the new trading week with renewed bullish trading momentum, with the pair moving to an eight-week trading high, hitting 111.42, during the European trading session.
Price-action is currently trading around a confluence of critical technical resistance, with both daily and weekly 200-period moving averages, and the USDJPY monthly pivot point all situated within a 20-pip radius of each other.
The USDJPY pair threatens further bullish advancement whilst trading above the 110.68, a series of higher-frame price closes above the 111.65 level would signal a major upside technical break-out.
Key intraday technical resistance is located at 111.48, 111.58 and 111.65. Above the 111.65 level, price-action should initially target 112.30 and 112.80.
To the downside, key technical support is located at the 100-week moving average, at 111.17, with further support at 111.04.
Below the 111 level, further intraday support is found at 110.84 and 110.68.
EURUSD Tests Upside of Narrow Range
The EURUSD pair is attempting to recover bullish trading momentum, after briefly dipping below its weekly pivot point, and finding strong intraday buying interest from the 1.1915 level.
Price-action is currently trading around the 1.1960 region, after finding interim resistance from the 1.1969 level. The EURUSD pair remains intraday bullish while holding above the key 1.1957 technical level.
Traders should now look for technical price-closes above the 1.1979 level, for further confirmation of a continuation in EURUSD upside.
Key technical resistance above the 1.1979 level is located at 1.1999, 1.2030-40 and the former yearly price-high, at 1.2069.
Should price move back below the 1.1957 level, key intraday EURUSD support is found at the daily pivot point, at 1.1946, with the weekly pivot point, at 1.1938.
Below the 1.1938 level, further technical support is found at 1.1915, 1.1889 and 1.1870.
EUR/USD Mid-Day Outlook
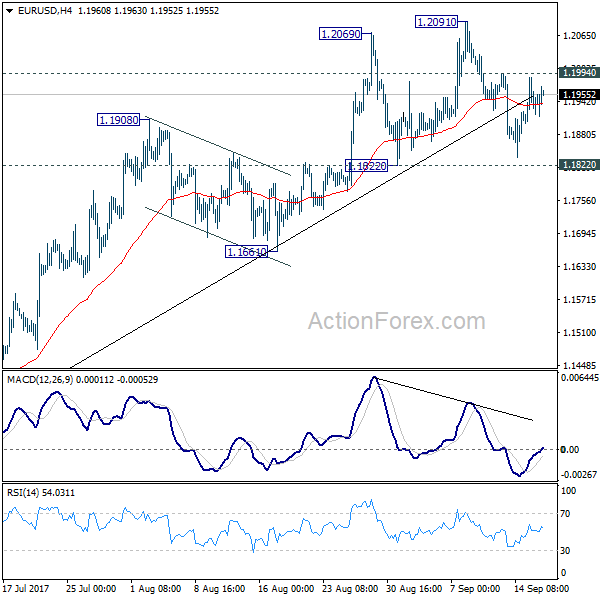
Daily Pivots: (S1) 1.1862; (P) 1.1892 (R1) 1.1947; More...
Intraday bias in EUR/USD remains neutral for the moment. With 1.1822 support intact, near term outlook stays bullish for another rise. Above 1.1994 minor resistance will turn bias to the upside for 1.2091 first. Break there will extend larger rise from 1.0339 and target next key fibonacci level at 1.2516. But considering bearish divergence condition in 4 hour MACD, break of 1.1822 will confirm short term topping and bring deeper fall back to 1.1661 support and below.
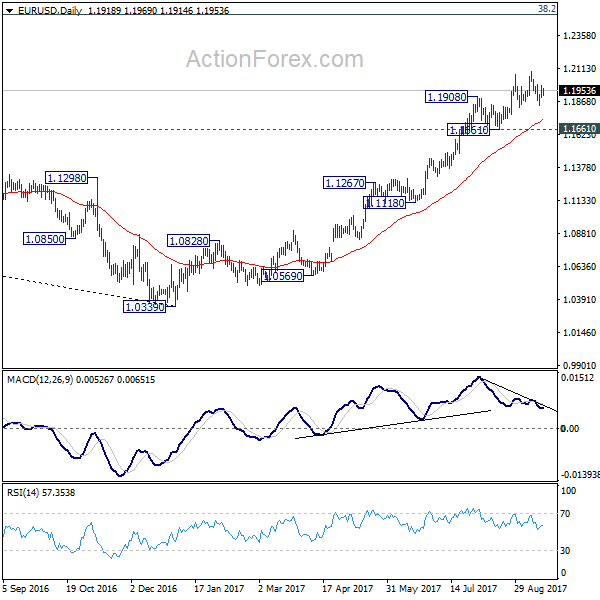
In the bigger picture, rise from medium term bottom at 1.0339 is still in progress for 38.2% retracement of 1.6039 (2008 high) to 1.0339 (2017 low) at 1.2516. However, it should be noted that there is no confirmation of trend reversal yet. That is, such rebound from 1.0399 could be a correction. And the long term fall fro 1.6039 (2008 high) could resume. Hence, we'd be cautious on strong resistance from 1.2516 to limit upside. But after all, break of 1.1661 is needed to indicate medium term topping. Otherwise, outlook will remain bullish in case of pull back.
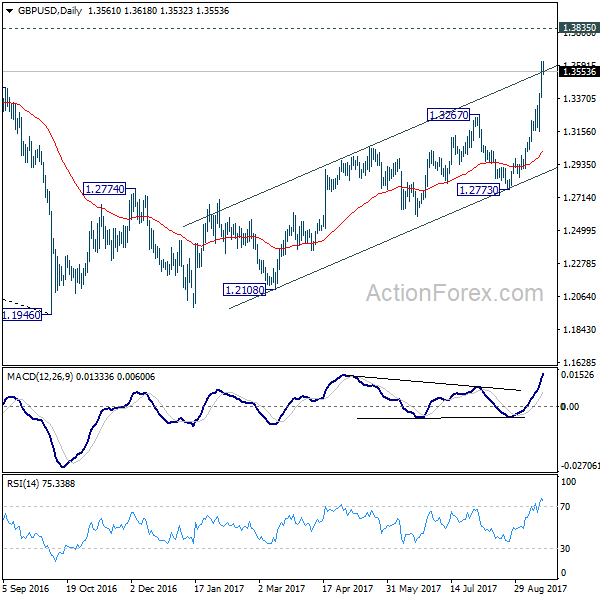
GBP/USD Mid-Day Outlook
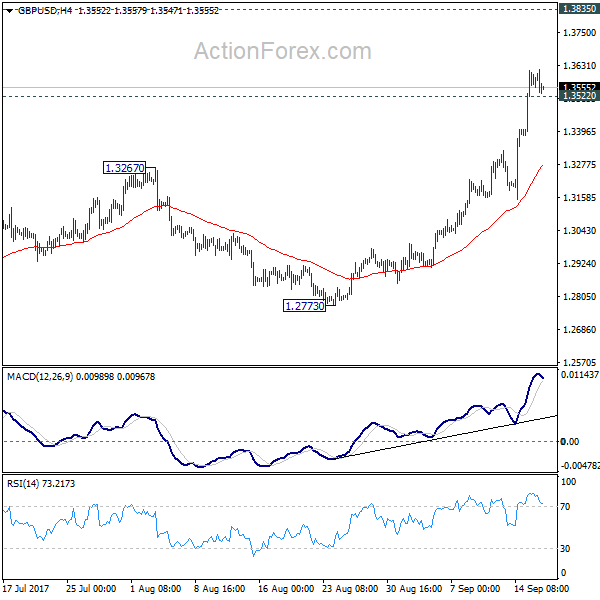
Daily Pivots: (S1) 1.3435; (P) 1.3526; (R1) 1.3674; More....
With 1.3522 minor support intact, intraday bias in GBP/USD remains on the upside for 1.3835 support turned resistance next. Break there will target 55 month EMA (now at 1.4405). On the downside, below 1.3522 minor support will turn intraday bias neutral and bring consolidations, before staging another rally.
In the bigger picture, the strong break of 1.3444 key resistance now argues that the long term trend in GBP/USD has reversed. That is a key bottom was formed back in 1.1946 on bullish convergence condition in monthly MACD. Current rise from 1.1946 will target 38.2% retracement of 2.1161 (2007 high) to 1.1946 (2016 low) at 1.5466 next. In any case, medium term outlook will now stay bullish as long as 1.2773 support holds.
Trade Idea Update: USD/CHF – Sell at 0.9645
USD/CHF - 0.9597
Original strategy :
Sell at 0.9645, Target: 0.9545, Stop: 0.9680
Position : -
Target : -
Stop : -
New strategy :
Sell at 0.9645, Target: 0.9545, Stop: 0.9680
Position : -
Target : -
Stop : -
Although the greenback has recovered after finding support at 0.9565 on Friday and consolidation above this level would be seen, if our view that top has been made at 0.9705 last week is correct, reckon upside would be limited to minor resistance at 0.9648 and bring another decline later, below 0.9563-65 (50% Fibonacci retracement of 0.9421-0.9705 and said support) would extend weakness to 0.9525-30 (61.8% Fibonacci retracement), however, downside should be limited to 0.9500 and 0.9480-85 should hold.
In view of this, would not chase this fall here and would be prudent to sell dollar again on further recovery as 0.9648 should limit upside. Above 0.9680 would risk retest of said last week’s high at 0.9705, break there would extend recent rise from 0.9421 to 0.9740-50 later.

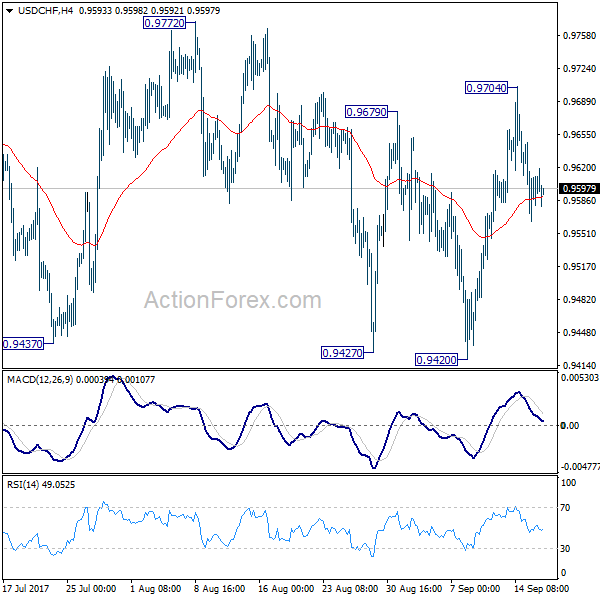
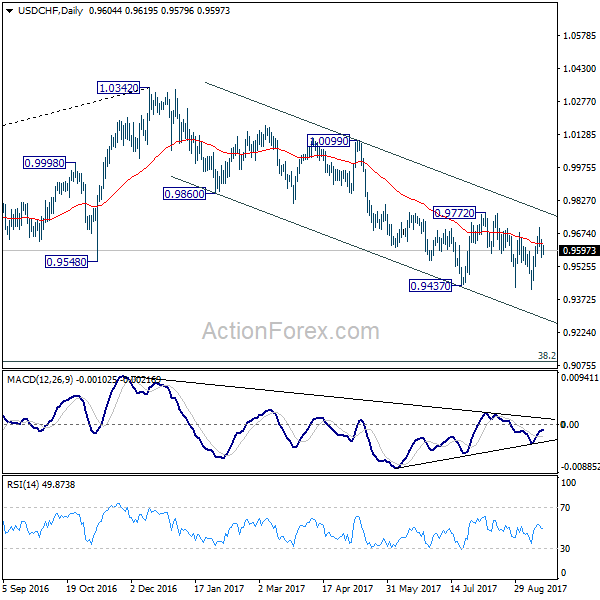
USD/CHF Mid-Day Outlook
Daily Pivots: (S1) 0.9556; (P) 0.9602; (R1) 0.9638; More....
Intraday bias in USD/CHF remains mildly on the downside for 0.9420 support. With 0.9772 resistance intact, outlook remains bearish. Break of 0.9420 will resume medium term fall from 1.0342 and target next long term fibonacci level at 0.9090. However, firm break of 0.9772 will indicate trend reversal and turn outlook bullish.
In the bigger picture, current development suggests that 0.9443 key support (2016 low) could be taken out firmly as down trend form 1.0342 extends. There are various interpretation of the price actions. But in any case, medium term outlook will stay bearish as long as 0.9772 resistance holds. Current down trend could extend to 38.2% retracement of 0.7065 (2011 low) to 1.0342 (2016 high) at 0.9090. However, break of 0.9772 will indicate that USD/CHF has successfully defended 0.9443 again and turn outlook bullish for 1.0099 resistance.