Sample Category Title
Daily Technical Analysis: USD/JPY Risk On Sentiment Pushing The Pair Towards 112 Zone
The USD/JPY is being pushed towards next resistance by the backwind of risk on sentiment that is currently dominating the Forex market. When risk on sentiment is prevailing Gold goes down, Commodities are up, Equities are up and Yen weakens as a result. Adding to that is a Bullish SHS (head and shoulders) pattern that signifies now moment buyers. 110.45-70 is the POC zone and if the price retraces we might see another bounce to the upside towards 111.40. A spike above or 4h close above 111.40 could make a breakout on the price towards 111.70 and 112.05. A daily close above 112.00 could push the pair up to 112.58-74. The bullish sentiment might weaken if the pair drops and closes below the low of SHS pattern 109.54.
W H3 - Weekly Camarilla Pivot (Weekly Interim Resistance)
W H4 - Weekly Camarilla Pivot (Strong Weekly Resistance)
D H4 - Daily Camarilla Pivot (Very Strong Daily Resistance)
D L3 – Daily Camarilla Pivot (Daily Support)
D L4 – Daily H4 Camarilla (Very Strong Daily Support)
POC - Point Of Confluence (The zone where we expect price to react aka entry zone)
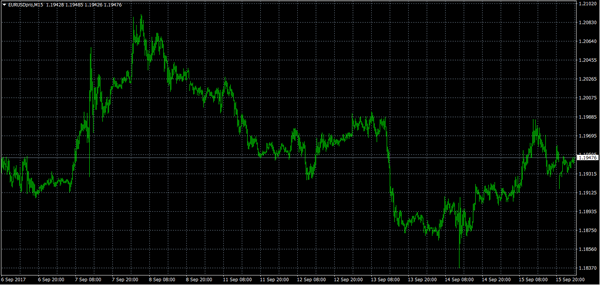
EURUSD Analysis: Begins New Week Near Weekly PP At 1.1938
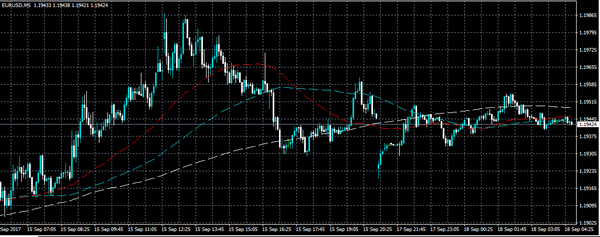
Due to release of negative data on the US Core Retail Sales, the Euro caught an upside momentum, which lasted until the pair met a resistance in the 1.1985-95 area. At the moment, the currency rate is located near the updated weekly PP at 1.1938, being squeezed between the 200- and 100-hour SMAs. Accordingly, an aggregate of technical indicators sends neutral signal. This fact plus the traditional Monday's inactivity suggests that the pair is unlikely to make major advances today. However, generally, the pair is expected to make attempt to break through the above resistance towards the new weekly R1 at 1.2039. On the other side, an average market sentiment remains 65% bearish, which means that in case of a new rebound bears might try to drag the rate down to the monthly PP at 1.1881
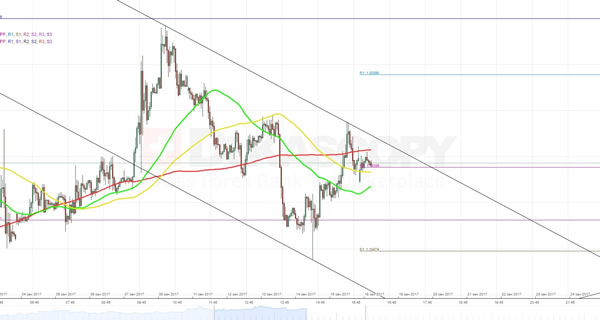
GBPUSD Analysis: Advances By Another 150 Points
As it was expected, the Pound continued to appreciate against the US Dollar, following a speech delivered by the External BOE MPC Member Gertjan Vlieghe on Friday. At the moment, the currency rate is moving horizontally in a limbo between the monthly R3 at 1.3701 from the top and the monthly R2 at 1.3485 from the bottom. However, it should be noted that space between the current market price and the above two barriers amounts approximately to 100 pips in both directions. Most probably, the pair is going to continue to move horizontally until the moment when Governor Carney will start answering questions at the Central Banking Lecture hosted by the IMF at 15:00 GMT. Taking into account previous market reaction on similar two events last week, another sharp surge is likely to follow.
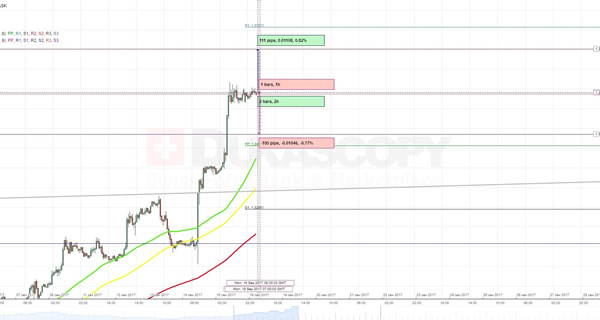
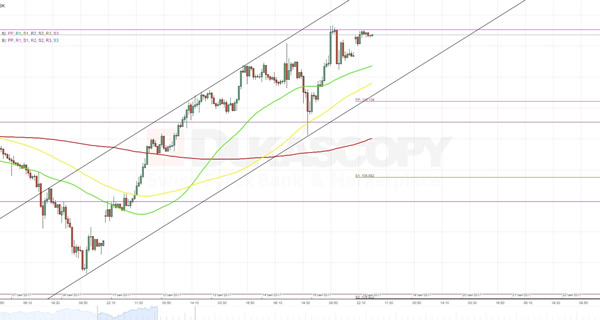
USDJPY Analysis: Fails To Break Above 111.26 Two Times
In line with expectations, until a release of data on the US Retail Sales the currency pair spent in an upward movement. In the process, it made two attempts to break above the monthly R1 at 111.26 but both of them failed.
Due to pressure from the approaching 55- and 100-hour SMAs as well as existence of a recently formed ascending channel, the pair is expected to eventually break through that barrier. An aggregate of technical indicators supports this scenario, sending strong buy signals.
Nevertheless, a possibility of a third rebound and subsequent dissolution of the channel also remains on the table.
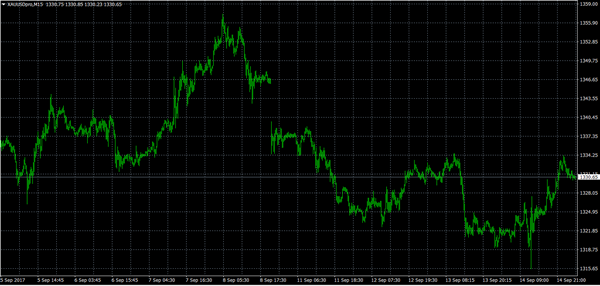
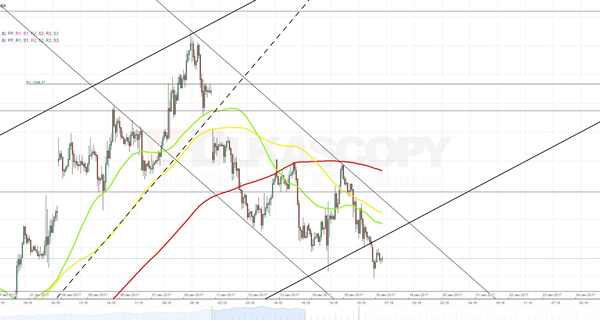
XAUUSD Analysis: Breaks Long-Term Channel Up
Even though information released about the US Core Retail Sales appeared to be worse than analysts expected, the pair did not manage to stay in a long termascending channel. It seems that the breakout was triggered by a combined pressure from the 55- and 100-hour SMAs.
Today the pair is likely to continue to move to the bottom, trying to reach the updated weekly S1 at 1,310.77. A recovery of the yellow metal is not expected to follow, as the northern side is reliably secured not only by the above 55- and 100- hour SMAs, but also by the updated weekly PP at 1,325.63 as well as the upper boundary of a new junior channel down.
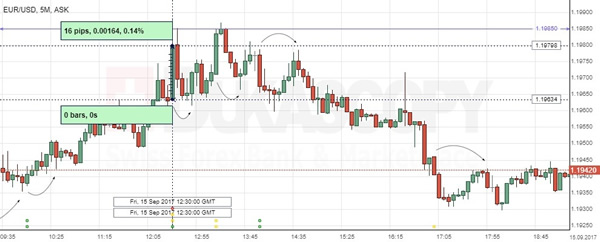
EUR/USD: US Retail Sales
The EUR/USD revealed temporary appreciation amid weaker-thanexpected reports on retail sales in the US. The European single currency added against the Greenback 0.14% or 16 base points to enter the 1.1980 area, but continued a side move at a slightly weaker level.
The Commerce Department reported that the US retail sales dropped unexpectedly 0.2% over the month of August, missing expectations for a 0.3% increase. The negative changes were mainly due to depressed purchases of motor vehicles likely after Hurricane Harvey, which could cause a further moderation in consumer spending in the Q3. However, a rise in purchases at restaurants and furniture outlets suggested the demand is set to be supported by a healthy labour market.
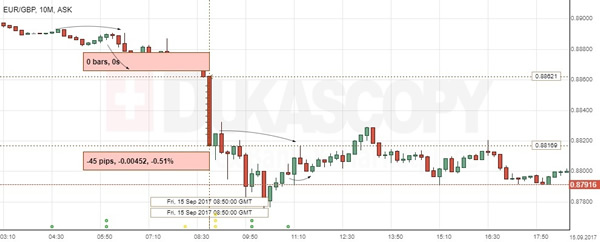
EUR/GBP: EU Trade Balance
The Sterling strengthened significantly against the Euro, continuing to benefit from strong inflation data and a more hawkish stance of the Bank of England. The EUR/GBP exchange rate fell 0.51% or 45 base points ahead of the report showing diminished EU trade balance. Data managed to keep the pair consolidating below the 0.8820 level.
According to the Eurostat, the European Union's trade balance release for July marked that the surplus decreased more than expected to €18.6B from €22.3B registered previously, supporting the bearish sentiment in the pair. However, while businesses put off investments and the UK households kept suffering from a real income squeeze amid Brexit fears, the EUR/GBP is set to be seen at 0.90 by the end of 2017.
Euro Opens The Week Neutral
The EURUSD pair is tentatively trading above its calculated weekly pivot point, located at 1.1938. Traders should watch this level closely for further confirmation of the euros intraday directional bias.
Key intraday resistance above the 1.1938 level is located at 1.1957 and 1.1979. Above 1.1979, the euro may further test towards 1.1999 and 1.2030.
The EURUSD pair has opened the week with a neutral trading bias, with the pair holding above the 1.1900 handle, but seemingly unable to move price-action back above the key 1.1979 level.
This week the euro faces a number of key risk events, firstly, we have the U.S Federal Reserve interest rate decision and monetary policy statement mid-week, and then we see the results of the German Federal over the coming weekend.
The EURUSD pair is tentatively trading above its calculated weekly pivot point, located at 1.1938. Traders should watch this level closely for further confirmation of the euros intraday directional bias.
Key intraday resistance above the 1.1938 level is located at 1.1957 and 1.1979. Above 1.1979, the euro may further test towards 1.1999 and 1.2030.
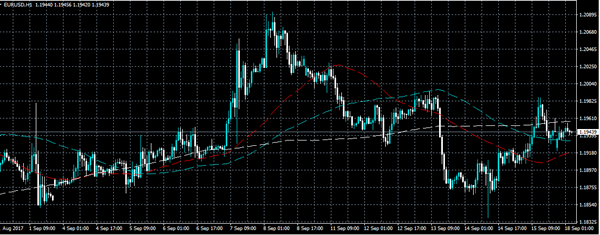
Key intraday support below the 1.1938 level is found at found at the 50-hour moving average at 1.1917 and the former swing price low, at 1.1907.
Below 1.1900, traders should look to the 1.1889 level for further support, and the key 50-period moving average on the monthly time-frame, at 1.1871.
Pound Risks Price Correction
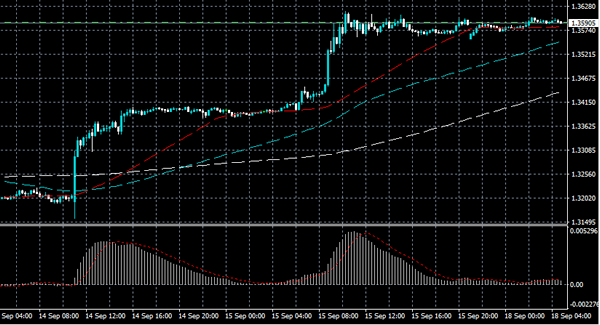
The British pound risks a possible price correction against the U.S dollar, with BOE Governor speaking today and bearish MACD divergence forming on the price charts over the lower- time frames.
Sterling remains at elevated trading levels as the new trading week gets underway, with the pair trading just below the key 1.3600 handle. On Friday the pair topped at the 1.3616 level, with price-action managing only a minor correction lower, to 1.3554.
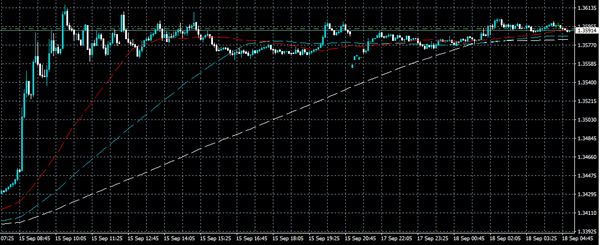
The GBPUSD pair remains strongly bullish on all time-frames, however technical indicators warn of a possible retracement towards the 1.3400 handle.
Intraday sellers may need further confirmation that an interim price-high has been reached, before the correction gathers momentum.
Key upside resistance areas for the GBPUSD pair remain 1.3610, 1.3630 and 1.3654.
Key downside GBPUSD technical support is located at 1.3580 and 1.3554.
Further intraday support is found at the pairs daily pivot point, at 1.3533, and the psychological 1.3500 level.
Data-Packed Week Begins With Eurozone CPI On Monday
Investors are bracing for a highly active week in the financial markets, with a deluge of economic data and a pair of monetary policy statements scheduled to make headlines. The Monday session features a lighter schedule, but one that could still impact the currency markets ahead of more compelling releases later in the week.
Action begins at 08:00 GMT when the Italian government reports on the July trade balance. The headline numbers include global trade flows as well as EU-specific balances.
One hour later, the European Commission’s statistical agency will release the final August consumer price index (CPI). Annual inflation is forecast to come in at 1.5%. So-called core inflation, which strips away volatile food and energy products, is expected to reach 1.2% year-over-year.
The German Buba Monthly Report is tentatively scheduled for Monday, although no timeframe has been provided. The monthly release contains relevant articles, speeches and analyses of current economic conditions from the perspective of the Deutsche Bundesbank.
Shifting gears to North America, the Canadian government will report on foreign portfolio investment at 12:30 GMT. Ninety minutes later, the US National Association of Home Builders (NAHB) will unveil its September Housing Market Index. The NAHB indicator provides an important snapshot of the housing market from the perspective of national homebuilders.
After a solid start to the week, the US dollar index (DXY) declined sharply on Thursday and Friday. The DXY basket held steady during Asian trade, and was last seen hovering at 91.89.
In commodities, gold and silver prices drifted slightly lower following last week’s broad downward correction.
EUR/USD
The euro regained its footing on Friday to settle at 1.1950 US. The EUR/USD exchange rate had suffered a sharp retreat earlier in the week back below 1.1900. The pair was last seen trading at 1.1949. The euro’s outlook remains favourable, as the combination of strong economic data and a dovish dollar continues to drive the common currency higher. The Federal Reserve policy decision on Wednesday could have a major impact on dollar pairs, including the euro.
USD/CAD
The USD/CAD kept a steady hand last week, as the pair hovered between 1.2100 and 1.2200. The pair was last seen trading at the upper end of that range, or roughly 20 pips below 1.2200. Immediate support is located in the mid-1.2100s and a loss of this region could spark a bigger pullback toward the 1.2075 level. On the upside, resistance has formed in the 1.2230 area.

GOLD
After a strong start to the month, gold prices have been in a downward consolidation for the past week. The loss in momentum was accompanied by the return of risk sentiment, as investors shrugged off the latest provocation from North Korea. Prices are hanging around $1,320.00. The US dollar is likely to provide fresh trading catalysts over the next five days.