Sample Category Title
Can Euro Resume Uptrend Above 1.2000 Vs US Dollar?
Key Highlights
- The Euro corrected lower from the 1.2092 swing high against the US Dollar, and traded below 1.1900.
- There was a break below a crucial bullish trend line with support near 1.1900 on the 4-hours chart of EUR/USD.
- China's house price index in August 2017 increased 8.3%, compared with the last +9.7%.
- China's new loans in August 2017 were 1,090.0B, compared with the forecast of 900.0B.
EURUSD Technical Analysis
The Euro struggled to move past 1.2100 recently against the US Dollar and started a correction. The EUR/USD pair corrected to 1.1840 and currently attempting to move back above 1.2000.
During the downside move from 1.2092, the pair broke a couple of important supports levels. The 1.2000 support, the 100 hourly simple moving average (H4) and 1.1900 were breached. There was also a break below a crucial bullish trend line with support near 1.1900 on the 4-hours chart.
The pair traded as low as 1.1837 where the 200 SMA (H4) and another bullish trend line prevented declines. The pair recovered well and currently trading above 1.1880 and the 100 SMA (H4).
A proper close above the 50% Fib retracement level of the last decline from the 1.2092 high to 1.1837 low is needed for a push above 1.2000 in the near term. On the downside, the 100 SMA (H4), the trend line support at 1.1900 and the 200 SMA (H4) are important hurdles for sellers.
China's House Price Index and New Loans
Today in China, there were a few low-risk economic releases like the house price index and new loans lined up for August 2017. The house price index released by the National Bureau of Statistics was forecasted to increase 9% in August 2017.
However, the result was less than the forecast as the HPI increased 8.3%. On the other hand, the new loans figure released by People's Bank of China was forecasted to post 900.0B. The actual was better, as the new loans were 1,090.0B, compared with the forecast of 900.0B and more than the last 825.5B.
The M2 Money Supply increased 8.9% in August 2017, compared with the same month a year ago. It was less than the last +9.2% and below the forecast of +9.1%.
Overall, the results were mixed and did not impact the market sentiment for EUR/USD above 1.1900. If the pair continues to hold the 1.1900 support and the 200 SMA (H4), it might continue to move higher.
EURUSD Turns Neutral To Bullish After Rally Stalls Near 1.21
EURUSD remains in a neutral bias after pausing the uptrend from 1.0820 in April. The pair has been trading sideways in the past 3 weeks within a range of 1.1822 to 1.2091. The medium-term technical picture is still bullish and prices continue to rise within the ascending channel but the near-term outlook has shifted to a consolidation phase.
After the market reached its highest level in over 2 years on September 8 at 1.2091, EURUSD retreated to the 1.1900 area. This is now a key support level. Downside risk has diminished as RSI has stopped falling and is now flat while it remains in bullish territory above 50. MACD is horizontal and is well above the zero line which also indicates the absence of downside momentum.
Should prices fall below 1.1900 and extend lower from the range low of 1.1822, the focus will clearly turn to the downside with support at 1.1661 coming into view. A deeper fall would target a previous resistance-turned-support zone at 1.1471. Falling below this level would see the market retrace more than 50% of the 1.0820 – 1.2091 uptrend and likely move lower to 1.1290 and then 1.1100 before reversing the whole uptrend.
There is little immediate risk of a downturn for now but EURUSD needs a strong bounce from current levels to clear the 1.2091 peak in order to see a resumption of the uptrend that started in April.
EURUSD maintains a technically bullish tone for the medium-term and trend indicators are bullish. The 50-day and 200-day moving averages are positively aligned and are sloping upwards. The short-term bias is neutral as momentum signals are turning flat and suggest the market is entering a consolidation phase.
Gold Has Turned Increasingly Bearish After Retreating From 1-Year Highs
Gold has turned increasingly bearish in the short term after the 50-period moving average fell below the 20-period MA last week. Momentum oscillators on the 4-hour chart are giving bearish signals.
After rallying to a more than a 1-year high of 1357.47 on September 8, the rally lost steam as the market became overextended. This was indicated by RSI rising above 70 into overbought territory. Gold prices failed to sustain gains at these levels and consequently fell below an important support level at 1342.68 and the market has been carving out lower highs and lower lows since the 1357.47 peak.
Momentum oscillators are now bearish, with RSI below 50 and MACD below zero, thereby increasing the risk to the downside. The focus has shifted to the key 1300 level which is expected to provide support. From here, prices could target the 1280 level which is the 50% Fibonacci retracement level of the uptrend from 1204.79 to 1357.47 (July 10-September 8). A move lower would increase the bearish view and result in a reversal of the July to September uptrend.
Not much damage has been done to the medium-term bullish market structure but gold prices are expected to stay under pressure in the near-term unless they can reclaim and stay above the 1335 area. Such a move would increase the odds for a re-test of the 1357.47 peak and bring a resumption of the uptrend. For now, the near-term bearish bias is expected to remain.
Safe-Havens Pull Back As US Seeks Peace With N.Korea, Dollar Steady Ahead Of FOMC
On Monday, safe-haven currencies were trading lower as UN leaders were preparing to kick off a meeting on Tuesday to discuss possible solutions on North Korea's nuclear programs, with the US seeking a peaceful resolution. The dollar was hovering sideways ahead of the FOMC meeting.
With the economic calendar lacking significant releases during the Asian session, the dollar index was mainly flat at 91.88 as investors were waiting for the two-day FOMC meeting ending on Wednesday. Although investors anticipate Fed policymakers to keep rates unchanged, they will be focused to hear whether the Fed will start shrinking its $4.4 trillion balance sheet.
Attention will be also paid to Trump's speech at the UN General Assembly on Tuesday, where leaders from all over the world will gather to discuss options on how to discourage North Korea's threatening nuclear programs. The US Secretary of State, Rex Tillerson, said that the US seeks for a peaceful resolution but if efforts fail to deter North Korea's nuclear actions, then the country will use its military options.
The safe-haven currencies moved lower on the above news, with dollar/swissie climbing by 0.20% to 0.9611, while dollar/yen peaked at an eight-week high of 111.39 after the Japanese Prime Minister, Shinzo Abe, called for a snap election probably in the next two months.
According to government sources, Abe is considering calling elections in mid-October or after Trump's visit in November to take advantage of his party's leading position against the opposition party. Recent ratings showed that the ruling party attracted 50% of voters polled following Abe's response on North Korea's missile tests as well as conflicts observed within the opposition party.
Besides that, market watchers will keep a close eye on the BOJ policy meeting on Thursday, where expectations are for the central bank to maintain its ultra-easy monetary policy.
The pound slipped to $1.3570 after it touched a one-year high of $1.3615 on Friday. This arose after the BOE Monetary Policy Committee (MPC) member, Gertjan Vlieghe, clarified that the central bank should raise rates “as early as in the coming months”.
Euro/dollar changed hands at 1.1937 ahead of the Eurozone's final inflation readings for August later today.
The aussie and the kiwi gained against the greenback as investors were looking for riskier assets. The aussie jumped by 0.16% to $0.8015, while the kiwi was up by 0.21% at $0.7300, hitting a one-month high of $0.7342 earlier in the session.
Regarding commodities, oil prices were in an uptrend during the Asian trading, with WTI crude rising by 0.52% to $50.15 per barrel and Brent being 0.13% higher at $55.69. This came after the OPEC report signalled increasing demand in 2018 and the number of US drilling rigs for new production reported last week fell.
Gold was weaker by 0.30% at $1,315.90 per ounce amid lower risk-off sentiment.
US Data Fails To Impress
On Friday, the US Commerce Department released Retail Sales showing a drop of 0.2% in August, the biggest decline in 6 months. The markets had expected a decline resulting from both Hurricanes Harvey and Irma. The Commerce Department commented that it could not isolate the impact of Hurricane Harvey on retail sales, it did receive indications from companies that the hurricane had “both positive and negative effects on their sales data, while others indicated they were not impacted at all.” Whilst Harvey may have had an impact on August data, June and July data were revised lower suggesting US consumer spending has slowed down.
The Federal Reserve released Industrial Production for August on Friday showing a decline of 0.9% – the biggest decline since May 2009. The Fed is attributing as much as 0.75% to Harvey, as Gulf coast oil and natural gas production was stopped. The markets are expecting that September's Industrial Production will also be negatively impacted due to Irma.
The tension resulting from North Koreas continued missile testing, and Pyongyang's defiance in the face of international condemnation, is causing concern in the markets. North Korea's official state news agency, KCNA, has added to concerns by calling for a break up in the UN Security Council which they see as a “tool of evil”. In further rhetoric, KCNA has threatened to “sink” Japan and reduce the USA to “ashes and darkness”. US Secretary of State Tillerson recently stated that the U.S. “seeks a peaceful resolution but is prepared to use military force if diplomatic efforts fail to end the nuclear standoff with North Korea”. This, as President Trump is scheduled to make his first address before the United Nations on Tuesday. The markets expect more rhetoric from the US and North Korea.
The Federal Reserve meets Tuesday and Wednesday to discuss monetary policy where many believe they will announce the start of the reduction in the Central Banks massive balance sheet. Later in the week, the Bank of Japan will meet to discuss Japanese monetary policy with many expecting no change in their stance. This week marks the final week before the German General Election on September 24th and the New Zealand General Election on September 23rd. Today is a Public Holiday in Japan.
EURUSD has gained 0.24% overnight to currently trade around 1.1945.
USDJPY has moved higher from Friday's close to currently trade around 111.35.
GBPUSD remains strong, reaching levels not seen since 3 June of last year. Currently, GBPUSD is trading around 1.3595.
Gold gave back recent gains, as risk-on sentiment has improved. Currently, Gold is trading around $1,316.
WTI has been buoyed by higher demand, resulting in a 5% gain last week. Currently, WTI is trading around $50.50.
Major economic data releases for today:
At 10:00 BST, Eurostat will release Eurozone Consumer Price Index & Core (MoM & YoY) for August. Core CPI is forecast to come in at 1.2%, a slight decline from the previous release of 1.3%. YoY CPI is expected to remain at 1.5%. Eurozone inflation appears to be restrained, but any major change from the forecasts will see EUR volatility in the markets.
Sterling Extends Gains On BoE Rate-Hike Talk
The British pound continued to rally on Friday, following some relatively hawkish comments from BoE MPC member Gertjan Vlieghe. Among other optimistic remarks, the policymaker said that the appropriate time for a rate hike might be as early as in the coming months, something that pushed the implied probability for a hike by December to 78%. Today, we will hear from BoE Governor Mark Carney, who will speak at the IMF. Should he reaffirm that a hike in the coming months is likely, sterling could gain further. Given the heightened speculation for a hike, we maintain the view that the short-term outlook of GBP remains positive.
Looking further ahead, the key risk to the continuation of the GBP rally are politics, we think. The latest focus on monetary policy developments seems to have shifted market attention away from the continued delays and the lack of progress in the Brexit negotiations. In addition, the upcoming Conservative Party conference (1st October) presents further political uncertainty, as any rebellious attempt to replace PM May could put a lid on further sterling gains.
EUR/GBP continued to tumble on Friday on the hawkish remarks by BoE's Vlieghe, falling below the support (now turned into resistance) barrier of 0.8830 (R1). However, the slide was stopped by the crossroads of the 0.8780 (S1) support and the longer-term upside support line taken from the lows of November 2015. The price structure on the 4-hour chart continues to suggest a short-term downtrend, but given our proximity to the aforementioned crossroads, we prefer to take the sidelines for now. A clear break below that support zone is needed before we get confident on more bearish extensions. The catalyst for such a break may be more hawkish comments by BoE Governor Mark Carney today. If this is the case, we expect a dip below 0.8780 (S1) to initially aim for our next support of 0.8715 (S2). On the other hand, if the Governor appears less hawkish than expected, the pair could rebound from the longer-term upside support line.
Yen continues to retreat amid early election reports
The yen retreated further on Friday, alongside other safe havens like gold, despite the North Korean missile launch that occurred a few hours earlier. Meanwhile, major global equity markets such as the S&P 500 closed the day at new record highs. In our view, this suggests that as long as the situation does not escalate into military conflict, market participants may continue to place less and less emphasis on North Korean developments.
Turning to Japan, reports over the weekend suggest that PM Abe is considering to hold a snap election as early as next month, in order to exploit the disarray in the main opposition party and gain a bigger majority for his own party. If early elections are confirmed in the next days, the increased domestic political uncertainty could be another factor weighing on the yen, besides the latest risk-on environment.
USD/JPY traded north on Friday and during the Asian morning Monday, the pair opened with a positive gap above the key resistance (now turned into support) of 111.00 (S1). That barrier acted as the upper bound of the sideways range that had been containing the price action since the 28th of July. As such, its break may have turned the short-term picture to positive, in our view. We now expect the bulls to remain in the driver's seat and perhaps drive the battle higher for a test near the 111.70 (R1) line, marked by the peak of the 27th of July.
Today's highlights:
Besides Carney's speech, we only have Eurozone's final CPIs for August. Nevertheless, the bloc's final inflation data are usually not market movers.
As for the rest of the week:
On Tuesday, the only noteworthy data set we get is Germany's ZEW survey for September. On Wednesday, the main event will be the FOMC gathering. This is one of the 'bigger' meetings, meaning that besides the rate decision we also get fresh economic forecasts for the US economy, an updated 'dot plot', as well as a press conference by Chair Yellen. Then on Thursday, focus will turn to the BoJ and Norges Bank policy meetings. Finally on Friday, Eurozone's manufacturing and services PMIs for September are out, as well as Canada's CPI data for August.
EUR/GBP
Support: 0.8780 (S1), 0.8715 (S2), 0.8640 (S3)
Resistance: 0.8830 (R1), 0.8920 (R2), 0.8985 (R3)
USD/JPY
Support: 111.00 (S1), 110.10 (S2), 109.55 (S3)
Resistance: 111.70 (R1), 112.20 (R2), 112.90 (R3)
EUR/USD Elliott Wave Analysis
EUR/USD – 1.2020
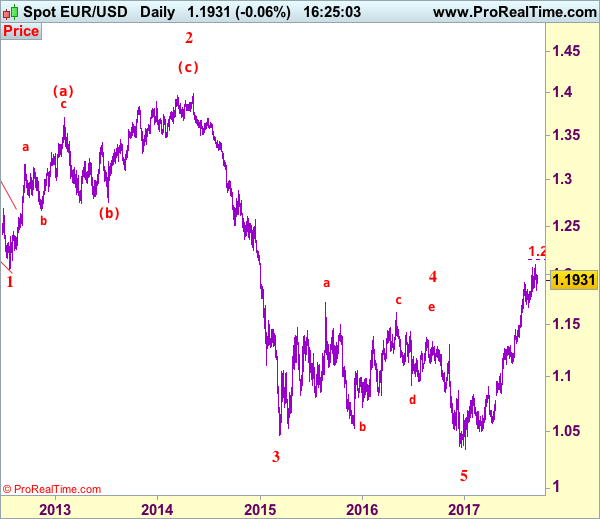
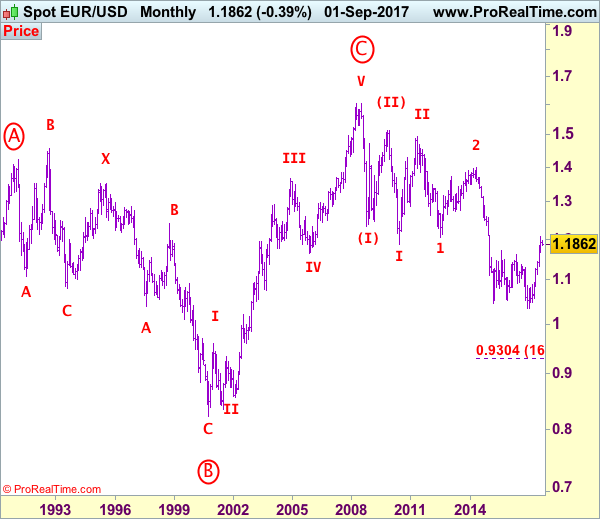
EUR/USD: Wave (c) of 2 ended at 1.3993 and wave 3 of III has commenced for weakness to 1.0411 (1.236 of wave 1), then 1.0000.
Although the single currency resumed recent rise and rose to a marginal high of 1.2093, lack of follow through buying on break of previous resistance at 1.2070 and the subsequent retreat suggest consolidation below said resistance would be seen and another test of 1.1838 support cannot be ruled out, however, a daily close below there is needed to signal a temporary top has possibly been formed, bring retracement of recent rise to 1.1770-75, then 1.1700 but previous support at 1.1662 (previous 4th of a lesser degree) should hold from here, bring rebound later.
Our preferred count on the daily chart remains that a wave (II) from 1.2329 ended at 1.5145 with A-leg ended at 1.4720, followed by wave B at 1.2457, the wave C from there was also a 3 legged move and is labeled as (a): 1.3739, (b): 1.2885, the wave iii of the 5-waver (c) from 1.2885 has ended at 1.4339 and wave iv is a triangle ended at 1.3878 and wave v formed a top at 1.5145. The decline from there is a 5-waver (C) with minor wave (i) of I of (C) ended at 1.4218 with wave (ii) ended at 1.4580, wave (iii) ended at 1.3267 and wave (iv) ended at 1.3692 and wave (v) ended at 1.1876, this is also the low of wave I of (C) and wave II ended at 1.4940, hence wave III is now in progress with a diagonal wave 1 ended at 1.2042, the breach of previous support at 1.1876 (wave I trough) adds credence to our view that the wave 2 has ended at 1.3993, wave 3 has commenced for further weakness to 1.0411, then towards 1.0000.
On the upside, expect recovery to be limited to 1.2000 and reckon 1.2040-50 should hold, bring another retreat later. Only break of said resistance at 1.2093 would signal recent upmove from 1.0340 low is still in progress and may extend headway to 1.2150-55 (61.8% projection of 1.1119-1.1910 measuring from 1.1662), however, loss of upward momentum should prevent sharp move beyond 1.2200-10 and price should falter below 1.2255-60, risk from there remains for a much-needed correction to take place later this month.
Recommendation: Stand aside for this week.
Euro's long-term uptrend started from 0.8228 (26 Oct 2000) with an impulsive structure. The rise from 0.8228 to 0.9593 (5 Jan 2001) is labeled as wave I, the retreat to 0.8352 (6 Jul 2001) is wave II and the rally to 1.3670 (31 Dec 2004) is wave III. Wave IV from there ended at 1.1640 (15 Nov 2005), the subsequent upmove to 1.6040 (July 15, 2008) is treated as wave V, the major selloff from the record high of 1.6040 to 1.2329 (October 27, 2008) signals a reversal has taken place with (I) leg ended at 1.2329 and once (II) ended at 1.5145, wave (III) itself is an extended move with I: 1.1876 and complex wave II ended at 1.4902, wave III has commenced with wave 1 and 2 ended at 1.2042 and 1.3993 respectively, wave 3 of III is now unfolding for weakness towards parity.
USD/JPY Elliott Wave Analysis
USD/JPY - 111.35
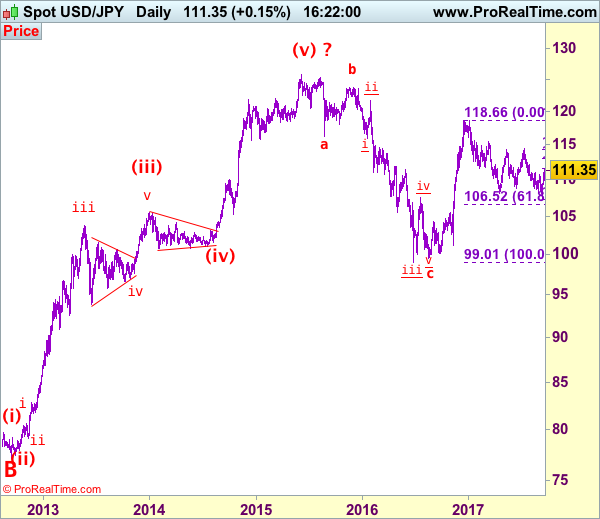
USD/JPY – Wave V of larger degree circle V has possibly ended at 75.31 and major correction has commenced and already met indicated target at 125.00.
As the greenback has staged a strong rebound after finding good support at 107.32 earlier this month, suggesting low has indeed been formed there and consolidation with upside bias is seen for at least a retracement of recent entire fall from 118.66, hence further gain to 111.65 (38.2% Fibonacci retracement of 118.66-107.32), then 112.20-25 would be seen, however, near term overbought condition should limit upside to 112.95-00 (50% Fibonacci retracement) and price should fatter well below resistance at 114.50, bring retreat later.
Our preferred count is that, triangle wave IV (with circle) ended at 101.45 and the circle wave V brought dollar down to the record low of 75.31 in 2011 and the subsequent rebound signal major correction has commenced with A leg ended at 84.19, followed by wave B at 77.14 and impulsive wave C is now unfolding (indicated upside target at 125.00 had been met) for gain towards 127.00 level. In the event dollar drops below support at 99.01, this would confirm medium term decline from 125.86 top (2015 high) has resumed for subsequent weakness to 98.00 and possibly 97.00.
Under this count, this wave C is unfolding as impulsive waves with (1) (2), 1 2 ended at 80.67, 79.07, 82.84 and 81.69 respectively, hence the extended wave 3 has ended at 103.74 and wave 4 correction of recent upmove should bring weakness to 92.57, then towards 90.88 but psychological support at 90.00 should limit downside and bring another rally later in wave 5, indicated target at 125.00 had been met and gain to 127.00 cannot be ruled out but reckon price would falter below 130.00.
On the downside, whilst pullback to 110.90.00 and possibly 110.50-60 cannot be ruled out, reckon downside would be limited to 110.00 and bring another rise later. Below strong support at 109.55 would abort and suggest the rebound from 107.32 has ended instead, risk weakness to 109.00 and possibly 108.50-60 but price should stay well above said support at 107.32 and bring another rebound later.
Recommendation: Buy at 110.00 for 112.00 with stop below 109.00.
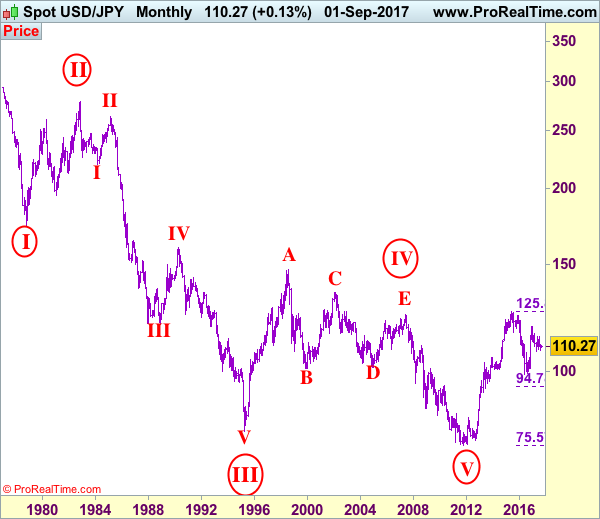
On the monthly chart, we have changed our preferred count that an impulsive wave is unfolding with major wave III with circle ended at 79.75, then followed by wave IV with circle and is labeled as a triangle with A: 147.64 (11 August, 1998), B: 101.25, C: 135.20, D: 101.67 and E leg ended at 124.14 to end the wave IV with circle. Hence, wave V with circle commenced from there and hit a record low of 75.31, however, the subsequent strong rebound signals this circle wave V has possibly ended there, hence gain to (indicated upside target at 122.00 and 125.00 had been met), the retreat from 125.86 suggests wave A of major correction has ended there and wave B correction back to 99.00, then 95.00 would be seen, however, reckon downside would be limited to 90.00, bring another rebound in wave C next year.
Currencies: Dollar Mixed Ahead Of FOMC. Sterling Gets Additional Support From BoE
Sunrise Market Commentary
- Rates: Dovish positions scaled back; neutral ahead of Fed?
Core bond markets lost ground last week despite mixed to weaker US eco data, scaling back too dovish bets against monetary policy normalisation. With markets now positioned more neutral, we expect sideways trading given the empty eco calendar and the approaching Fed meeting. Portuguese bonds can outperform after regaining “investment grade” from S&P. - Currencies: Dollar mixed ahead of FOMC. Sterling gets additional support from BoE
USD/JPY remains well bid as sentiment on risk improves further and as the yen suffers from higher core yields. However, poor US data prevented further USD gains against the euro. The dollar will probably trade in wait-and-see modus ahead of Wednesday's FOMC decision. Sterling rebounds further as the BoE made a hawkish U-turn.
The Sunrise Headlines
- US equities ended Friday's trading with minor gains, but worth mentioning the S&P closed above 2500 threshold. Overnight, Asian equities started the week on a strong footing with overnight gains around 0.5% to 1% on hopes the US seeks a peaceful resolution in the N-Korean issue.
- The cost of new housing in China rose at the slowest pace on more than a year in August as price growth in top-tier cities experiencing a marked deceleration
- S&P upgraded the Portuguese rating to investment grade (BBB-) stable outlook due to progress in reducing its deficit. Since 2012 the country had a junk S&P rating. The upgrade might raise investors' appetite for Portuguese bonds.
- Moody's raised Ireland's rating with one notch to A2, positive outlook, due to stronger than expected growth and progress regarding its public finances.
- Japanese PM Abe appears to be considering calling a snap election when parliament resumes later this month, according to reports. The media leaks might be a trial balloon to gauge the public mood.
- The world's central banks can't sit back and ignore the growth in cryptocurrencies as it could pose a financial system risk, according to the BIS.
- Today's calendar is super light with only the final September EMU inflation and the US homebuilders'
Currencies: Dollar Mixed Ahead Of FOMC. Sterling Gets Additional Support From BoE
USD trading mixed going into FOMC decision
The dollar showed a mixed picture on Friday. Core yields kept an upward bias even as US data (retail sales and production) disappointed. The euro outperformed and EUR/USD rebounded into the high 1.19 area. At the same time, USD/JPY and EUR/JPY were in good shape. This was mainly yen weakness as the Japanese currency suffered from higher US/EMU yields. Sentiment on risk also improved throughout the session as the impact from the North Korean missile test ebbed further. EUR/USD finished the session at 1.1945. USD/JPY end the session at 110.83.
Overnight, Asian equities show gains between 0.5% and 1.0%, supported by record closing levels on WS on Friday. Chinese house price increases slowed further in August, reducing the need for additional measures to cool house prices. This adds to the Chinese risk-on sentiment. Japanese markets are closed, but sources suggest that Japanese PM Abe may call snap elections as soon as next month. The yen holds near recent lows and USD/JPY trades in the 111.15 area. The dollar is slightly better bid against the euro. EUR/USD trades in the 1.1940 area.
Today the eco calendar only contains the EMU (final) August inflation and the US September NAHB housing index. The former is expected to confirm the preliminary outcome. The latter is expected marginally lower (67) from August (68), but still close to the cycle high. No sustained market reaction is expected. BoE Carney speaks at the IMF. Markets will look for more warnings about a rate hike. Further out this week, the main event is the FOMC meeting on Wednesday. The FOMC will likely announce the start of a gradual balance sheet tapering (Q4) and keep the FF rate unchanged. Most attention will go to the rate projections (dots). Will the median projection still point to another rate hike in 2017 (December)? What about the long run FF rate projection (currently 3% but likely revised lower)? North Korea (and the US handling of the conflict) and the debate on US tax reduction remain a wildcard for (USD) trading
Last week, the dollar cautious rebound on a more positive risk sentiment was not convincing, as softer than expected US data created a mixed dollar context. Despite disappointing US data, core yields extended their rise at the end of last week, suggesting that markets don't expect an overly soft FOMC. This might prevent further USD losses going into the FOMC policy meeting. We start the week with a neutral bias on the dollar. EUR/USD hovers in the middle of a sideways consolidation pattern between 1.1823 and 1.2070. It was disappointing for EUR/USD bears that last week's correction didn't reach this range bottom. More confirmation is still needed that the recent bottoming out process in US yields and in the dollar might be the start of more sustained USD gains (against the euro). The day-to-day momentum in USD/JPY is a more constructive. The pair tries to sustain above the 110.67/95 previous support. Yen weakness prevails, but we are still not convinced that current cautious break above 111 will be the start of a protracted uptrend.
EUR/USD consolidation off recent top, but no test of first significant support level yet.
EUR/GBP
BoE gives GBP rebound more fuel
On Thursday, sterling jumped sharply higher as the BoE minutes revealed that a majority of MPC members expected a gradual withdrawal of monetary stimulus over the coming months. On Friday, BoE's Vlieghe, a notorious dove, supported the call for a rate hike. This hawkish turn of a BoE dove triggered further GBP gains. EUR/GBP dropped temporary below 0.88 and closed the session at 0.8789 (from 0.8896). Cable (currently 1.3575) jumped temporary north of 1.36, but eased late in the session on the dollar rebound. BGP/USD finished at 1.3594.
Overnight, Rightmove UK House prices declined 1.2% M/M to rise only 1.1% Y/Y (from 3.1% in August). Prices in London are coming under further pressure. For now, the report has no noticeable impact on sterling trading. BoE's Carney speaks at an IMF meeting in Washington. Markets will be keen to see whether he joins the hawkish chorus of BOE speakers of late. After last week's jump of sterling, a lot of good news should be discounted. Even so, we don't row against the sterling positive tide yet. The EUR/GBP correction might still go a bit further.
From a technical point of view, EUR/GBP cleared 0.8854/80 resistance (top end June), opening the way for a protracted August rebound. The move was the result of euro strength. Simultaneously, UK price data were soft enough to keep the BoE side-lined at the August meeting. Recent price data amended this story and the ST-trend reversal of sterling was reinforced by recent BoE comments. Medium term, we maintain a EUR/GBP buy-on-dips approach as we expect the mix of relative euro strength and sterling softness to persist. However, the prospect of withdrawal of BOE stimulus probably put a solid floor for sterling ST term. We let the current correction do its job, before selling sterling versus the euro. EUR/GBP is nearing next support at 0.8743 and 0.8652
EUR/GBP: BoE rate hike signal accelerates GBP-rebound
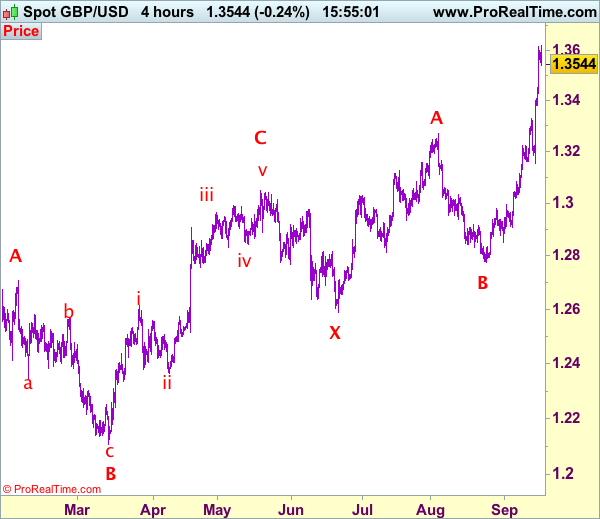
Trade Idea: GBP/USD – Buy at 1.3450
GBP/USD – 1.3558
Original strategy :
Buy at 1.3490, Target:1.3690, Stop: 1.3430
Position: -
Target: -
Stop: -
New strategy :
Buy at 1.3450, Target:1.3650, Stop: 1.3390
Position: -
Target: -
Stop:-
Although cable rise briefly to 1.3619 earlier today, lack of follow through buying on break of Friday’s high at 1.3617 and current retreat suggest consolidation below said resistance would take place and pullback to 1.3500-10 cannot be ruled out, however, reckon downside would be limited to 1.3440-50 and bring another rise later, above said resistance at 1.3619 would extend recent upmove to 1.3650-60, then towards 1.3700. We have re-labeled our preferred count (pls see the attached chart) that the wave IV is unfolding as a complex double three (ABC-X-ABC) correction with 2nd wave B ended at 1.2774, hence 2nd wave C is unfolding and may extend further gain to 1.3650, then 1.3700, however, near term overbought condition should limit upside to 1.3770-75 and reckon 1.3800-10 would hold from here, bring retreat later.
In view of this, would not chase this rise here and would be prudent to buy sterling on subsequent pullback as 1.3440-50 should limit downside. Below 1.3425-30 would defer and suggest a temporary top is possibly formed, risk correction to 1.3385-90 but previous resistance at 1.3329 should remain intact, bring another upmove later.
Our preferred count on the daily chart is that cable's rebound from 1.3500 (wave (A) trough) is unfolding as a wave (B) with A ended at 1.7043, followed by triangle wave B and wave C as well as wave (B) has ended at 1.7192, the subsequent selloff is the larger degree wave (C) which is still unfolding with minor wave (III) of larger degree wave 3 ended at 1.1986, hence wave (IV) correction is in progress which could either be a triangle wave (IV) of a complex formation but upside should be limited to 1.3500 and price should falter well below 1.4000, bring another decline in wave (V) of 3 for weakness to 1.1500, then 1.1200.