Sample Category Title
EUR/USD Candlesticks and Ichimoku Analysis
Weekly
• Last Candlesticks pattern: Shooting star
• Time of formation: 31 Jul 2017
• Trend bias: Near term up
Daily
• Last Candlesticks pattern: Shooting star
• Time of formation: 2 Aug 2017
• Trend bias: Up
EUR/USD – 1.1923
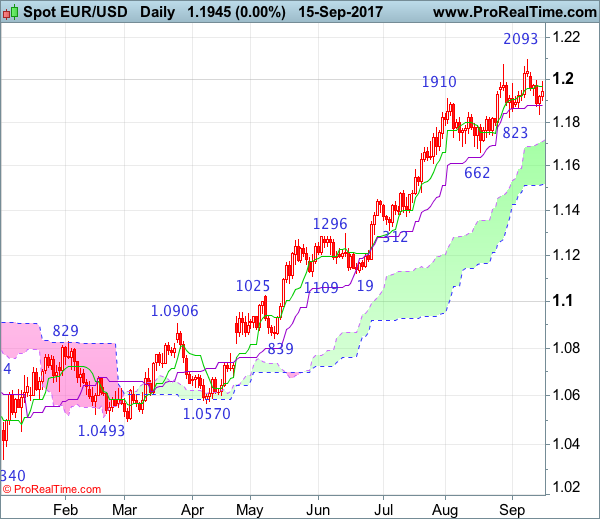
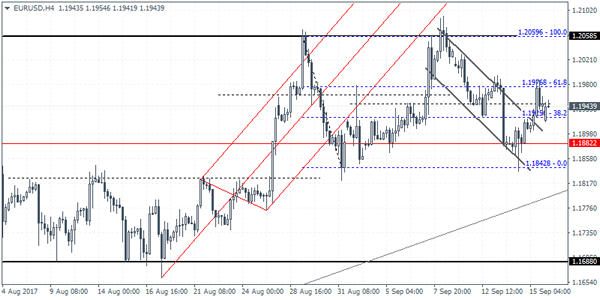
Although the single currency resumed recent upmove and rose to as high as 1.2093, lack of follow throng buying on break of previous resistance at 1.2070 and the subsequent retreat has retained our view that further consolidation would be seen and pullback to 1.1835-40 cannot be ruled out, however, reckon down side would be limited to 1.1790-00 and bring another rise later, above 1.2030-35 would signal the pullback from 1.2093 but break there is needed to confirm recent upmove has resumed and extend gain to dynamic resistance at 1.2165-70 (50% Fibonacci retracement of 1.3993-1.0340) and later towards 1.2200-10 but loss of upward momentum should prevent sharp move beyond 1.2250-60 and reckon 1.2300-10 would hold from here.
On the downside, whilst initial pullback to 1.1835-40 and then 1.1800 cannot be ruled out, reckon 1.1730-40 would contain downside and bring another rise. Below 1.1700 would risk test of support at 1.1662 but a daily close below latter level is needed to signal a temporary top has been formed, bring retracement of recent upmove to 1.1610-15 and possibly towards 1.1550-60, however, reckon the lower Kumo (now at 1.1515) would contain downside.
Recommendation: Buy euro at 1.1800 for 1.2000 with stop below 1.1700.
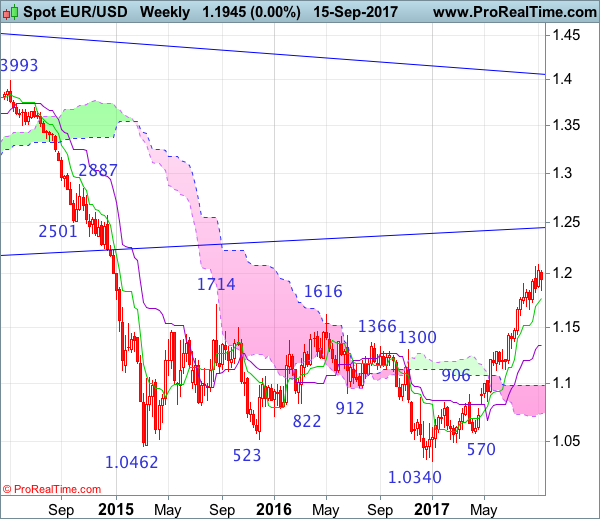
On the weekly chart, euro’s retreat after marginal rise to 1.2093 suggests consolidation below this level would be seen and pullback to 1.1835-40, then 1.1800 cannot be ruled out, however, reckon downside would be limited to 1.1730-35 and bring another rise later, above said resistance at 1.2093 would extend recent upmove from 1.0340 low to 1.2160-70 (50% Fibonacci retracement of 1.3993-1.0340) but loss of upward momentum should limit upside to 1.2220-30 and reckon 1.2300-10 would hold from here, price should falter well below 1.2390-00, bring another retreat later.
On the downside, whilst initial pullback to 1.1800 is likely, reckon downside would be limited to 1.1730-35 and bring another rise later. Only below support at 1.1662 would abort and suggest a temporary top is possibly formed, bring retracement of recent rise to 1.1545-50 and possibly towards 1.1500, however, reckon downside would be limited to 1.1430-40 and price should stay well above the Kijun-Sen (now at 1.1332), bring another upmove later this month or in Q4.
‘
Monetary Policies To Remain Center Stage
Sterling surged above $1.36 last week,remindinginvestors that central banks remain the strongest drivers of currency markets. GBPUSD has risen 3% in two days to trade at a 15-month high, after the Bank of England signaled to lift rates from record lows. Investors had to adjust their positions aggressively, after realizing that their views were clearly misaligned with the BoE on monetary policy. Rate hike expectations for November shot from below 20% to 65%, sending yields on U.K. 2-year notes 150% higher throughout last week, while 10-year bond yields, considered a less sensitive benchmark to rate hikes, also gained 30%. U.K. equity investors have also felt the pain, with the FTSE 100 falling more than 2.2% to close Friday at 7,215;with increasedsterling appreciation,the index is likely to test a significant support level around 7,100.
More sterling appreciation is still possible in the short run, as investors continue to adjust their FX positions.However, without political stability, most of the gains may be wiped out. Let’s not forget that Brexit negotiations have yet made much headway; many firms are still looking to relocate their headquarters from the U.K., real wages are in negative territory, and the economy may face lot of stress in the months and years to come.
This week, investor attention will shift back to politics, with Theresa May’s Brexit speech scheduled for Friday, in Florence. Pound traders will move based on the tone of her statements; whether she will soften or harden the approach to Brexit talks remains the key to Sterling’s next move.
The main event of the week, is the Federal Reserve’s monetary policy announcement on Wednesday. Upbeat U.S. inflation data wasnot enough to move markets’ expectations of an interest rate hike in December. The odds foran interest rate hike by the end of year stands at 56%, according to CME’s FedWatch; whether this is about to change on Wednesday, relies on the Fed dot plot and Chair Janet Yellen's speech.
Details on the balance sheet normalization are also expected to be announced on Wednesday. Thisprobably won’t have a significant impact on the dollar, as the Fed has been preparing markets for many months. However, we still don’t know the long-term implication of thisprocess. Normalizing the balance sheet will likely put U.S. long-term treasury at risk when the supply begins to increase. This will not only impact yields on bonds, but will also have a negative influence on U.S. equities.
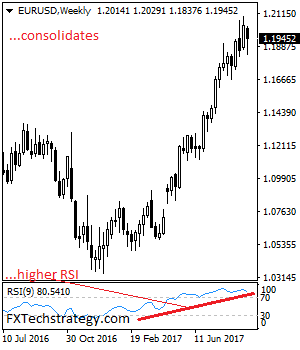
EURUSD – Broader Bias Remains Higher But With Caution
EURUSD - With the pair still holds on to its broader uptrend despite lower close the past week. Resistance comes in at 1.2000 level with a cut through here opening the door for more upside towards the 1.2050 level. Further up, resistance lies at the 1.2100 level where a break will expose the 1.2150 level. Conversely, support lies at the 1.1800 level where a violation will aim at the 1.1750 level. A break of here will aim at the 1.1700 level. Below here will open the door for more weakness towards the 1.1650. All in all, EURUSD faces further upside pressure though with caution.
GBPJPY Intraday Analysis
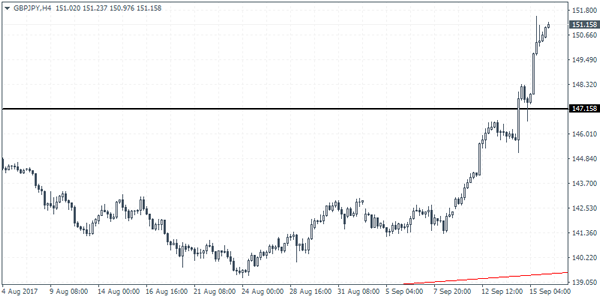
GBPJPY (151.15): Having posted strong gains last week, the GBPJPY has broken out from the ascending triangle pattern on a weekly timeframe. This puts the minimum upside to 159.75. However, ahead of a further rally in the currency pair, the support level at 147.15 needs to be tested having previously served as resistance. Any declines are likely to be stalled at this level as GBPJPY could prepare for another leg to the upside. Failure to reverse the correction at 147.15 could, however, signal an impending decline in the currency pair that could reverse the risk to the downside.
GBPUSD Intraday Analysis
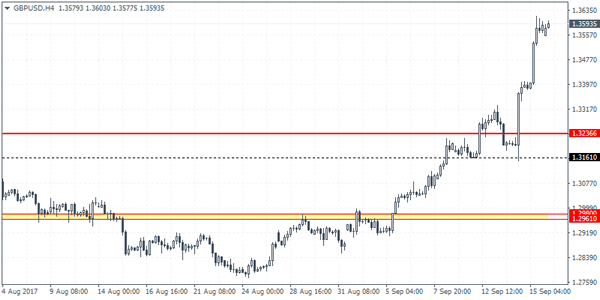
GBPUSD (1.3593): The British pound rallied strongly after rate hike expectations from the BoE found renewed optimism. GBPUSD close at 1.3588 by Friday's close. The cable now remains within a few pips short of filling the gap at 1.3677 from the June 2016 Brexit event that saw prices gapping lower. We do expect this rally to 1.3677 to be a touch and go event as the GBP is likely to take a breather in the short term. Support is now seen at 1.3236, exposing a large downside risk to the currency pair. Economic data from the UK this week is limited to only the retail sales numbers on Wednesday and of course the FOMC meeting later in the day.
EURUSD Intraday Analysis
The US dollar was seen giving up some of the gains by Friday's close, but the US dollar index was seen supported above the multi-year support level of 91.44. As a new trading week unfolds, all eyes are on the FOMC meeting due this Wednesday. Last week saw the British pound emerging on the top logging over 3% gains against the US dollar. This came as the Bank of England signaled that interest rates could rise in the coming months.
The Japanese yen was, of course, the weakest, as the currency declined 2.5% on the week by Friday's close. This made GBPJPY the currency pair logging the biggest gains as a result.
The economic calendar today is relatively light. Scheduled for 0900 GMT, the Eurostat will be releasing the final inflation figures for August. Based on the flash inflation estimates, consumer prices in the eurozone are forecast to rise 1.5% on the headline and 1.2% on the core. While headline CPI is accelerating, core CPI continues to remain sluggish in comparison. Still, the inflation data is unlikely to dent the sentiment in the euro currency.
Eurozone CPI To Confirm Consumer Prices Are Rising
The US dollar was seen giving up some of the gains by Friday's close, but the US dollar index was seen supported above the multi-year support level of 91.44. As a new trading week unfolds, all eyes are on the FOMC meeting due this Wednesday. Last week saw the British pound emerging on the top logging over 3% gains against the US dollar. This came as the Bank of England signaled that interest rates could rise in the coming months.
The Japanese yen was, of course, the weakest, as the currency declined 2.5% on the week by Friday's close. This made GBPJPY the currency pair logging the biggest gains as a result.
The economic calendar today is relatively light. Scheduled for 0900 GMT, the Eurostat will be releasing the final inflation figures for August. Based on the flash inflation estimates, consumer prices in the eurozone are forecast to rise 1.5% on the headline and 1.2% on the core. While headline CPI is accelerating, core CPI continues to remain sluggish in comparison. Still, the inflation data is unlikely to dent the sentiment in the euro currency.
Bank of Japan Meeting Concluding On Thursday
Market movers today
Today we have a very light data calendar with the final euro area inflat ion prints for August due out , although we do not estimate any significant changes.
Later in the week the focus will be on the FOMC meet ing on Wednesday, where we expect the Fed to announce that it will begin shrinking its balance sheet in October, the Bank of Japan meeting concluding on Thursday as well as PM T heresa May’s speech on Brexit in Florence on Friday.
In Scandinavia, the week peaks on Thursday with the Norges Bank monetary policy meeting and minutes from the Riksbank's September monetary policy meeting. We share the consensus view that Norges Bank will not touch interest rates.
Selected market news
Risk appetite improved in the US session on Friday as concerns about the worst-case scenarios for North Korea and hurricanes in the US eased. The large US equity indices ended the day higher after the negat ive close in Europe on Friday and in Asia this morning, regional indices trade higher while the yen has weakened versus all other G10 currencies. Japanese markets are closed for a holiday.
The series of US data released on Friday was a relatively mixed bag: while both US indust rial product ion and US retail sales for August came out weaker than expected, the empire manufacturing index surprised on the upside. It was widely expected that the August print s were distorted due to Hurricane Harvey, and in isolat ion this is not be a concern as such. ISM and regional surveys for manufacturing are quite robust , so manufacturing is likely to be doing fine. However, the down-revision to both June and July retail sales were a surprise indicat ing that momentum in US consumpt ion might have been over a longer period of t ime. We should expect more data for August and September to be distorted as Hurricane Irma is also affect ing numbers.
In Japan, speculat ion that Prime Minister Shinzo Abe is considering calling for a snap general elect ion is growing as Abe’s support has increased following the cabinet reshuffle in August and not least due to his handling of the North Korea crisis. According to the broadcaster NHK, Abe is likely to dissolve the Lower House in late September and call for a general election in late October. The political calendar in Japan is packed with important events in the coming years. Besides the possibility of an early elect ion, focus in coming months will also be on who will be appointed to lead the BoJ once Haruhiko Kuroda’s five-year term ends in April 2018. Increased polit ics in Japan may lead to more volatility on Japanese markets and induce some JPY appreciat ion.
On Friday, we published our new FX Forecast Update: A tale of three central-bank camps and Yield Outlook - Central banks gradually turning more hawkish. The most significant change in our new forecast is that we now expect the Bank of England to hike the Bank Rate by 25bp in November.
Market Update – Asian Session: Equities Markets Rally While China Housing Prices Gradually Slow
Asia Summary
Asian equity markets opened higher (Japan closed) taking its cue from a strong US session Friday. Hong Kong Hang Seng tested levels not seen since Dec 2007. The PBOC injected CNY300B in OMO, the most since January. NZD rose 0.5% against the US dollar after opening slightly weaker on New Zealand Refining disclosing a leak in a pipeline. So far the company is unsure how long it will take to repair and as a result the Govt is support supplies to Air New Zealand and Auckland airport. Both the Kospi and the won failed to react to North Korea activity and rhetoric. Trump spoke with S. Korea President Moon over the weekend and a US aircraft carrier is expected in South Korea in October. China released its August property price data, showing a modest slowdown, property names in China and Hong Kong took some strength on the news. Markets to remain focused on Fed meeting later this week and Bank of Japan.
Key economic data
(SG) SINGAPORE AUG NON-OIL DOMESTIC EXPORTS M/M: 4.5% V 3.1%E; Y/Y: 17.0% V 11.8%E; ELECTRONIC EXPORTS Y/Y: 21.7% V 15.0%E
(AU) AUSTRALIA AUG MOTOR VEHICLE SALES M/M: 0.0% V -2.4% PRIOR; Y/Y: 1.7% V 1.7% PRIOR
(CN) CHINA AUG PROPERTY PRICES M/M: RISE IN 46 OUT OF 70 CITES VS 56 PRIOR; Y/Y RISE IN 68 OUT OF 70 CITIES VS 70 PRIOR
Speakers and Press
China/Hong Kong
(CN) China economic growth may slow down in Q4, sees 2017 GDP at 6.8% - Chinese press
(CN) China Banking Regulatory Commission (CBRC) reports Aug Bank Bad Loan Ratio 1.86% - Xinhua
(CN) China Insurance Regulator (CIRC) to strengthen risk prevention by preventing risks stemming from excessive rapid growth in overseas investments - financial press
(HK) HKMA Chief Chan: Have confidence in HK$, no plans to change the peg; HK needs to diversify in terms of IPOs
Korea
(KR) According to KCNA, Kim Jong Un guided Hwasong-12 launching drill; Drill conducted to calm down “belligerence of the US"
(CN) South Korea investment into China for July YTD $1.75B v $3.1B y/y, -43.7% y/y - Korean press
(KR) South Korea defense ministry official: There is possibility of North Korean provocation, including additional ballistic missile launches and 7th nuclear test
Australia/New Zealand
(AU) Moody's: Australia residential mortgage arrears are at a 5-yr high and expected to increase
(AU) S&P: Australia July delinquent home loans underlying prime RMBS 1.17% v 1.15% m/m
Japan
(JP) Japan PM Abe said to be considering snap election as soon as Oct - financial press
Asian Equity Indices/Futures (00:00ET)
Nikkei closed, Hang Seng +1.1%; Shanghai Composite +0.2%, ASX200 +0.5%, Kospi +1.1%
Equity Futures: S&P500 +0.2%; Nasdaq100 +0.2%, Dax +0.4%, FTSE100 +0.3%
FX ranges/Commodities/Fixed Income (00:00ET)
EUR 1.1955-1.1920; JPY 111.25-110.81; AUD 0.8035-0.7995;NZD 0.7343-0.7277
Dec Gold -0.3% at $1,321/oz; Nov Crude Oil 0.0% at $50.45/brl; Sept Copper +0.9% at $2.98/lb
(AU) Australia repurchases A$700M in 2018 and 2019 bonds, bid to cover 4.22x
(AU) Australia sells A$700M in 3.75% 2029 bonds; avg yield 2.8842%; bid-to-cover 3.39x
USD/CNY (CN) China PBOC sets yuan reference rate at 6.5419 v 6.5423 prior
(CN) PBoC OMO: injects CNY300B in 7 and 28-day (largest injection since January) vs injected combined CNY200B in 7,14 and 28 day reverse repos prior
(KR) Bank of Korea (BOK) sells KRW480B in 6-month bonds at 1.33%
(KR) South Korea Govt sells KRW629B 20-yr bond 2.28% v 2.38% prior
Equities notable movers
Australia/New Zealand
NZO.AU Confirms O.G Oil's partial takeover offer to acquire 67.6% stake; to create independent committee to respond; +3.5%
EVN.AU To sell Edna May mine to Ramelius for up to A$90M; Cuts FY18 production guidance following deal to 750-805K ozs (820-880K prior) at AISC of A$820-A$870/oz (prior A$850-900/oz)
NZR.NZ Reports leak at pipeline from refinery to Wiri; to impact revenues by NZ$10-15M, sees negative impact on income for pipeline and refining businesses; -3.2%
Hong Kong/China
2196.HK Updates offer for Gland Pharma: to acquire 74% stake for $1.09B; +2.6%; 656.HK Fosun International Ltd, +9.3%
US
OA Northrop Grumman said to be near deal to acquire Orbital ATK for over $7.5B in cash; deal could be announced as early as Monday - US financial press
USD/JPY Candlesticks and Ichimoku Analysis
Weekly
• Last Candlesticks pattern: Dark cloud cover
• Time of formation: 10 Jul 2017
• Trend bias: Down
Daily
• Last Candlesticks pattern: Evening doji
• Time of formation: 7 Aug 2017
• Trend bias: Down
USD/JPY – 111.30
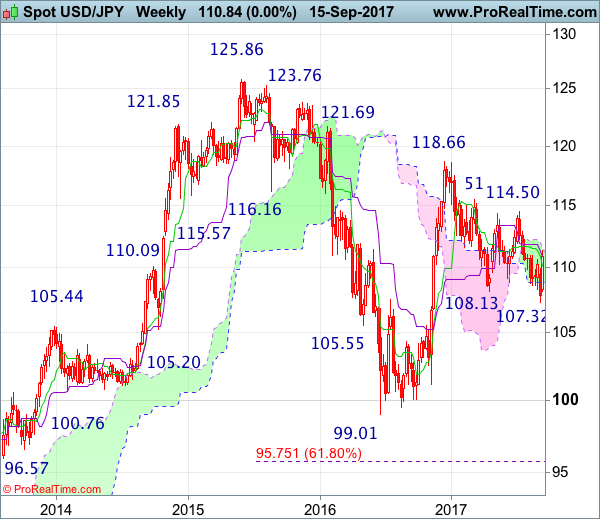
Despite falling to 107.32, the subsequent much stronger-than-expected rebound suggests a temporary low has been formed there and consolidation with upside bias is seen for test of 111.62-65 (current level of the upper Kumo and 38.2% Fibonacci retracement of 118.66-107.32), then towards previous resistance at 112.20, however, a sustained breach above there is needed to add credence to this view, bring retracement of recent entire decline from 118.66 to 112.99-00 (50% Fibonacci retracement) but reckon upside would be limited to 113.50-60, price should falter below 114.00.
On the downside, whilst pullback to 110.45-50 cannot be ruled out, reckon support at 109.90 would limit downside and bring another rise later. Below support at 109.55 would abort and suggest the rebound from 107.32 has ended instead, bring weakness to 109.00, however, still reckon downside would be limited to 108.45-50 and this week’s low at 108.12 should remain intact, price should stay well above recent low at 107.32, brig another rebound later.
Recommendation : Buy at 110.00 for 112.00 with stop below 109.00
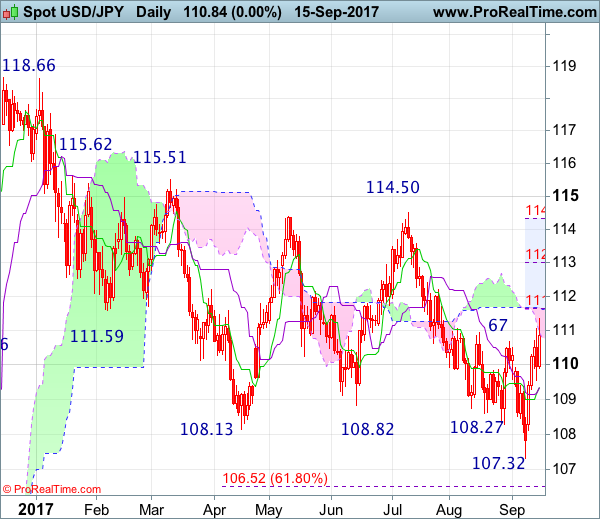
On the weekly chart, the greenback opened higher last week and staged a stronger-than-expected rebound, a long white candlestick was formed, suggesting a temporary low has been made at 107.32, hence consolidation with mild upside bias is seen for gain to 112.20 resistance, however, above 112.99-00 (50% Fibonacci retracement of 118.66-107.32) is needed to signal recent entire decline from 118.66 has ended, bring further rise to 113.50-60, then towards 114.00 but price should falter well below chart resistance at 114.50 (July high) and bring retreat later.
On the downside, although initial pullback to 110.40-50 is likely, reckon the Tenkan-Sen (now at 109.76) would limit downside and the lower Kumo (now at 108.84) should hold, bring another rebound later. A drop below last week’s low at 108.12 would abort and suggest the rebound from 107.32 hs ended instead, bring retest of this level. Looking ahead, only a drop below 107.32 would signal the decline from 118.66 top has resume,ed and extend weakness to 107.00, then 106.50-55 (61.8% Fibonacci retracement of 99.01-118.66), however, previous resistance at 105.53 (now support) should remain intact.